

Meta-analysis of northeast Atlantic marine taxa shows contrasting phylogeographic patterns following post-LGM expansions
- PMID: 30280047
- PMCID: PMC6166638
- DOI: 10.7717/peerj.5684
Meta-analysis of northeast Atlantic marine taxa shows contrasting phylogeographic patterns following post-LGM expansions
Abstract
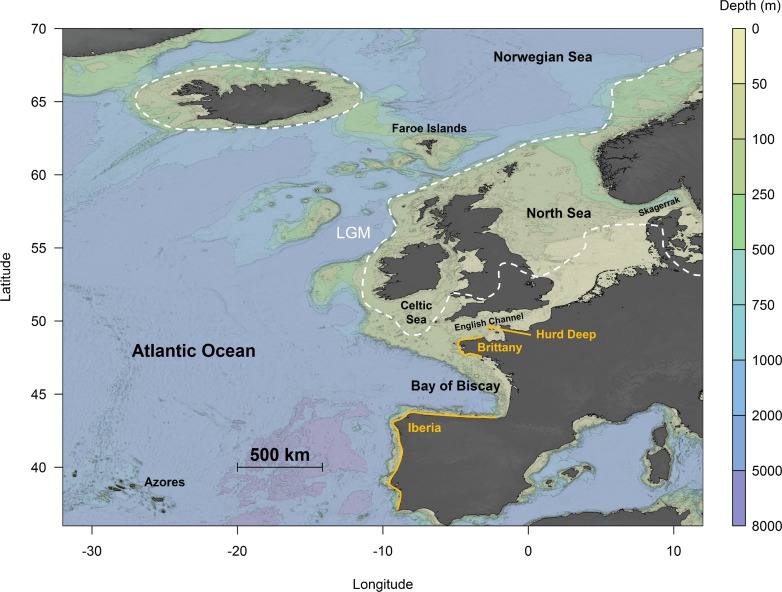
Background: Comparative phylogeography enables the study of historical and evolutionary processes that have contributed to shaping patterns of contemporary genetic diversity across co-distributed species. In this study, we explored genetic structure and historical demography in a range of coastal marine species across the northeast Atlantic to assess whether there are commonalities in phylogeographic patterns across taxa and to evaluate whether the timings of population expansions were linked to the Last Glacial Maximum (LGM).
Methods: A literature search was conducted using Web of Science. Search terms were chosen to maximise the inclusion of articles reporting on population structure and phylogeography from the northeast Atlantic; titles and abstracts were screened to identify suitable articles within the scope of this study. Given the proven utility of mtDNA in comparative phylogeography and the availability of these data in the public domain, a meta-analysis was conducted using published mtDNA gene sequences. A standardised methodology was implemented to ensure that the genealogy and demographic history of all mtDNA datasets were reanalysed in a consistent and directly comparable manner.
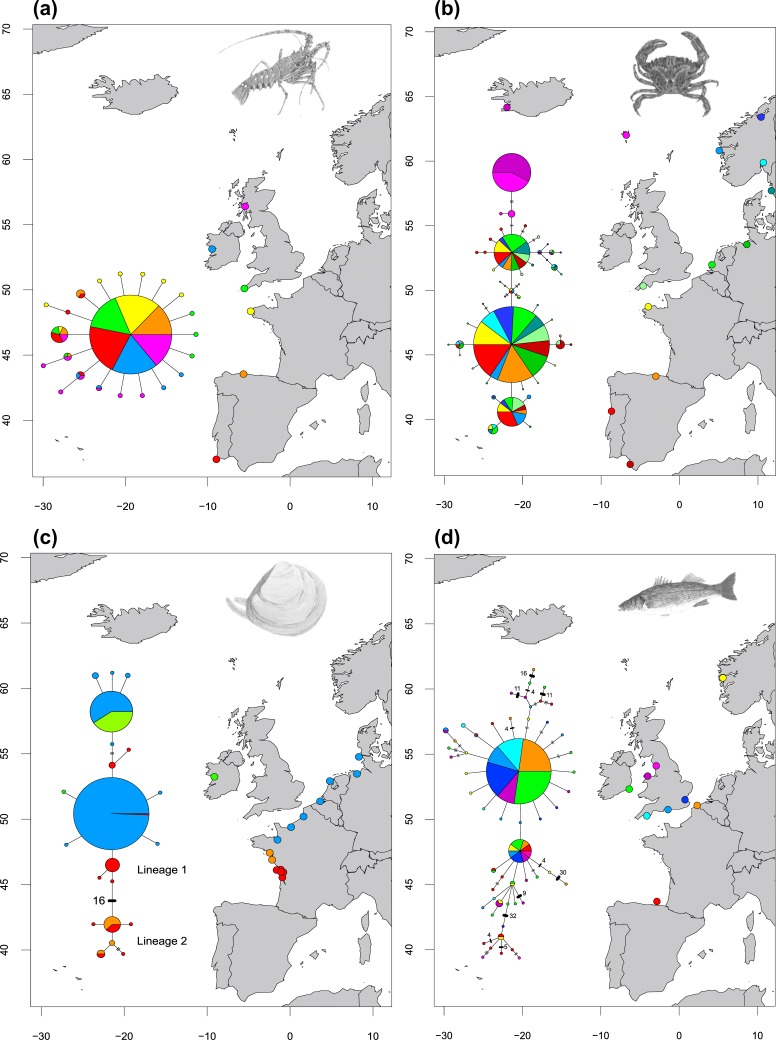
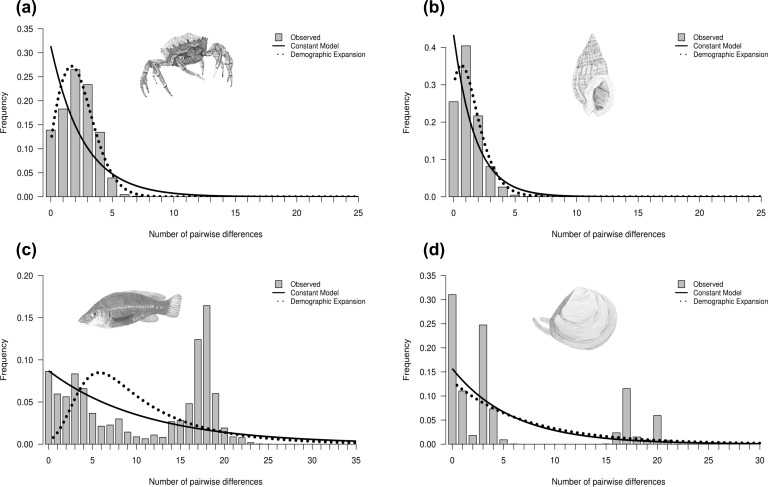
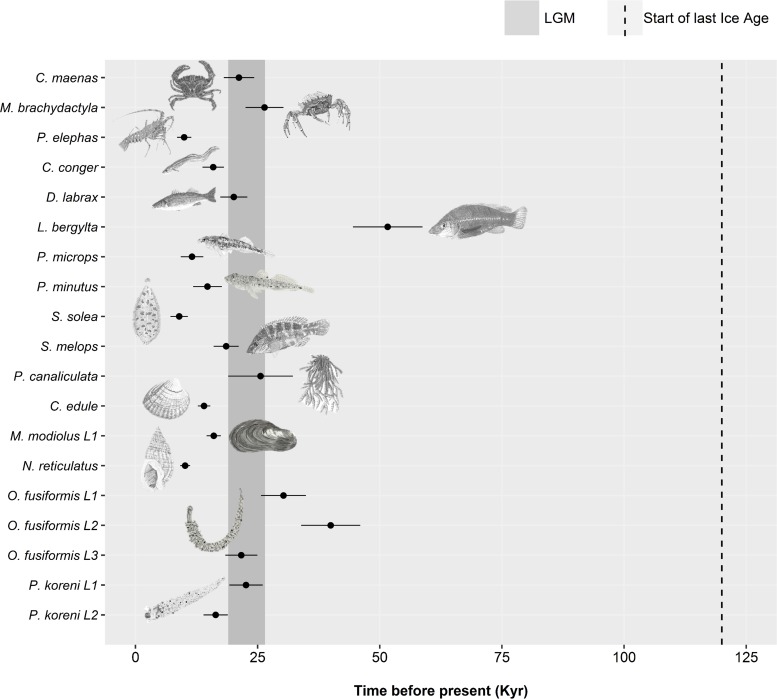
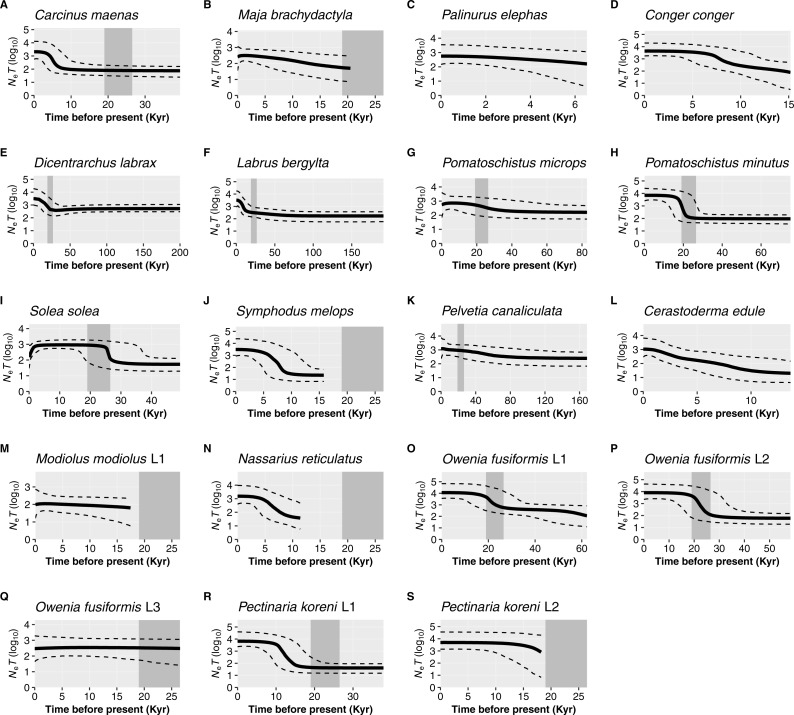
Results: Mitochondrial DNA datasets were built for 21 species. The meta-analysis revealed significant population differentiation in 16 species and four main types of haplotype network were found, with haplotypes in some species unique to specific geographical locations. A signal of rapid expansion was detected in 16 species, whereas five species showed evidence of a stable population size. Corrected mutation rates indicated that the majority of expansions were estimated to have occurred after the earliest estimate for the LGM (∼26.5 Kyr), while few expansions were estimated to have pre-dated the LGM.
Conclusion: This study suggests that post-LGM expansion appeared to be common in a range of marine taxa, supporting the concept of rapid expansions after the LGM as the ice sheets started to retreat. However, despite the commonality of expansion patterns in many of these taxa, phylogeographic patterns appear to differ in the species included in this study. This suggests that species-specific evolutionary processes, as well as historical events, have likely influenced the distribution of genetic diversity of marine taxa in the northeast Atlantic.
Keywords: Comparative phylogeography; Historical demography; Last Glacial Maximum; Northeast Atlantic; Population expansion; mtDNA.
Conflict of interest statement
Rita Castilho is an Academic Editor for PeerJ.
Figures
References
-
- Almada F, Francisco SM, Lima CS, FitzGerald R, Mirimin L, Villegas-Ríos D, Saborido-Rey F, Afonso P, Morato T, Bexiga S, Robalo JI. Historical gene flow constraints in a northeastern Atlantic fish: phylogeography of the ballan wrasse Labrus bergylta across its distribution range. Royal Society Open Science. 2017;4:160773. doi: 10.1098/rsos.160773. - DOI - PMC - PubMed
-
- Alvarado-Bremer JR, Vinas J, Mejuto J, Ely B, Pla C. Comparative phylogeography of Atlantic bluefin tuna and swordfish: the combined effects of vicariance, secondary contact, introgression, and population expansion on the regional phylogenies of two highly migratory pelagic fishes. Molecular Phylogenetics and Evolution. 2005;36:169–187. doi: 10.1016/j.ympev.2004.12.011. - DOI - PubMed
-
- Avise JC. Phylogeography: retrospect and prospect. Journal of Biogeography. 2009;36:3–15. doi: 10.1111/j.1365-2699.2008.02032.x. - DOI
-
- Avise JC, Arnold J, Ball RM, Bermingham E, Lamb T, Neigel JE, Reeb CA, Saunders NC. Intraspecific phylogeography: the mitochondrial DNA bridge between population genetics and systematics. Annual Review of Ecology and Systematics. 1987;18:489–522. doi: 10.1146/annurev.es.18.110187.002421. - DOI
-
- Barido-Sottani J, Bošková V, Plessis LD, Kühnert D, Magnus C, Mitov V, Müller NF, Pečerska J, Rasmussen DA, Zhang C, Drummond AJ, Heath TA, Pybus OG, Vaughan TG, Stadler T. Taming the BEAST—a community teaching material resource for BEAST 2. Systematic Biology. 2018;67:170–174. doi: 10.1093/sysbio/syx060. - DOI - PMC - PubMed
LinkOut - more resources
Full Text Sources
