Review
. 2018 Dec 26;118(24):11519-11574.
doi: 10.1021/acs.chemrev.8b00038. Epub 2018 Oct 3.

Biomolecular Assemblies: Moving from Observation to Predictive Design

Affiliations
Review

Biomolecular Assemblies: Moving from Observation to Predictive Design

Corey J Wilson et al. Chem Rev. .

Abstract

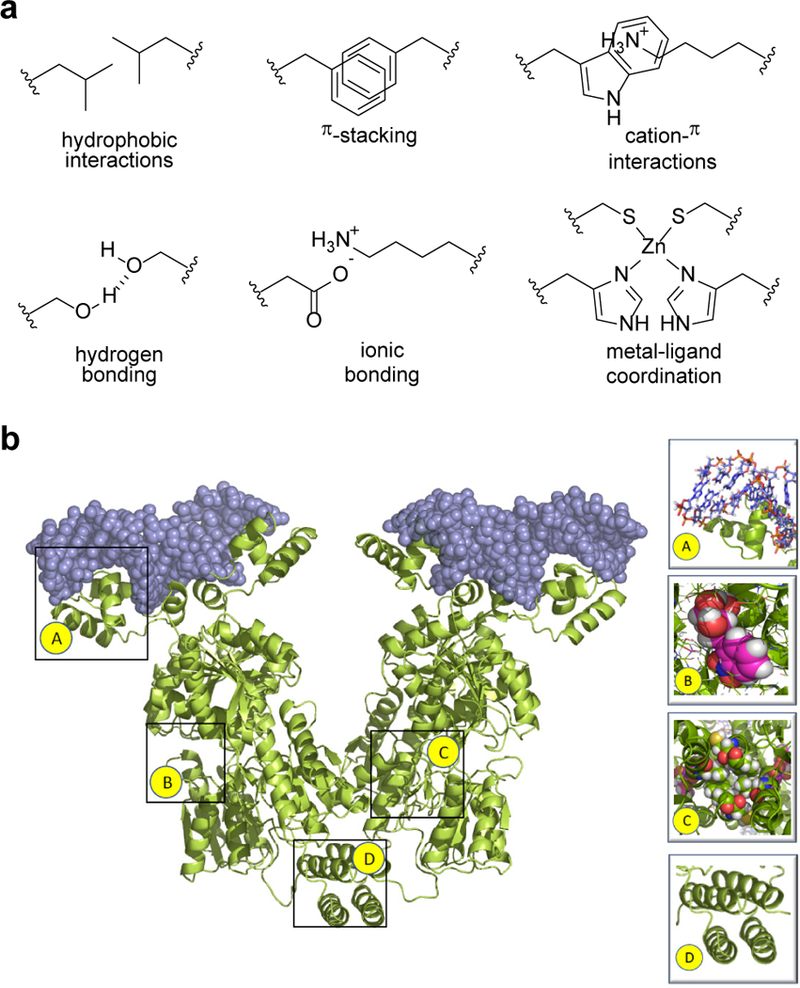
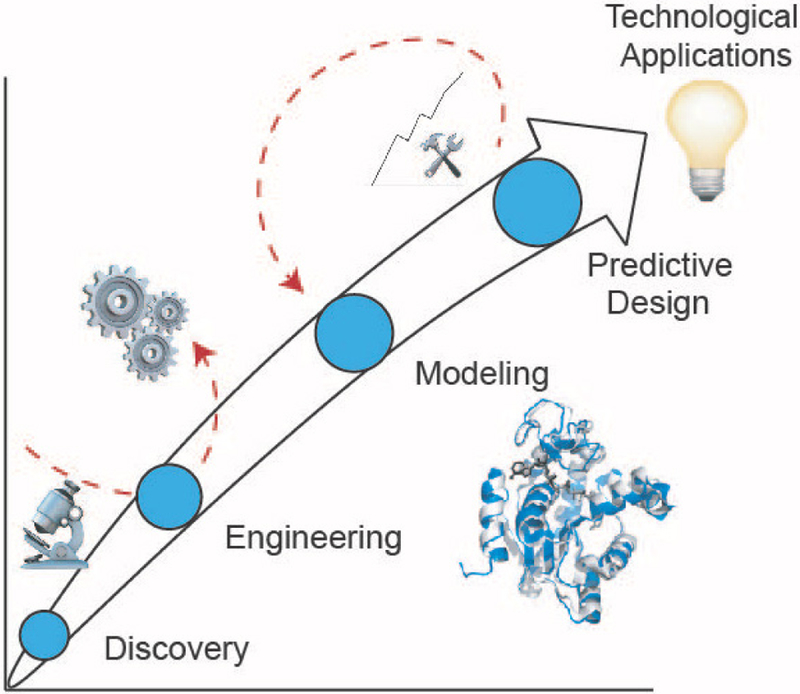
Biomolecular assembly is a key driving force in nearly all life processes, providing structure, information storage, and communication within cells and at the whole organism level. These assembly processes rely on precise interactions between functional groups on nucleic acids, proteins, carbohydrates, and small molecules, and can be fine-tuned to span a range of time, length, and complexity scales. Recognizing the power of these motifs, researchers have sought to emulate and engineer biomolecular assemblies in the laboratory, with goals ranging from modulating cellular function to the creation of new polymeric materials. In most cases, engineering efforts are inspired or informed by understanding the structure and properties of naturally occurring assemblies, which has in turn fueled the development of predictive models that enable computational design of novel assemblies. This Review will focus on selected examples of protein assemblies, highlighting the story arc from initial discovery of an assembly, through initial engineering attempts, toward the ultimate goal of predictive design. The aim of this Review is to highlight areas where significant progress has been made, as well as to outline remaining challenges, as solving these challenges will be the key that unlocks the full power of biomolecules for advances in technology and medicine.


Figures

Figure 1
Figure 1
(a) Intermolecular interactions utilized in biomolecular assembly. (b) Lac repressor binding to target DNA, highlighting key interaction motifs: (A) electrostatic, (B) hydrogen bonding, (C) hydrophobic packing, (D) hydrophobic and electrostatic interactions.
Figure 2
Figure 2
Story arc from initial discovery of an assembly to predictive design. Red arrows depict iteration and the availability of different on-ramps and off-ramps in this process.
Figure 3
Figure 3
The protein folding funnel. The curved red arrow highlights the transition between protein folding and protein assembly. Reprinted with permission from Eichner, T.; Radford, S. E. A diversity of assembly mechanisms of a generic amyloid fold. Mol. Cell 2011, 43, 8–18. Copyright 2011 Elsevier.
Figure 4
Figure 4
(a) Peptide assembly by classical nucleation. Monomers aggregate directly into structured assemblies and only assemblies above a critical size are propagated. (b) Peptide assembly by non-classical, two-step nucleation. Monomers first undergo liquid-liquid phase separation to form oligomeric particles, which then transition into structured assemblies. Reprinted with permission from Hsieh, M. C.; Lynn, D. G.; Grover, M. A. Kinetic Model for Two-Step Nucleation of Peptide Assembly. J. Phys. Chem. B 2017, 121, 7401–7411. Copyright 2017 American Chemical Society.
Figure 5
Figure 5
Assembly of (a) amyloid β, (b) α-synuclein and (c) polyglutamine peptides kinetically fit using the Finke-Watzky mechanism (Scheme 1). This simplified mechanism is capable of fitting assemblies having lag phases. Reprinted with permission from Morris, A. M.; Watzky, M. A.; Agar, J. N.; Finke, R. G. Fitting Neurological Protein Aggregation Kinetic Data via a 2-Step, Minimal/”Ockham’s Razor” Model: The Finke-Watzky Mechanism of Nucleation Followed by Autocatalytic Surface Growth. Biochemistry 2008, 47, 2413–2427. Copyright 2008 American Chemical Society.
Figure 6
Figure 6
Two-step nucleation mechanism for (a) Boc-FF, (b) Aβ(16–22), and (c) Aβ(16–22)E22L peptides. Peptide particles are observed before the emergence of ordered fibers. Scale bars = 100 nm for (b) and 200 nm for (c). Reprinted with permission from Levin, A.; Mason, T. O.; Adler-Abramovich, L.; Buell, A. K.; Meisl, G.; Galvagnion, C.; Bram, Y.; Stratford, S. A.; Dobson, C. M.; Knowles, T. P.; Gazit, E. Ostwald’s rule of stages governs structural transitions and morphology of dipeptide supramolecular polymers. Nat. Commun. 2014, 5, 5219. Copyright 2014 Springer Nature. Reprinted with permission from Hsieh, M. C.; Lynn, D. G.; Grover, M. A. Kinetic Model for Two-Step Nucleation of Peptide Assembly. J. Phys. Chem. B 2017, 121, 7401–7411. Copyright 2017 American Chemical Society. Reprinted with permission from Liang, C.; Ni, R.; Smith, J. E.; Childers, W. S.; Mehta, A. K.; Lynn, D. G. Kinetic intermediates in amyloid assembly. J. Am. Chem. Soc. 2014, 136, 15146–15149. Copyright 2014 American Chemical Society.
Figure 7
Figure 7
Morphological evolution Aβ(16–22) peptide assemblies from 1 h to 9 days. Ribbon intermediates are initially observed, but are later replaced by fibers. Reprinted with permission from Hsieh, M. C.; Liang, C.; Mehta, A. K.; Lynn, D. G.; Grover, M. A. Multistep Conformation Selection in Amyloid Assembly. J. Am. Chem. Soc. 2017, 139, 17007–17010. Copyright 2017 American Chemical Society.
Figure 8
Figure 8
Structural evolution arising from (a) configuration mutation at the assembly termini and (b) surface nucleation. Blue assemblies represent the kinetic intermediates and green assemblies represent the thermodynamically stable final assembly state.
Figure 9
Figure 9
Levels of peptide structure within assemblies for (a) conformation of the peptide backbone and the 3-dimensional arrangement of sidechain groups for β-strand and α-helix, (b) multiple secondary structural units organizing to form cross-β assemblies or α-helical coiled coils, (c) stacking of β-sheets and bundling of coiled coils.
Figure 10
Figure 10
Sample models for molecular organization with (a) a peptide nanofiber, (b) a nanosheet, (c) a nanotube, and (d) a nanoparticle. Reprinted with permission from Cormier, A. R.; Pang, X.; Zimmerman, M. I.; Zhou, H.-X.; Paravastu, A. K. Molecular structure of RADA16-I designer self-assembling peptide nanofibers. ACS Nano 2013, 7, 7562–7572. Copyright 2013 American Chemical Society. Reprinted with permission from Magnotti, E. L.; Hughes, S. A.; Dillard, R. S.; Wang, S.; Hough, L.; Karumbamkandathil, A.; Lian, T.; Wall, J. S.; Zuo, X.; Wright, E. R. Self-Assembly of an α-Helical Peptide into a Crystalline Two-Dimensional Nanoporous Framework. J. Am. Chem. Soc. 2016, 138, 16274–16282. Copyright 2016 American Chemical Society. Reprinted with permission from Childers, W. S.; Mehta, A. K.; Ni, R.; Taylor, J. V.; Lynn, D. G. Peptides Organized as Bilayer Membranes. Angew. Chem. Int. Ed. 2010, 49, 4104–4107. Copyright 2010 John Wiley and Sons. Reprinted with permission from Thomson, A. R.; Wood, C. W.; Burton, A. J.; Bartlett, G. J.; Sessions, R. B.; Brady, R. L.; Woolfson, D. N. Computational design of water-soluble α-helical barrels. Science 2014, 346, 485–488. Copyright 2014 American Association for the Advancement of Science.
Figure 11
Figure 11
Nanoscale morphologies that are possible for peptide assemblies: (a) nanofibers, (b) nanosheets, and (c) nanoparticles, imaged by TEM (a and c) or AFM (b). The cross-section in Panel b shows the nanosheet thickness. Scale bars in Panels a, b, and c correspond to 50 nm, 200 nm, and 500 nm, respectively. Reprinted with permission from Reprinted with permission from Cormier, A. R.; Pang, X.; Zimmerman, M. I.; Zhou, H.-X.; Paravastu, A. K. Molecular structure of RADA16-I designer self-assembling peptide nanofibers. ACS Nano 2013, 7, 7562–7572. Copyright 2013 American Chemical Society. Reprinted with permission from Jiang, T.; Xu, C.; Liu, Y.; Liu, Z.; Wall, J. S.; Zuo, X.; Lian, T.; Salaita, K.; Ni, C.; Pochan, D.; Conticello, V. P. Structurally defined nanoscale sheets from self-assembly of collagen-mimetic peptides. J. Am. Chem. Soc. 2014, 136, 4300–4308. Copyright 2014 American Chemical Society. Tian, Y.; Zhang, H. V.; Kiick, K. L.; Saven, J. G.; Pochan, D. J. Transition from disordered aggregates to ordered lattices: kinetic control of the assembly of a computationally designed peptide. Org. Biomol. Chem. 2017, 15, 6109–6118. Copyright 2017 Royal Society of Chemistry.
Figure 12
Figure 12
Ternary mixtures of water, organic solvent, and surfactant can give rise to diverse assembly types. The phase diagram for water:hexanol:cetyltrimethylammonium bromide (CTAB) indicates conditions for formation of (a) micelles, (b) reverse micelles, (c) lamellar aggregates, and (d) hexagonal aggregates. Adapted with permission from Martinek, K.; Levashov, A. V.; Klyachko, N.; Khmelnitski, Y. L.; Berezin, I. V. Micellar enzymology. FEBS J. 1986, 155, 453–468. Copyright 1986 John Wiley and Sons.
Figure 13
Figure 13
Assembly of GOx and HRP enzymes on hexagonal DNA tiles enables precise control over length scales between enzymes. Reprinted with permission from Wilner, O. I.; Weizmann, Y.; Gill, R.; Lioubashevski, O.; Freeman, R.; Willner, I. Enzyme cascades activated on topologically programmed DNA scaffolds. Nature Nanotechnol. 2009, 4, 249–254. Copyright 2009 Springer Nature.
Figure 14
Figure 14
Ribbon diagram representation of the Qβ capsid protein (pdb: 1 qbe). The C74-C80 disulfide bonds are depicted in yellow. Reprinted with permission from Fiedler, J. D.; Higginson, C.; Hovlid, M. L.; Kislukhin, A. A.; Castillejos, A.; Manzenrieder, F.; Campbell, M. G.; Voss, N. R.; Potter, C. S.; Carragher, B.; Finn, M. G. Engineered mutations change the structure and stability of a virus-like particle. Biomacromolecules 2012, 13, 2339–2348. Copyright 2012 American Chemical Society.
Figure 15
Figure 15
Function of the lactose operon is dependent upon available carbohydrate sources. Changes in carbohydrate binding impact assembly, and thus function.
Figure 16
Figure 16
Structure of tetrameric LacI-Osym assembly with domains labeled (left). LacI monomer topology and domain structure (right). Note that the topology of folding involves three cross-overs between the N- and C-subdomains.
Figure 17
Figure 17
Protein DNA Assemblies. (a) Structure of DNA binding domain and operator DNA (Osym). (b) Wild-type operator DNA (O1) and auxiliary operators O2 and O3. O1, O2, O3, and Osym all assemble with wild-type the DNA binding domain D1. Variations of operator DNA (OS2, OS3, OS4, and OS5) assemble with orthogonal DNA binding domains (DS2, DS3, DS4, and DS5).
Figure 18
Figure 18
Comparing theoretical prediction to experimental data for LacI folding. Normalized CD signals are plotted as a function of fluorescence signals and color coded by phase (squares = experimental; circles = theoretical).
Figure 19
Figure 19
Selected examples of engineering of the lac repressor.
Figure 20
Figure 20
Early examples of assembled protein scaffolds: (a) elastin-like polypeptide coacervates and (b) leucine zipper hydrogels.
Figure 21
Figure 21
Common motifs utilized in assembly of protein scaffolds.
Figure 22
Figure 22
Selected examples of engineered protein scaffolds.
Figure 23
Figure 23
Nucleated polymerization of amyloids or prions (squares) from non-amyloid isoform (circle).
Figure 24
Figure 24
Structural and functional organization of fungal prion proteins.
Figure 25
Figure 25
De novo prion formation, cross-seeding and propagation in yeast. (a) Induction of the formation of a prion isoform ([PSI+]) of Sup35 protein by transient overproduction of Sup35 protein or its prion domain (PrD) is facilitated in the presence of a prion isoform ([PIN+]) of another protein, Rnq1, presumably due to a cross-seeding. Misfolded intermediate is indicated by a green ellipse, other designations are as on Figure 23. (b) Prion fragmentation and propagation by a chaperone machinery. Chaperone proteins are as designated (Hsp104 is a hexamer). Green rectangles indicate units of an amyloid fibril.
Figure 26
Figure 26
Types of amyloid structures. Arrows indicate β-strands, different polypeptides are shown by different colors.
Figure 27
Figure 27
Examples of amyloid structural models. (a) Het-s. (b) Aβ42 . (c) Amyloid core of a tau fibril. Arrows indicate β-strands. Reprinted with permission from Wasmer, C.; Lange, A.; Van Melckebeke, H.; Siemer, A. B.; Riek, R.; Meier, B. H. Amyloid fibrils of the HET-s (218–289) prion form a β solenoid with a triangular hydrophobic core. Science 2008, 319, 1523–1526. Copyright 2008 American Association for the Advancement of Science. Reprinted with permission from Wälti, M. A.; Ravotti, F.; Arai, H.; Glabe, C. G.; Wall, J. S.; Böckmann, A.; Güntert, P.; Meier, B. H.; Riek, R. Atomic-resolution structure of a disease-relevant Aβ (1–42) amyloid fibril. Proc. Natl. Acad. Sci. U. S. A. 2016, 113, E4976-E4984. Copyright 2016 National Academy of Sciences. Reprinted with permission from Fitzpatrick, A. W. P.; Falcon, B.; He, S.; Murzin, A. G.; Murshudov, G.; Garringer, H. J.; Crowther, R. A.; Ghetti, B.; Goedert, M.; Scheres, S. H. W. Cryo-EM structures of tau filaments from Alzheimer’s disease. Nature 2017, 547, 185–190. Copyright 2017 Springer Nature.
Figure 28
Figure 28
Molecular basis of prion/amyloid strains. (a) Phenotypic stringency of the strong and weak strains of yeast prion protein Sup35, as indicated by color on complete medium (stronger prion phenotype is associated with less accumulation of a red pigment, leading to a lighter color). (b) Differences in mitotic stability between strong and weak prion strains of Sup35 protein (mitotic loss of a prion leads to generation of red colonies). (c) Differences in proportion of aggregated (P, pellet) and non-aggregated (S, supernatant) protein between extracts of yeast cells bearing the strong and weak strains of the Sup35 prion, as demonstrated by differential centrifugation, followed by SDS-PAGE and reaction to Sup35 antibodies. (d) Differences in the length of amyloid core between the strong and weak strains of the Sup35 prion. Presumable β-strands are schematically indicated by boxes, and hydrogen bonds by dashes.
Scheme 1
Scheme 1
The Finke-Watzky mechanism of nucleation followed by autocatalytic growth [35]. A is the unassembled free peptide, which nucleates into the assembled peptide B with rate constant kn. The unassembled A may also undergo autocatalytic reaction (ke) to produce the assembled
Scheme 2
Scheme 2
Number of nuclei (Nc) as a function of the volume (v0) of individual intermediate particles. N0 is the number of particles, Jc is the nucleation rate, and t is the reaction time.

References

    1. Barabasi AL; Oltvai ZN Network Biology: Understanding the Cell’s Functional Organization. Nat. Rev. Genet 2004, 5, 101–113. - PubMed
    1. Ross PD; Subramanian S Thermodynamics of Protein Association Reactions: Forces Contributing to Stability. Biochemistry 2002, 20, 3096–3102. - PubMed
    1. Luo Q; Hou C; Bai Y; Wang R; Liu J Protein Assembly: Versatile Approaches to Construct Highly Ordered Nanostructures. Chem. Rev 2016, 116, 13571–13632. - PubMed
    1. Yeates TO; Padilla JE Designing Supramolecular Protein Assemblies. Curr. Opin. Struct. Biol 2002, 12, 464–470. - PubMed
    1. Jackel C; Kast P; Hilvert D Protein Design by Directed Evolution. Annu. Rev. Biophys 2008, 37, 153–173. - PubMed

Publication types