

The struggle for existence in the world market ecosystem
- PMID: 30281627
- PMCID: PMC6169900
- DOI: 10.1371/journal.pone.0203915
The struggle for existence in the world market ecosystem
Abstract
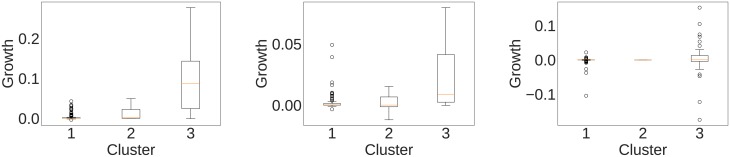
The global trade system can be viewed as a dynamic ecosystem in which exporters struggle for resources: the markets in which they export. We can think that the aim of an exporter is to gain the entirety of a market share (say, car imports from the United States). This is similar to the objective of an organism in its attempt to monopolize a given subset of resources in an ecosystem. In this paper, we adopt a multilayer network approach to describe this struggle. We use longitudinal, multiplex data on trade relations, spanning several decades. We connect two countries with a directed link if the source country's appearance in a market correlates with the target country's disappearing, where a market is defined as a country-product combination in a given decade. Each market is a layer in the network. We show that, by analyzing the countries' network roles in each layer, we are able to classify them as out-competing, transitioning or displaced. This classification is a meaningful one: when testing the future export patterns of these countries, we show that out-competing countries have distinctly stronger growth rates than the other two classes.
Conflict of interest statement
The authors have declared that no competing interests exist.
Figures


Similar articles
-
Maximum Entropy for the International Division of Labor.PLoS One. 2015 Jul 14;10(7):e0129955. doi: 10.1371/journal.pone.0129955. eCollection 2015. PLoS One. 2015. PMID: 26172052 Free PMC article.
-
A Summary of the United States Food and Drug Administrations' Food Safety Program for Imported Seafood; One Country's Approach.Foods. 2016 Apr 29;5(2):31. doi: 10.3390/foods5020031. Foods. 2016. PMID: 28231127 Free PMC article. Review.
-
Risks, prices, and positions: A social network analysis of illegal drug trafficking in the world-economy.Int J Drug Policy. 2014 Mar;25(2):235-43. doi: 10.1016/j.drugpo.2013.12.004. Epub 2013 Dec 17. Int J Drug Policy. 2014. PMID: 24418633
-
The Structure of the World Pharmaceutical Market: Prioritizing Iran's Target Export Markets.Iran J Pharm Res. 2019 Winter;18(1):546-555. Iran J Pharm Res. 2019. PMID: 31089388 Free PMC article.
-
Animal welfare and developing countries: opportunities for trade in high-welfare products from developing countries.Rev Sci Tech. 2005 Aug;24(2):783-90. Rev Sci Tech. 2005. PMID: 16358527 Review.
References
-
- Neffke F, Henning M, Boschma R. How do regions diversify over time? Industry relatedness and the development of new growth paths in regions. Economic Geography. 2011;87(3):237–265. 10.1111/j.1944-8287.2011.01121.x - DOI
-
- Saviotti PP, Frenken K. Export variety and the economic performance of countries. Journal of Evolutionary Economics. 2008;18(2):201–218. 10.1007/s00191-007-0081-5 - DOI
-
- Ženka J, Novotnỳ J, Csank P. Regional competitiveness in Central European countries: in search of a useful conceptual framework. European Planning Studies. 2014;22(1):164–183. 10.1080/09654313.2012.731042 - DOI
-
- Hausmann R, Hidalgo CA, Bustos S, Coscia M, Simoes A, Yildirim MA. The atlas of economic complexity: Mapping paths to prosperity. Mit Press; 2014.
Publication types
LinkOut - more resources
Full Text Sources
