Editorial
. 2019 Feb;286(3):459-478.
doi: 10.1111/febs.14671. Epub 2018 Oct 13.

A mitochondrial ROS pathway controls matrix metalloproteinase 9 levels and invasive properties in RAS-activated cancer cells

Affiliations
Editorial

A mitochondrial ROS pathway controls matrix metalloproteinase 9 levels and invasive properties in RAS-activated cancer cells

Kazunori Mori et al. FEBS J. 2019 Feb.

Abstract

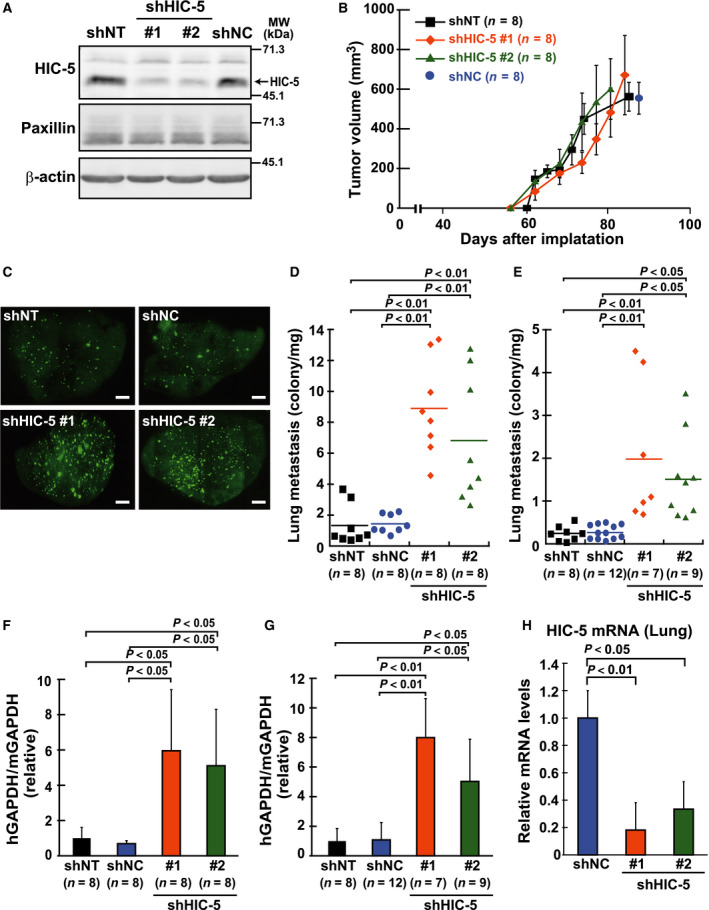
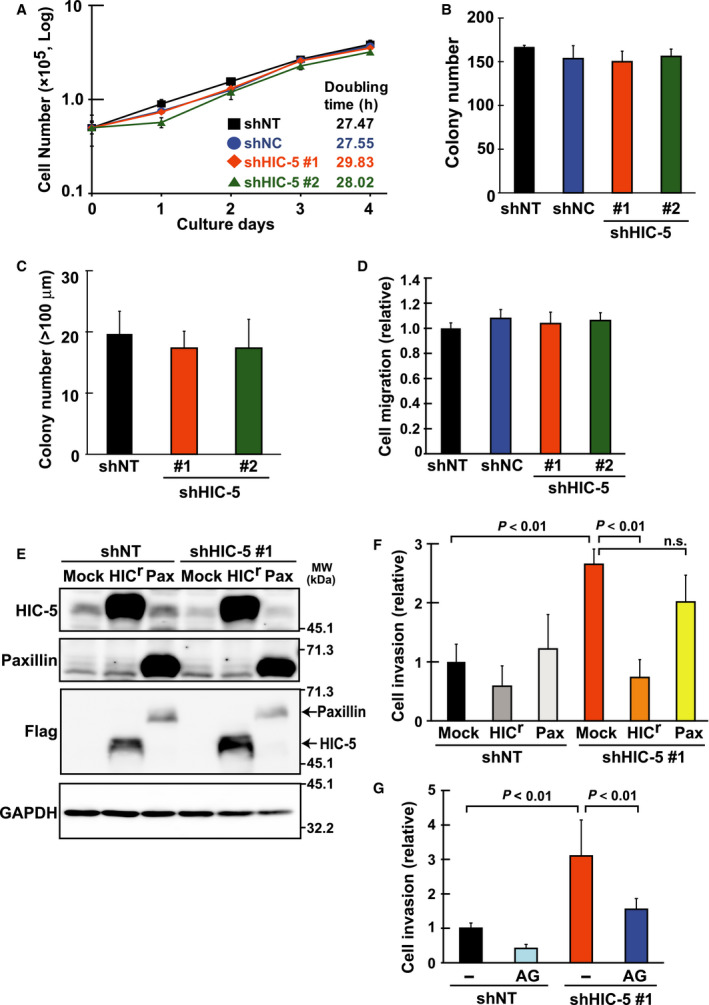
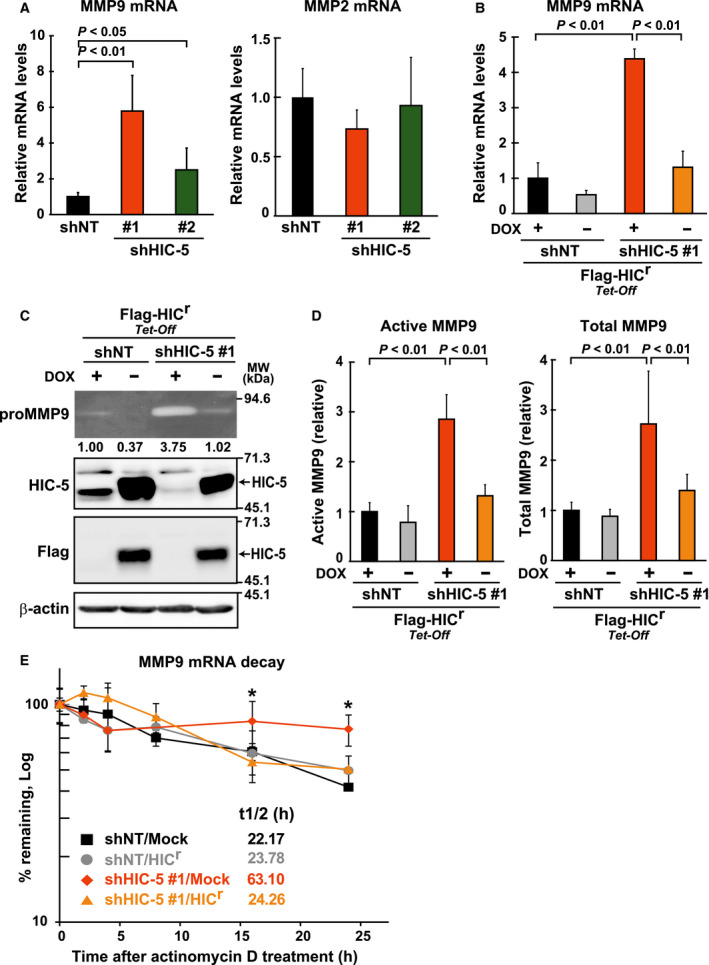
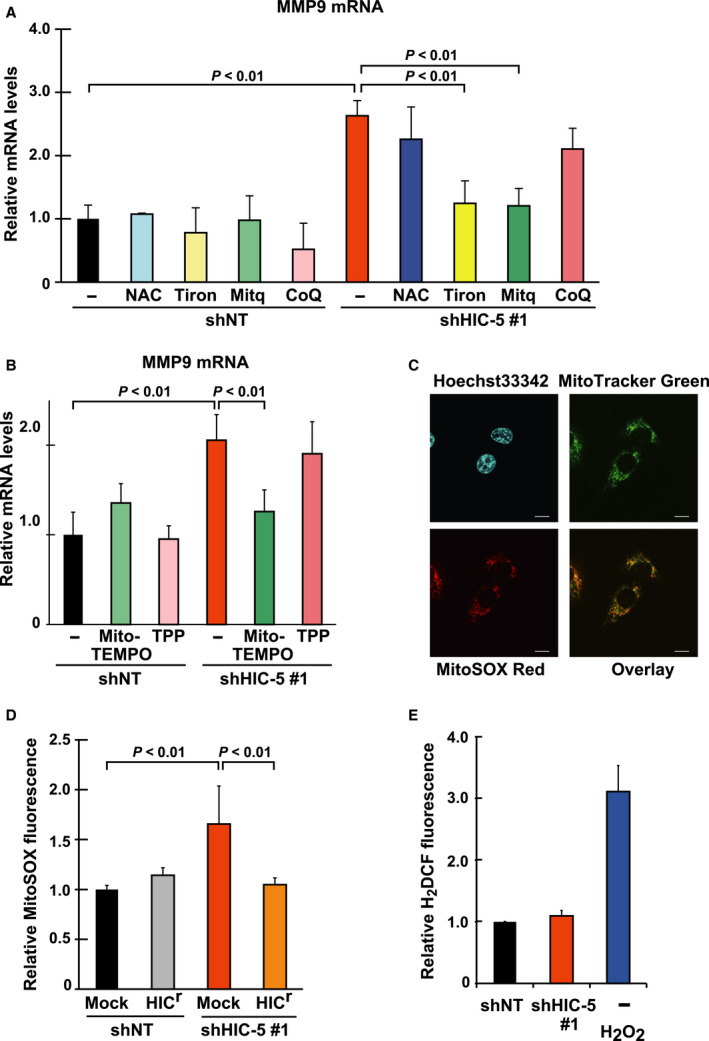
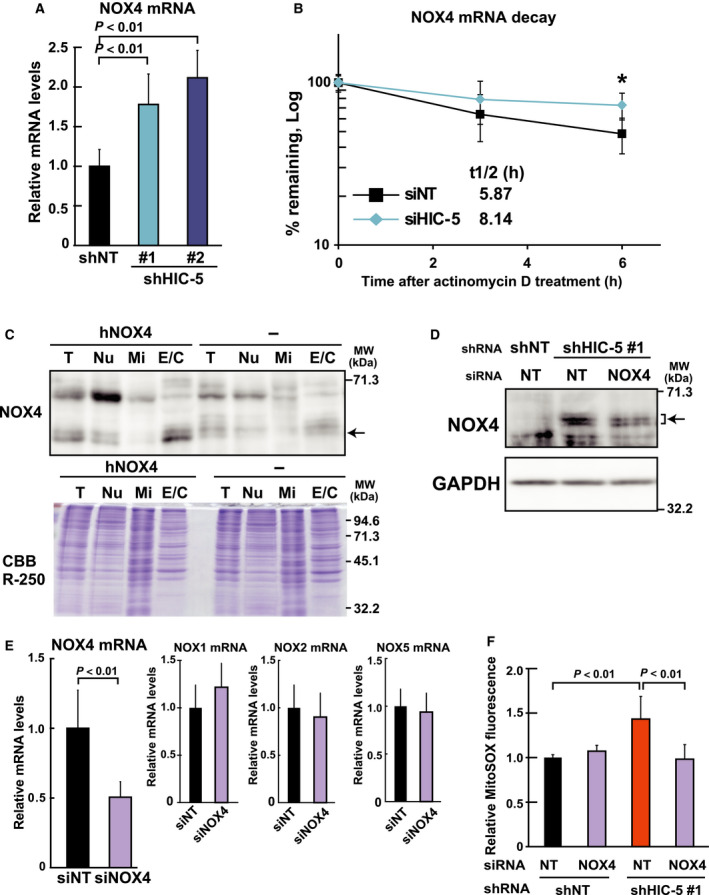
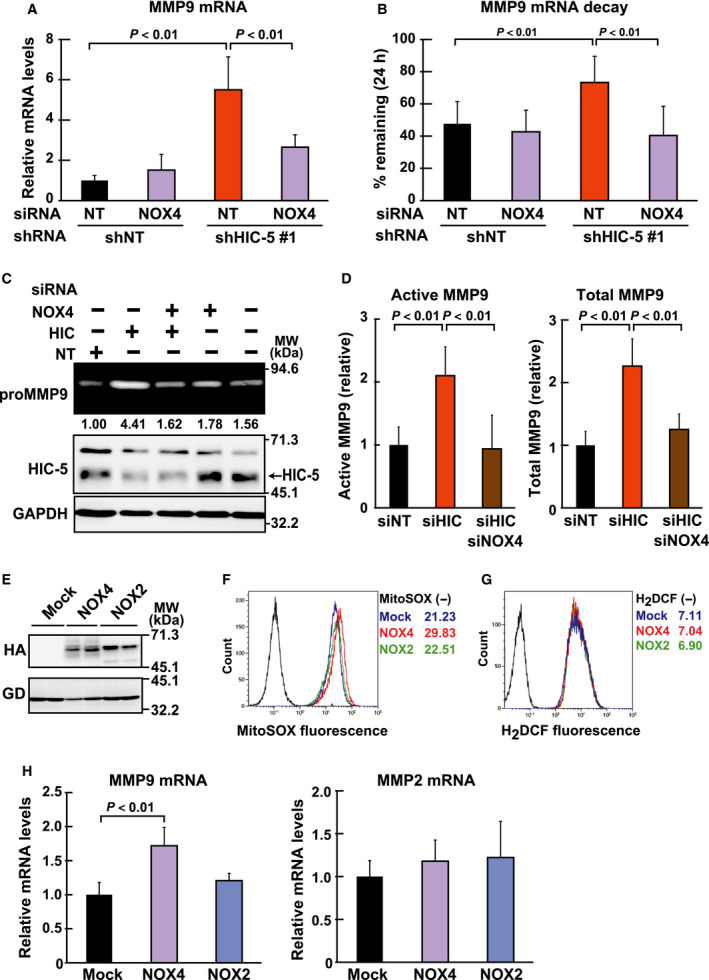
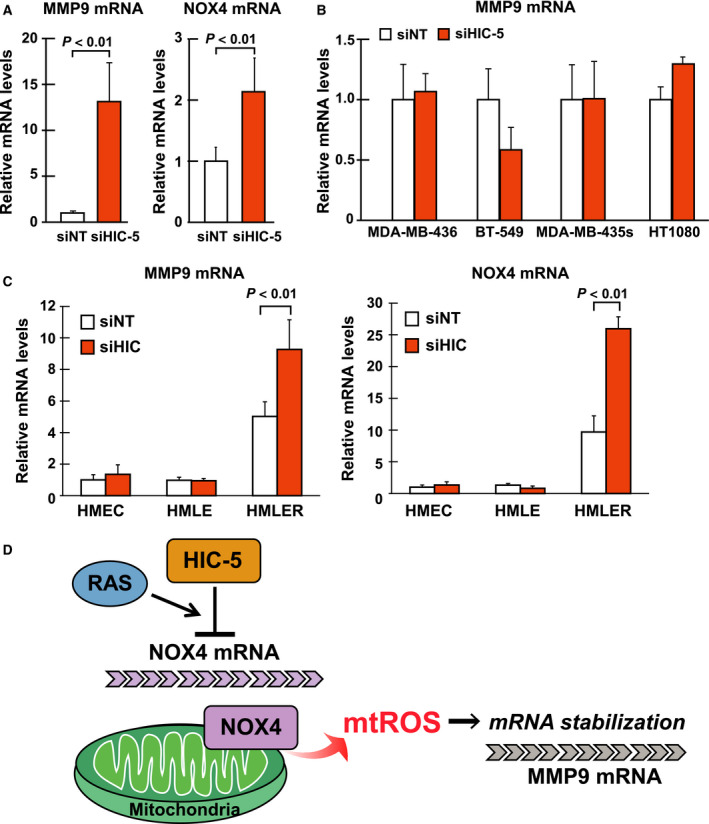
Matrix metalloproteinases (MMPs) are tissue-remodeling enzymes involved in the processing of various biological molecules. MMPs also play important roles in cancer metastasis, contributing to angiogenesis, intravasation of tumor cells, and cell migration and invasion. Accordingly, unraveling the signaling pathways controlling MMP activities could shed additional light on cancer biology. Here, we report a molecular axis, comprising the molecular adaptor hydrogen peroxide-inducible clone-5 (HIC-5), NADPH oxidase 4 (NOX4), and mitochondria-associated reactive oxygen species (mtROS), that regulates MMP9 expression and may be a target to suppress cancer metastasis. We found that this axis primarily downregulates mtROS levels which stabilize MMP9 mRNA. Specifically, HIC-5 suppressed the expression of NOX4, the source of the mtROS, thereby decreasing mtROS levels and, consequently, destabilizing MMP9 mRNA. Interestingly, among six cancer cell lines, only EJ-1 and MDA-MB-231 cells exhibited upregulation of NOX4 and MMP9 expression after shRNA-mediated HIC-5 knockdown. In these two cell lines, activating RAS mutations commonly occur, suggesting that the HIC-5-mediated suppression of NOX4 depends on RAS signaling, a hypothesis that was supported experimentally by the introduction of activated RAS into mammary epithelial cells. Notably, HIC-5 knockdown promoted lung metastasis of MDA-MB-231 cancer cells in mice. The tumor growth of HIC-5-silenced MDA-MB-231 cells at the primary sites was comparable to that of control cells. Consistently, the invasive properties of the cells, but not their proliferation, were enhanced by the HIC-5 knockdown in vitro. We conclude that NOX4-mediated mtROS signaling increases MMP9 mRNA stability and affects cancer invasiveness but not tumor growth.

Keywords: ROS; HIC-5; MMP9; NOX4; metastasis.


Conflict of interest statement

The authors have no conflicts of interest with the contents of this article.

Figures

Figure 1
Figure 1
Hydrogen peroxide‐inducible clone‐5–silencing exacerbates lung metastasis of MDAMB‐231 breast cancer cells. Cells were established from the EGFP‐expressing MDAMB‐231 cells by lentiviral transduction of shRNA constructs (Materials and methods). The shRNAs incorporated in the constructs are two different nontargeting controls (shNT and shNC) and unrelated sequences specific for HIC‐5 (shHIC‐5 #1, #2; see Materials and methods). (A) Western blotting analysis of HIC‐5 and paxillin in cells. Total cell lysates were examined using the indicated antibodies. β‐actin was used as a loading control. (B–H) The shRNA‐expressing cells were inoculated into mammary fat pads of female NOD/SCID mice (B, C, D, F, and H) or injected intravenously in a tail vein of SCID mice (E, G). (B) Tumor volume in the mammary fat pads was monitored. Each data point represents the mean ± SD from eight xenografts. (C) Representative images of lung lobes excised from tumor‐bearing mice under florescence microscope. Images were taken at 20× magnification using a fluorescence microscope (BZ‐8100; Keyence, Osaka, Japan) and assembled into whole‐lobe images automatically using the image‐joint function of BZ‐analyzer (Keyence). GFP‐positive metastatic nodules are observed as dots. Scale bar, 200 μm. (D–G) Quantification of lung metastasis of cells by counting the number of nodules (D, E) and by qPCR (F, G), respectively. When the tumor volume reached approximately 1.0 cm3 in mammary fat pads (~ 80 days) (D) or 4 weeks after injection (E), the number of metastatic nodules visualized (C) was quantified in each lobe of the tumor‐bearing mice (Materials and methods). The total number of nodules from all lobes in a single mouse was plotted as a dot after being normalized against lung weight. The horizontal lines indicate the means from the indicated number of mice. (F, G) Total RNA was extracted from the lobe and human GAPDH mRNA was quantified by qPCR. The values were normalized against those of mouse GAPDH mRNA and shown as relative to the control lobe (shNT) (means ± SD). (H) mRNA levels of human HIC‐5 were examined in the same RNA sample with F by qPCR. The values were normalized with human GAPDH and shown as relative to the control (shNC) (mean ± SD, n = 8).
Figure 2
Figure 2
Hydrogen peroxide‐inducible clone‐5 silencing potentiates invasiveness but not growth properties of MDAMB‐231 breast cancer cells in vitro. The shRNA (shHIC‐5 #1, #2, or the control shNT, shNC)‐expressing cells were obtained from MDAMB‐231 cells by lentiviral transduction of the constructs (Materials and methods), and their growth properties (A–C), migratory (D), and invasive (F) abilities were examined. (A) Growth curve and doubling time of a population: 5 × 10⁴ cells were seeded in a well and the number of viable cells was counted each culture day. Doubling time was calculated from the slope of the graph. (B) Colony formation: cells were plated at a density of 500 cells/35‐mm‐diameter dish and the colony numbers were counted after 7 days. (C) Anchorage‐independent cell growth: cells were seeded at a density of 1 × 10⁴ cells per well in a polyHEMA‐coated six‐well plate with methylcellulose‐containing medium. After incubation for 3 weeks, whole‐well images were captured. The number of colonies (>100 μm) was counted using the imagej software. (D) Migration assay: cells were seeded at a density of 1 × 10⁵ cells per well in an upper chamber of tissue culture‐coated Transwell and after 20 h, those on the lower side of the membrane were stained with crystal violet and photographed under a light microscope. Cell migration was quantified as membrane area occupied by stained cells and shown as a ratio to the control (shNT). (E, F) The shRNA (shNT, shHIC‐5#1)‐expressing cells were infected with the lentiviral constitutive expression vectors (Mock, the empty vector; HIC r, the Flag‐tagged shRNA‐resistant form of HIC‐5; Pax, a Flag‐tagged paxillin; see Materials and methods). After selection with antibiotics, the cells were analyzed by western blotting (E) and assayed for invasion (F). (E) Western blotting analysis of the Flag‐tagged HIC r and paxillin exogenously introduced in the cells with total cell lysates and the indicated antibodies. GAPDH was used as a loading control. (F) The cells were seeded and incubated using Matrigel‐coated Transwell chambers as in D. After removal of noninvading cells remaining on the upper side of the membrane, those on the lower surface were stained, and whole‐membrane images were captured. Cell invasion was evaluated as membrane area occupied by stained cells and shown as a ratio to the control (shNT/Mock). (G) The cells were seeded and incubated as in F in the presence or absence of an MMP inhibitor, AG3340 (2 μm). Cell invasion is shown as a ratio to the control (shNT/−). All values represent the means ± SD from three independent experiments measured in triplicate (n.s., not significant).
Figure 3
Figure 3
Endogenous HIC‐5 negatively regulates MMP9 mRNA expression. (A) MMP9 and MMP2 mRNA levels in the shRNA (shNT, shHIC‐5#1 and #2)‐expressing cells were quantified by qPCR. The values were normalized to the corresponding GAPDH in the same sample and are shown relative to the control (shNT) (means ± SD of triplicate samples from at least three independent experiments). (B–D) The cells expressing shHIC‐5 #1 or shNT were infected with the tetracycline‐regulated (Tet‐Off) lentiviral vector encoding the Flag‐tagged HIC r and selected with antibiotics (Materials and methods). The resistant cells were cultured for 24 h in the presence (DOX+) or absence (DOX−) of doxycycline (2 ng·mL−1). (B) MMP9 mRNA levels were examined by qPCR as in A. The values are relative to the control (shNT/DOX+) and plotted as in A (means ± SD of triplicate samples from at least three independent experiments). (C) The cells as in B were further cultured in serum‐free medium for another 24 h, and then conditioned medium and total cell lysate were subjected to gelatin zymography (the uppermost panel) and western blotting (lower panels), respectively. The gelatinolytic areas on zymography were quantified using the imagej software and normalized against the band intensity of β‐actin in the western blot of the corresponding sample. The ratio to the control (shNT/DOX+) is shown under the panel. (D) Activity of MMP9 in the conditioned medium obtained in C was quantified by QuickZyme Human MMP‐9 activity assay. The amount of active and total MMP9 is shown as the ratio to the control (shNT/DOX+) (means ± SD from two independent experiments measured in triplicate). (E) The shRNA (shNT, shHIC‐5#1)‐expressing cells introduced with the HIC r‐ and Mock‐expressed vectors (constitutive) as in Fig. 2E were treated with actinomycin D (1 μg·mL−1) for the indicated time, and at each time point, the amount of MMP9 mRNA was determined by qPCR. After normalization to the amount of 18S rRNA, the percentages of remaining MMP9 mRNA were graphed (the value at 0 h defined as 100%) (means ± SD of triplicate samples from at least three independent experiments, *P < 0.01; vs. shNT/Mock). The half‐life (t 1/2) of mRNA was calculated from the slope between the points of the graph and averaged.
Figure 4
Figure 4
The upregulation of MMP9 mRNA is mediated by mtROS increased in HIC‐5–silencing cells. (A, B) The shRNA (shNT, shHIC‐5#1)‐expressing cells were treated with the following chemicals: A, NAC (2 mm), Tiron (1 mm), Mitq (0.5 μm), Mito‐TEMPO (10 μm), and CoQ (0.5 μm); and B, Mito‐TEMPO (10 μm) and TPP (10 μm). After 24 h, MMP9 mRNA levels were quantified by qPCR. A ratio to the control (shNT/−) is shown (means ± SD of triplicate samples from at least three independent experiments). (C) MDAMB‐231 cells were washed and incubated with 5 μm MitoSOX Red, 20 nm Mito Tracker Green FM, and 10 μm Hoechst 33342 for 10 min. After washing, laser scanning confocal microscopy was performed. Scale, 10 μm. (D, E) The shRNA (shNT, shHIC‐5#1)‐expressing cells introduced with HIC r and Mock as in Fig. 2E were analyzed for intracellular ROS levels with MitoSOX Red (D) and H2 DCFDA (E) by flow cytometry. The fluorescence intensities were normalized against that of calcein blue in individual cells. The values were obtained from at least 10 000 cells and the means ± SD are graphed as a ratio to the control [shNT/Mock (D) or shNT (E)]. Treatment with H2O2 (1 mm, 30 min) was used as positive control (E). Data are representative of two independent experiments with measurements in triplicate for each experiment.
Figure 5
Figure 5
The increase in mtROS is mediated by the upregulation of NOX4 in HIC‐5–silenced cells. (A) Total RNA from the shRNA (shNT, shHIC‐5#1 and #2)‐expressing cells was analyzed for NOX4 mRNA levels by qPCR. A ratio to the control (shNT) is shown. (B) HMLER cells, which expressed NOX4 at high levels (see Fig. 7C), were transfected with siRNA for control (siNT) or HIC‐5 and 48 h later, treated with actinomycin D (1 μg·mL−1). The levels of NOX4 mRNA were determined by qPCR, and the remaining percentages at each time point were plotted (value at 0 h defined as 100%) as in Fig. 3E. *P < 0.01. (C) HEK293 cells with or without human NOX4 overexpression were subjected to fractionation and analyzed using western blotting as described in Materials and methods. T; total cell lysates, Nu; nuclei and unbroken cell containing, Mi; mitochondria rich, and E/C; microsomal and cytoplasmic fractions. The fractions containing equal amounts of protein were analyzed using western blotting with the antibody to NOX4. Proteins loaded and remaining in the gel were stained with Coomassie Brilliant Blue R‐250 (CBB R‐250). (D) The shRNA (shNT, shHIC‐5#1)‐expressing MDAMB‐231 cells were transfected with siRNA for control (NT) or NOX4. After 72 h, cells were disrupted and fractionated as in C. The E/C fractions were analyzed using western blotting. GAPDH was used as a loading control. (E) MDAMB‐231 cells were transfected with siRNA for control (NT) or NOX4, and 48 h later, NOX4, NOX1, NOX2, and NOX5 mRNA levels were determined by qPCR. Ratios relative to the controls (siNT) are shown. (F) The shRNA (shNT, shHIC‐5#1)‐expressing cells were transfected with siRNA for control (NT) or NOX4. After 48 h, ROS levels were determined with MitoSOX Red by flow cytometry as in Fig. 4D. The fluorescence intensities normalized against that of calcein blue in individual cells were obtained from at least 10 000 cells, and means ± SD are presented as a ratio to the control (shNT/NT). All data are representative of three independent experiments with measurements in triplicate for each experiment.
Figure 6
Figure 6
The upregulated NOX4 plays a role in the increase of MMP9 mRNA in HIC‐5–silenced cells. (A, B) The shRNA (shNT, shHIC‐5#1)‐expressing cells were transfected with the siRNAs (NT; control, NOX4), and incubated for 48 h. (A) The cells were analyzed for MMP9 mRNA levels by qPCR. A ratio to the control (shNT/NT) is shown (means ± SD of triplicate samples from at least three independent experiments). (B) The cells were further incubated with actinomycin D (1 μg·mL−1) for 24 h, and the amount of MMP9 mRNA was determined at 0 h and 24 h by qPCR. After normalization against the amount of 18S rRNA, ratios to the values at 0 h (remaining percentages at 24 h) were graphed (means ± SD of triplicate samples from at least three independent experiments). (C, D) The siRNAs (NT; control, HIC; HIC‐5, NOX4) were transfected into MDAMB‐231 cells in the combinations indicated. At 48 h post‐transfection, cells were transferred to serum‐free medium and cultured for another 24 h. In C, the conditioned medium and total cell lysates were prepared and analyzed by gelatin zymography (the uppermost panel) and western blotting (lower panels), respectively. Gelatinolytic areas were quantified using the imagej software and normalized against the band intensity of GAPDH in the western blot of the corresponding sample. A ratio to the control (NOX4−/HIC−/NT) is shown under the panel. In D, activity of MMP9 in the conditioned medium obtained in C was quantified by QuickZyme Human MMP‐9 activity assay. The amount of active and total MMP9 is shown as the ratio to the control (siNT). (E) The retroviral expression vectors for NOX4 and NOX2 (Materials and methods) were transfected into 293T cells, and protein expression was examined 48 h later by western blotting in duplicate with the antibodies as indicated. GAPDH (GD) was used as a loading control. (F‐H) MDAMB‐231 cells infected with the retroviral expression vectors for NOX4 and NOX2, or the empty vector (Mock) as in E were analyzed for ROS (F, G) and mRNA (H) levels. ROS levels were assessed with MitoSOX Red (F) and H2 DCFDA (G) by flow cytometry as in Fig. 4D and E. Representative histograms with the mean fluorescence intensities are shown. Data are representative of two independent experiments with measurements in triplicate for each experiment. MMP9 and MMP2 mRNA levels were quantified by qPCR (H). A ratio to the control (Mock) is shown (means ± SD of triplicate samples from at least three independent experiments). All data are representative of two independent experiments with measurements in triplicate for each experiment, unless otherwise noted.
Figure 7
Figure 7
Hydrogen peroxide‐inducible clone‐5 function as a suppressor of NOX4 expression is dependent on oncogenic RAS signaling. (A) EJ‐1 cells were transfected with siRNA for control (siNT) or HIC‐5 (siHIC). After 48 h, total RNA from cells was analyzed for mRNA levels of MMP9 and NOX4 by qPCR. A ratio to the control (siNT) is shown. (B) The cell lines listed in Table 1 were transfected with siRNA and analyzed for mRNA levels of MMP9 as in A. (C) The siRNAs were transfected into the HMEC, HMLE, and HMLER cells (Materials and methods), and MMP9 and NOX4 mRNA levels were examined as in A. (D) HIC‐5‐NOX4‐mtROS axis: a new mode of regulation of MMP9 expression. The axis is engaged in the regulation of MMP9 mRNA stability. HIC‐5 suppresses NOX4 expression, which lowers MMP9 mRNA‐stabilizing mtROS levels. All values are means ± SD of triplicate samples from at least three independent experiments.

References

    1. Rodriguez D, Morrison CJ & Overall CM (2010) Matrix metalloproteinases: what do they not do? New substrates and biological roles identified by murine models and proteomics Biochem Biophys Acta 1803, 39–54. - PubMed
    1. Deryugina EI & Quigley JP (2006) Matrix metalloproteinases and tumor metastasis. Cancer Metastasis Rev 25, 9–34. - PubMed
    1. Egeblad M & Werb Z (2002) New functions for the matrix metalloproteinases in cancer progression. Nat Rev Cancer 2, 161–174. - PubMed
    1. Bjorklund M & Koivunen E (2005) Gelatinase‐mediated migration and invasion of cancer cells. Biochem Biophys Acta 1755, 37–69. - PubMed
    1. Daniele A, Abbate I, Oakley C, Casamassima P, Savino E, Casamassima A, Sciortino G, Fazio V, Gadaleta‐Caldarola G, Catino A et al (2016) Clinical and prognostic role of matrix metalloproteinase‐2, ‐9 and their inhibitors in breast cancer and liver diseases: a review. Int J Biochem Cell Biol 77, 91–101. - PubMed

Publication types

MeSH terms