. 2018 Nov 21;29(11):3768-3775.
doi: 10.1021/acs.bioconjchem.8b00639. Epub 2018 Oct 16.

A Mechanistic Investigation of Methylene Blue and Heparin Interactions and Their Photoacoustic Enhancement

Affiliations

A Mechanistic Investigation of Methylene Blue and Heparin Interactions and Their Photoacoustic Enhancement

Junxin Wang et al. Bioconjug Chem. .

Abstract

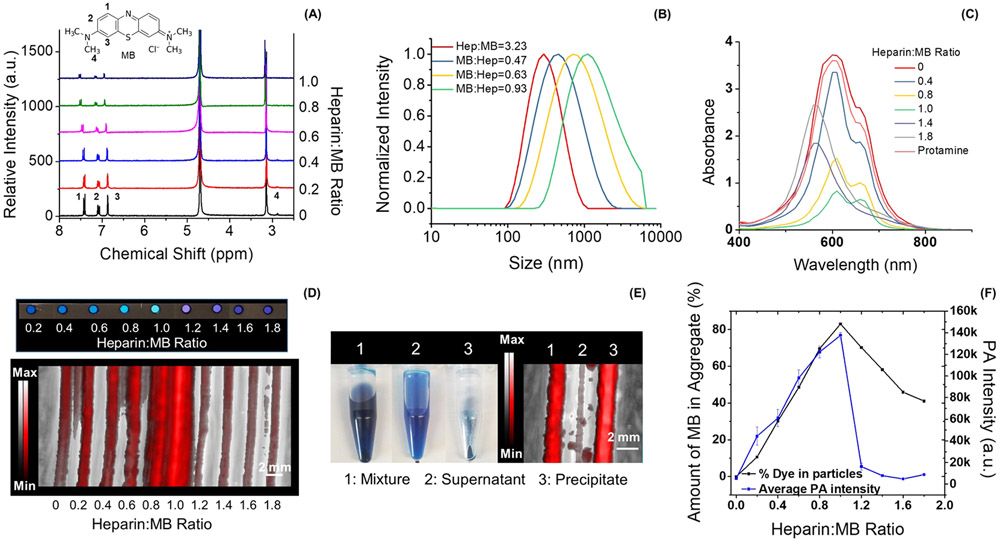
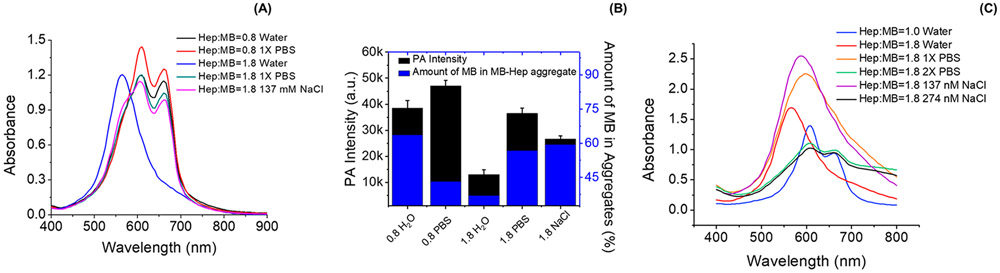
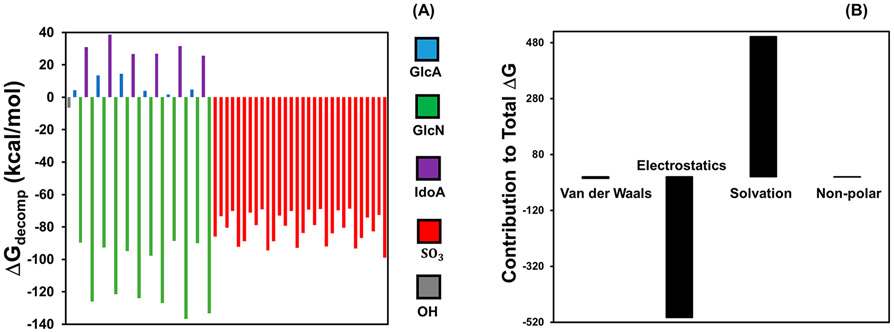
We recently reported a real-time method to measure heparin in human whole blood based on the photoacoustic change of methylene blue (MB). Intriguingly, the MB behaved unlike other "turn on" photoacoustic probes-the absorbance decreased as the photoacoustic signal increased. The underlying mechanism was not clear and motivated this study. We studied the binding mechanism of MB and heparin in water and phosphate buffer saline (PBS) with both experimental and computational methods. We found that the photoacoustic enhancement of the MB-heparin mixture was a result of MB-heparin aggregation due to charge neutralization and resulting sequestration of MB in these aggregates. The sequestration of MB in the MB-heparin aggregates led to decreased absorbance-there was simply less free dye in solution to absorb light. The highest photoacoustic signal and aggregation occurred when the number of negatively charged sulfate groups on heparin was approximately equal to the number of positively charged MB molecule. The MB-heparin aggregates dissociated when there were more sulfated groups from heparin than MB molecules because of the electrostatic repulsion between negatively charged sulfate groups. PBS facilitated MB dimer formation regardless of heparin concentration and reprecipitated free MB in aggregates due to ionic strength and ionic shielding. Further molecular dynamics experiments found that binding of heparin occurred at the sulfates and glucosamines in heparin. Phosphate ions could interact with the heparin via sodium ions to impair the MB-heparin binding. Finally, our model found 3.7-fold more MB dimerization upon addition of heparin in MB solution confirming that heparin facilitates MB aggregation. We conclude that the addition of heparin in MB decreases the absorbance of the sample because of MB-heparin aggregation leading to fewer MB molecules in solution; however, the aggregation also increases the PA intensity because the MB molecules in the MB-heparin aggregate have reduced degrees of freedom and poor heat transfer to solvent.


Figures

Figure 1.
Figure 1.
MB aggregation upon addition of heparin. Panel A plots the NMR spectra of MB at the heparin:MB ratios of 0 to 1.0. Peaks 1, 2, 3, and 4 in the spectrum correspond to the protons shown on the structure of MB (inset). The NMR intensity of both proton 1 and proton 4 (Figure S3) decreased the most (i.e., 76%) when the heparin:MB ratio approaches 1.0, suggesting the precipitation of MB–heparin aggregates. Panel B shows the DLS result of MB–heparin aggregates as a function of MB concentration. The size of the aggregates increased from 335 to 1632 nm when the MB:heparin ratio increased from 0.31 to 0.93. The absorbance spectra of the samples in panel A are shown in panel C. The absorbance intensity at 610 nm decreased 4.5-fold when heparin:MB ratio equals 1.0. A higher heparin:MB ratio from 1.2–1.8 blue-shifts the absorbance peak to 570 nm suggesting the formation of MB self-aggregates (i.e., H-type aggregates). A control experiment using 0.95 mg/mL protamine (i.e., antagonist of heparin) reverses the spectral change. Panel D shows the color and PA image of the samples of panel C. In the sample with heparin:MB at 1.0, the MB–heparin aggregates were collected by centrifugation—these aggregates cause most of the PA signal in the mixture (panel E). Panel F quantifies the PA intensity of the samples in panel D and the amount of MB in the MB–heparin aggregates. The similar trend indicates that the MB–heparin aggregation increases PA intensity. The error bars in panel F represent the standard deviation of 8 regions-of-interest in the sample.
Figure 2.
Figure 2.
Impact of PBS in the MB–heparin binding. Panel A compares the spectral change of MB–heparin complex in water and PBS. The MB–heparin sample with heparin:MB at 0.8 in PBS (red) had 24% and 9% higher absorbance at 610 and 660 nm than the sample prepared in water (black). The addition of 1xPBS to a mixture with heparin:MB of 1.8 in water (blue) shifted the absorbance from 570 nm to 610 nm (green). A similar effect was observed upon the addition of 137 mM NaCl (purple) Panel B shows the PA intensity (black) and the amount of MB in the MB–heparin aggregates (blue) of the samples in Panel A. At heparin:MB of 0.8, PBS (0.8 PBS) increased the PA signal of the sample in water (0.8 H2O) by 22%. At heparin:MB of 1.8, adding PBS (1.8 PBS) and 137 mM NaCl (1.8 NaCl) in the sample prepared in water (1.8 H2O) resulted in 2.8- and 2.0-fold increase in PA intensity as well as 1.5- and 1.6-fold in the amount of MB in MB–heparin aggregate. Panel C is the absorbance of 2.4 mM MB with heparin:MB ratio at 1.0 (blue) and 1.8 (red). Adding 1 × PBS (orange) or 137 mM NaCl (purple) only red-shifted the absorbance to 590 and 600 nm. Doubling the PBS (green) or NaCl concentration (black) in the sample could shift the absorbance to 610 nm, like the absorbance of sample with Heparin:MB ratio at 1.0. This indicates that the ionic strength governs the disassociation of MB self-aggregates to MB dimer.
Figure 3.
Figure 3.
Simulated binding kinetics of MB and heparin. Panel A shows one of the 6 repeating units of heparin simulated in solvent NaCl and PBS systems. Panel B shows that the MB system with heparin had on average 5.67 ± 2.06 dimer formations per 10 ns, which is significantly more MB dimer formation than the system without heparin (1.53 ± 1.10 dimer formations per 10 ns (p < 0.03)). Panel C shows the ππ stacked MB dimer bound on the sulfate and glucosamine. The fraction of MB dimers formed by ππ stacking (distance between two MB molecules was less than 4.0 Å) among the total number of MB dimers (distance between two MB molecules was less than 9.5 Å) is shown in panel D. In the pure MB system, the ππ stacked MB dimer is 17.6% of the total dimers. The percentage increased to 31.3% upon addition of heparin. Error bars in B represent three replicate simulations runs.
Figure 4.
Figure 4.
Decomposition analysis of the binding energy. The energy decomposition results of heparin residues in the system of 7 MB molecules with 1 heparin are plotted in panel A. Here, positive values indicate a destabilizing effect, and negative values represent stabilizing residues with respect to a binding event. The glucosamine and sulfate residues were the largest contributors to the spontaneity of the MB binding event. The GlcA, GlcN, IdoA, SO3, and OH represent glucuronic acid, glucosamine, iduronic acid, sulfate, and the hydroxide terminals that are not associated with other residues, respectively. The X-axis represents different residues on the heparin. These monosaccharides are presented in the order that they appear in the polysaccharide; the sulfates are presented as a group although they are scattered throughout the structure. Panel B further details the energetic contributions of van der Waals forces, electrostatic interactions, the solvation free energy upon binding of the ligand to the receptor, and the nonpolar contribution of the surface, respectively. Electrostatic interactions were the greatest stabilizing force to the energetics of binding, while solvation effects were found to be the most destabilizing force.

References

    1. Acosta-Avalos D, Jedlicka LDL, Costa MS, Barja PR, and da Silva EC (2012) Photoacoustic spectroscopy of Candida albicans treated with methylene blue. Int. J. Thermophys 33, 1864–1869.
    1. Erpelding TN, Kim C, Pramanik M, Jankovic L, Maslov K, Guo Z, Margenthaler JA, Pashley MD, and Wang LV (2010) Sentinel lymph nodes in the rat: noninvasive photoacoustic and US imaging with a clinical US system. Radiology 256, 102–110. - PMC - PubMed
    1. Tang W, Xu H, Kopelman R, and Philbert MA (2005) Photodynamic characterization and in vitro application of methylene blue-containing nanoparticle platforms. Photochem. Photobiol 81, 242–249. - PubMed
    1. He X, Wu X, Wang K, Shi B, and Hai L (2009) Methylene blue-encapsulated phosphonate-terminated silica nanoparticles for simultaneous in vivo imaging and photodynamic therapy. Biomaterials 30, 5601–5609. - PubMed
    1. Tardivo JP, Del Giglio A, de Oliveira CS, Gabrielli DS, Junqueira HC, Tada DB, Severino D, de Fátima Turchiello R, and Baptista MS (2005) Methylene blue in photodynamic therapy: From basic mechanisms to clinical applications. Photodiagn. Photodyn. Ther 2, 175–191. - PubMed

Publication types