. 2018 Nov 21:393:42-60.
doi: 10.1016/j.neuroscience.2018.09.034. Epub 2018 Sep 30.

Effects of Chronic Spinal Cord Injury on Relationships among Ion Channel and Receptor mRNAs in Mouse Lumbar Spinal Cord

Affiliations

Effects of Chronic Spinal Cord Injury on Relationships among Ion Channel and Receptor mRNAs in Mouse Lumbar Spinal Cord

Virginia B Garcia et al. Neuroscience. .

Abstract

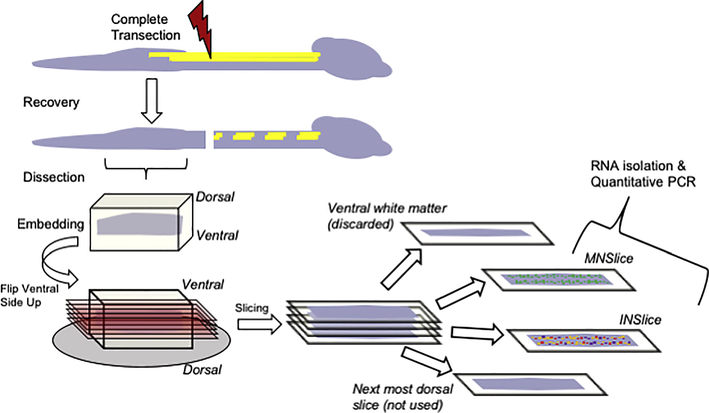
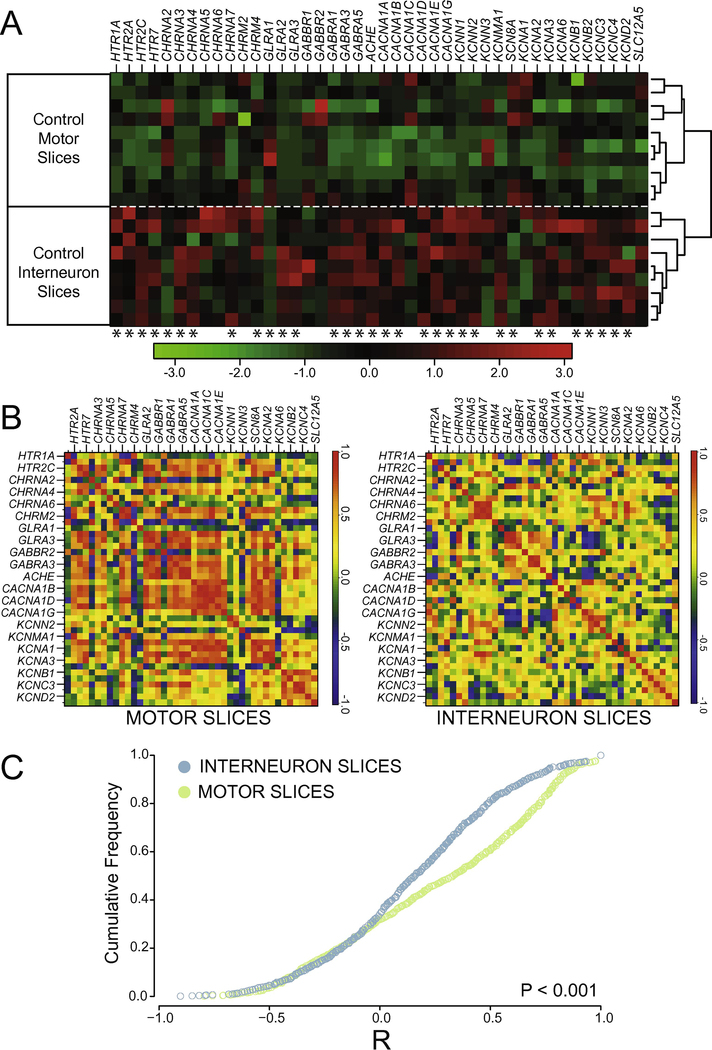
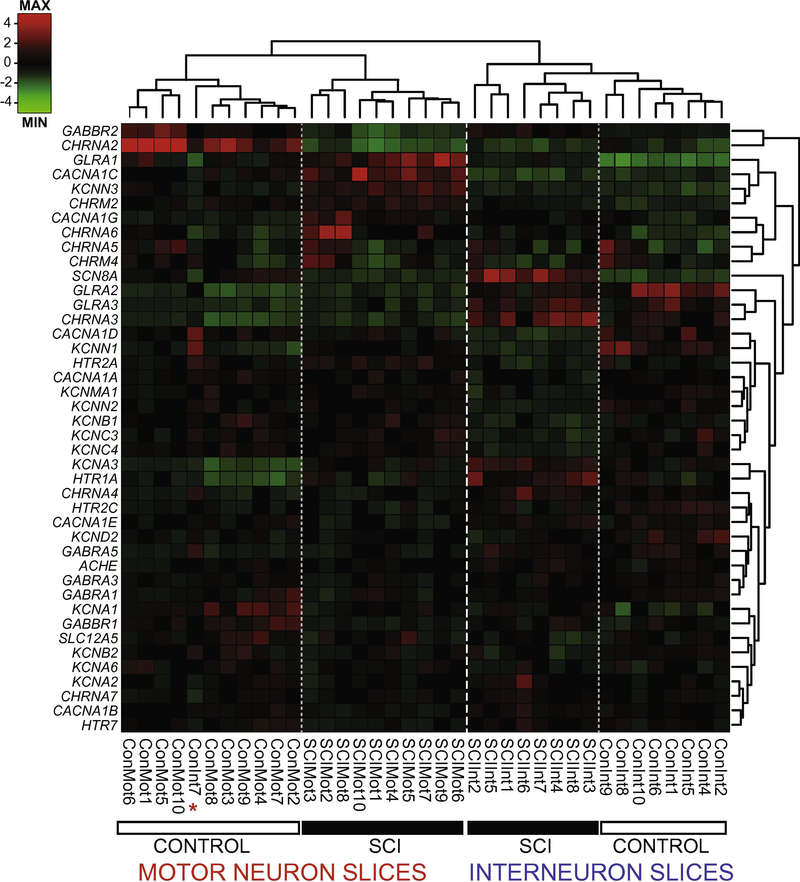
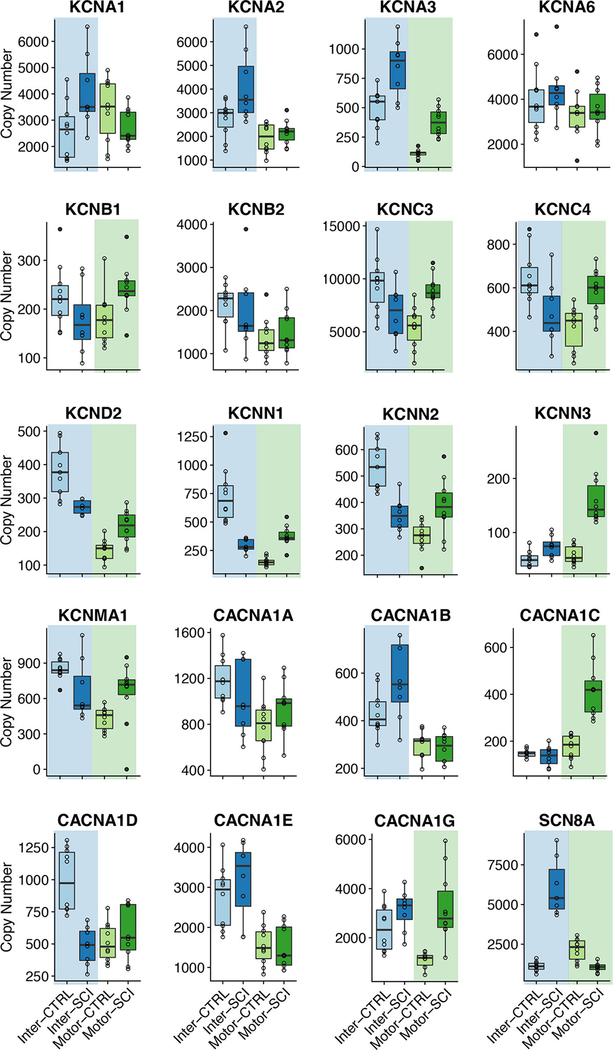
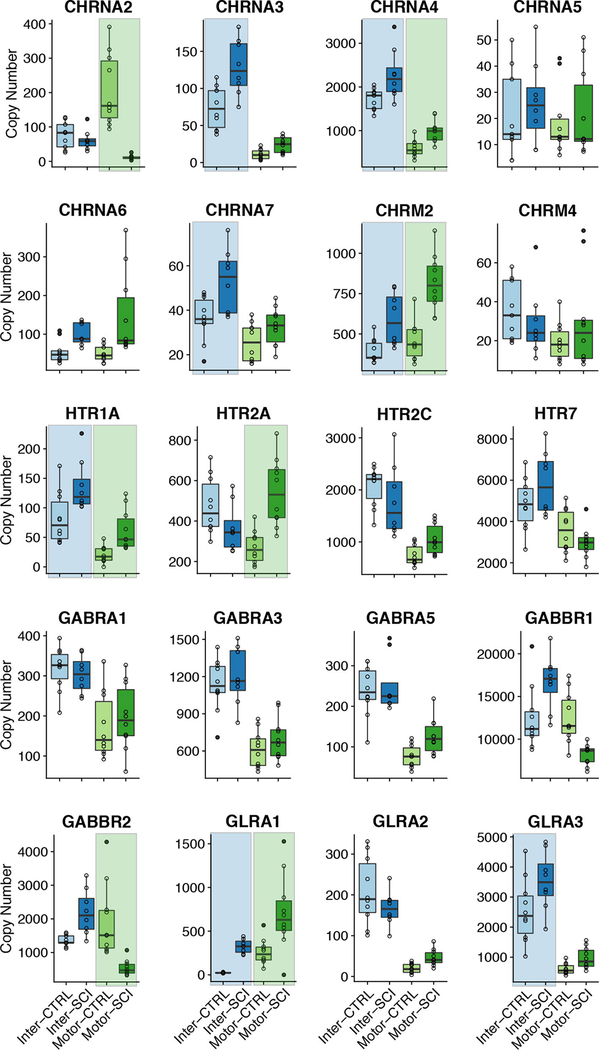
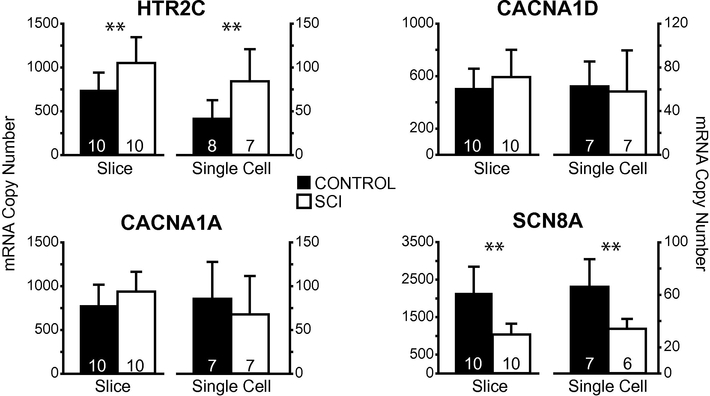
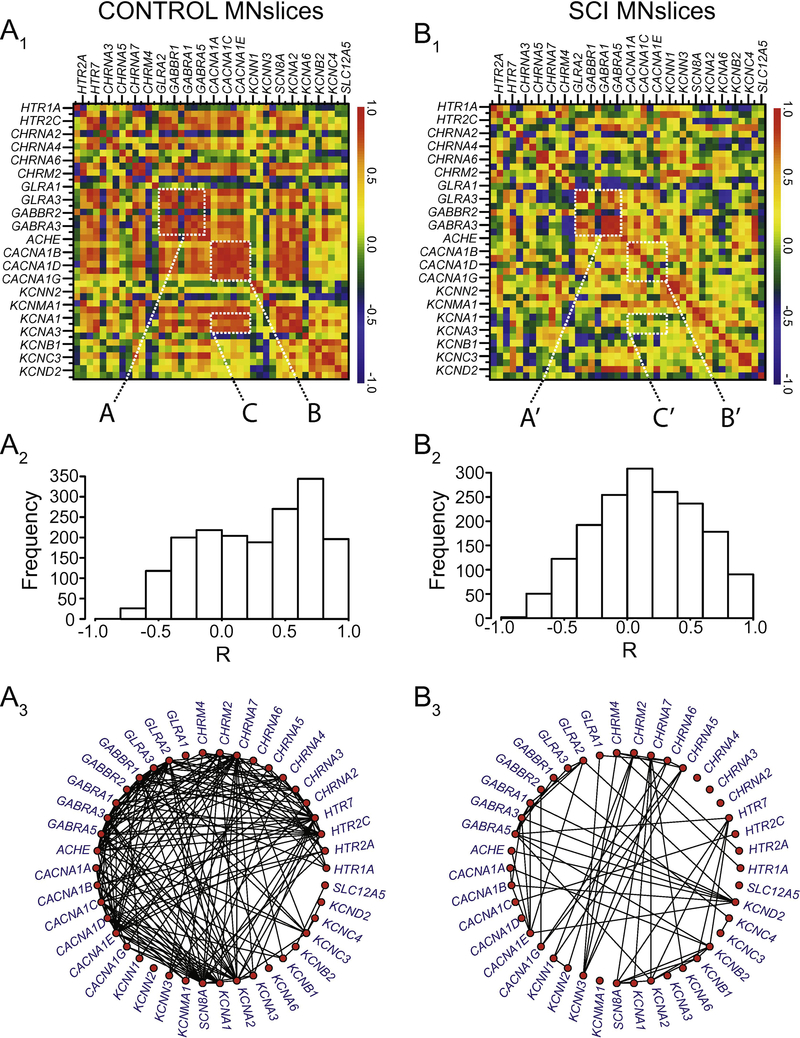
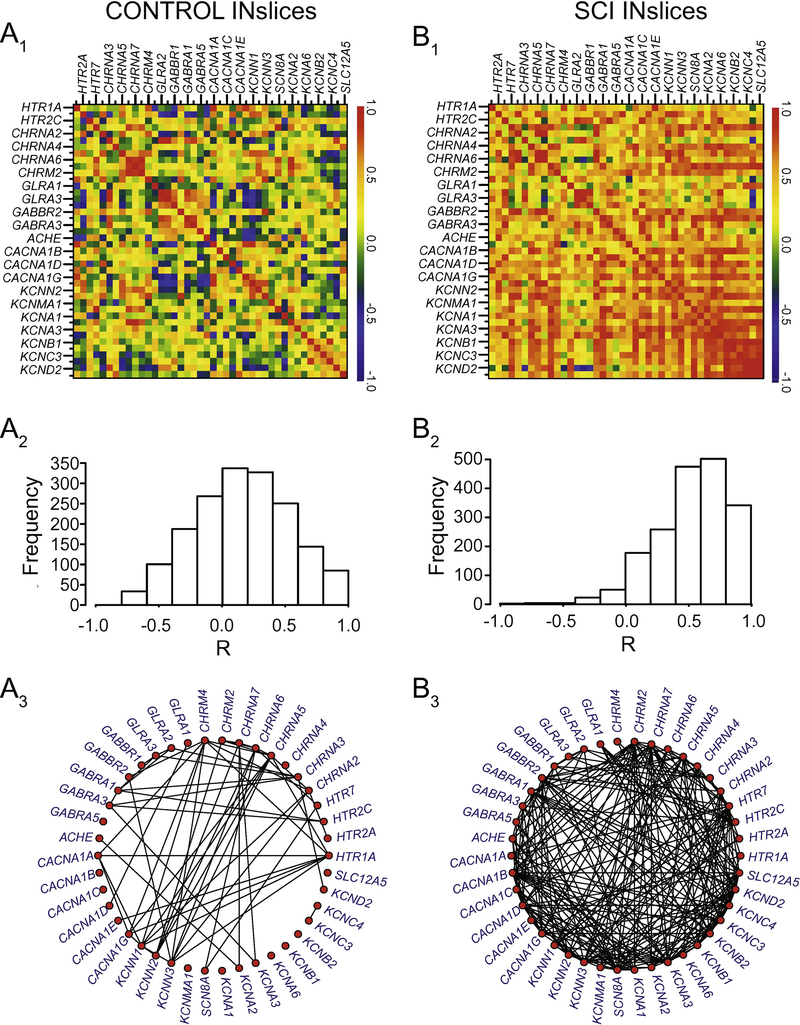
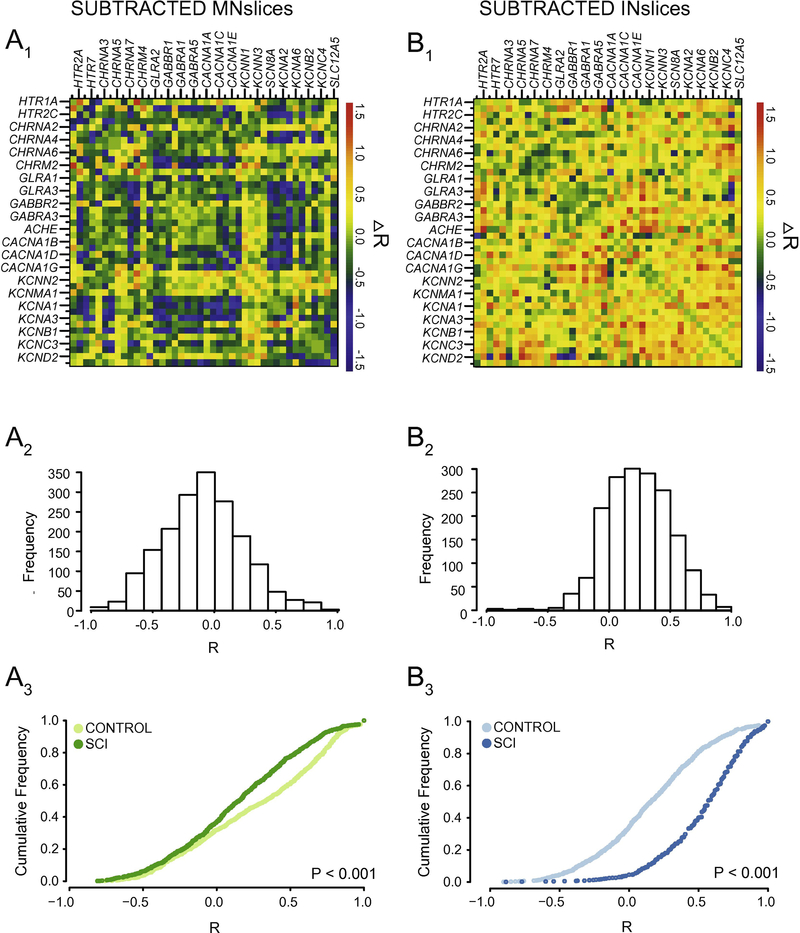
Spinal cord injury (SCI) causes widespread changes in gene expression of the spinal cord, even in the undamaged spinal cord below the level of the lesion. Less is known about changes in the correlated expression of genes after SCI. We investigated gene co-expression networks among voltage-gated ion channel and neurotransmitter receptor mRNA levels using quantitative RT-PCR in longitudinal slices of the mouse lumbar spinal cord in control and chronic SCI animals. These longitudinal slices were made from the ventral surface of the cord, thus forming slices relatively enriched in motor neurons or interneurons. We performed absolute quantitation of mRNA copy number for 50 ion channel or receptor transcripts from each sample, and used multiple correlation analyses to detect patterns in correlated mRNA levels across all pairs of genes. The majority of channels and receptors changed in expression as a result of chronic SCI, but did so differently across slice levels. Furthermore, motor neuron-enriched slices experienced an overall loss of correlated channel and receptor expression, while interneuron slices showed a dramatic increase in the number of positively correlated transcripts. These correlation profiles suggest that spinal cord injury induces distinct changes across cell types in the organization of gene co-expression networks for ion channels and transmitter receptors.

Keywords: correlation analysis; gene co-expression network; ion channels; receptors.


Figures

Figure 1.
Figure 1.
Schematic illustration representing the spinal cord slice procedure used to collect tissues for analysis. Following complete transection at cord level T8-T9, animals were allowed to recover from injury for a period of at least 28 days. Animals were sacrificed, the cord below the injury removed, and embedded for slicing. Longitudinal slices were made from the ventral surface of the cord and progressed in 300 μm increments. Slices of gray matter that contained concentrations of ChAT:GFP labeling were collected as motor neuron enriched slices (MNSlice). After removal of GFP containing neurons, the next most 300 μm dorsal slice was collected as interneuron enriched (INSlice). These slices were immediately placed in TriZol reagent and homogenized for total RNA extraction.
Figure 2.
Figure 2.
Channels and receptors are differentially expressed in interneuron- and motor neuron-enriched slices. A) Heat-map showing relative transcript levels of receptor and channel subtypes across different slice types of control (uninjured) animals. Data are expressed as a column Z-score where relative distance of a given expression value from the group mean is represented by color intensity. Each row is a different slice sample, which are clearly grouped into two distinct nodes by slice class as a result of post-hoc clustering. Genes were arbitrarily grouped based on functional subtypes of receptor and channel class. Asterisks under each column represent significantly different transcript levels between interneuron and motor neuron slices for a given gene (after Two-Way ANOVA, see Methods). B) Co-expression correlations among measured transcripts also differ between slice types. For each slice level from control animals, a correlogram was generated that displays the mean R-values for Pearson correlation tests as heat-mapped pixels for each pairwise comparison. Each XY coordinate represents one R-value for a given pairwise comparison. Along the diagonal is the autocorrelation for each gene, resulting in an R-value of 1.0 (red). Labels for every-other gene in the analysis are provided on the x- and y-axes for clarity, but both axes contain all genes used in the study in the same order. C) Cumulative distribution functions from the data shown in panel B reveals a significantly different distribution of R values, with higher co-expression in control MNslices (N = 10) than INslices (N = 9) between interneuron- and motor neuron enriched slices (D = 0.209, P < 0.001; Two-sample K-S test).
Figure 3.
Figure 3.
Ion channel and receptor transcript profiles correspond to slice level and injury state in lumbar spinal cord. Dendrograms and heat map of individual slice samples (columns) from control and SCI motor- and interneuron-containing slices for channel and receptor transcript levels (rows). Hierarchical clustering of sorted slice expression profiles distinctly associated samples from each of the four groups, with one exception (red asterisk). Con = control, SCI = injured, Mot = motor neuron-enriched slices, Int = interneuron-enriched slices. Relative expression is indicated by Z-score based on the average transcript levels for each gene (rows), and not each sample (columns).
Figure 4.
Figure 4.
Boxplots for mRNA copy numbers for each ion channel gene of interest across all four experimental groups. INSlices are represented in shades of blue, while MNSlices are represented in shades of green. For a given boxplot, the median is denoted by a horizontal line, and the box extends to the 25th and 75th percentiles. Individual observations are presented as open circles, and whiskers extend to the most extreme values that are within the interquartile range. Outliers are defined as points outside 1.5 times the interquartile range above the upper quartile and below the lower quartile, and designated by filled circles. Significant differences (p < 0.05; post-hoc t-test following Two-Way ANOVA) between control and injured samples for a given slice level are denoted with a shaded background of the appropriate color (blue or green).
Figure 5.
Figure 5.
Boxplots for mRNA copy numbers for each receptor gene of interest across all four experimental groups (motor and interneuron slices, control and injured). Formatting of groups, boxplots, and statistics as in Figure 4.
Figure 6.
Figure 6.
Single motor neuron gene expression analyses recapitulate transcript levels in whole slices. Mean ± SD copy numbers of four genes of interest across experimental groups (control and injured) in both slices and single motor neurons. Significant differences (p < 0.05; t-test) between control and injured samples are shown with **. Note, while our post-hoc analyses following two-way ANOVA did not have the statistical power to detect significant differences in HTR2C in motor neuron slices (see Figure 5), a direct comparison with t-test reveals this difference in both slices and single motor neurons. Sample sizes indicated in each bar.
Figure 7.
Figure 7.
Changes in correlated gene expression as a result of SCI in MNslices. A1 and B1) Correlograms were generated as described in Figure 2. The control correlogram is re-plotted from Figure 2 for comparison with the SCI correlogram below. Dashed boxes are labeled (e.g. A, A’) for discussion of Results in the main text. The order of the genes along the x- and y-axes are the same, and are represented in the same order as in Appendix B for comparison. A2 and B2) The histogram for the distribution of R-values in a given experimental group is plotted beside each correlogram. A3 and B3) Gene co-expression network plots were generated to visualize the density of correlated transcript pairs before and after SCI. Each red node represents a given transcript, and if two nodes are connected with a line, their mRNA levels were correlated with an R-value > 0.7.
Figure 8.
Figure 8.
Changes in correlated gene expression as a result of SCI in INslices. All notation as in Figure 7. Note the substantial number of connected nodes in panels 8A3 vs. 8B3 that reflect an increase in positively correlated gene co-expression in SCI as a reflection of the histograms in panels A2 and B2.
Figure 9.
Figure 9.
Correlation analyses reveal that interneuron-enriched slices and motor neuron-enriched slices respond differently to spinal cord injury. A1 and B1) Correlograms were generated (as described in Figure 2) for subtracted R-values (∆R = RSCI – RCTRL) for each transcript pair to detect changes in relationships among transcripts as a result of injury. A2 and B2) The histogram for the distribution of ∆R in a given experimental group is plotted below each correlogram of ∆R-values. A3 and B3) Cumulative distribution functions from each slice type reveals a significantly different distribution of R values (P < 0.001; Two-sample K-S test) between control and SCI animals. Motor neuron-enriched slices tend towards a loss of positive correlations, as seen by the leftward shift of the distribution for values greater than 0 from control to SCI. Conversely, interneuron-enriched slices show a dramatic rightward shift overall, as a manifestation of the large number of relationships that become positively correlated following SCI as shown in the panels above.

References

    1. Adams MM, Hicks AL (2005) Spasticity after spinal cord injury. Spinal Cord 43:577–586. - PubMed
    1. Amendola J, Woodhouse A, Martin-Eauclaire M-F, Goaillard J-M (2012) Ca2+/cAMP-sensitive covariation of I(A) and I(H) voltage dependences tunes rebound firing in dopaminergic neurons. J Neurosci 32:2166– 2181. - PMC - PubMed
    1. Anelli R, Sanelli L, Bennett DJ, Heckman CJ (2007) Expression of L-type calcium channel alpha(1)-1.2 and alpha(1)-1.3 subunits on rat sacral motoneurons following chronic spinal cord injury. Neuroscience 145:751–763. - PubMed
    1. Ball JM, Franklin CC, Tobin A-E, Schulz DJ, Nair SS (2010) Coregulation of ion channel conductances preserves output in a computational model of a crustacean cardiac motor neuron. J Neurosci 30:8637– 8649. - PMC - PubMed
    1. Bauman CA, Milligan JD, Lee FJ, Riva JJ (2012) Autonomic dysreflexia in spinal cord injury patients: an overview. J Can Chiropr Assoc 56:247–250. - PMC - PubMed

Publication types