. 2018 Oct 2;25(1):212-223.e4.
doi: 10.1016/j.celrep.2018.09.013.

XBP1-KLF9 Axis Acts as a Molecular Rheostat to Control the Transition from Adaptive to Cytotoxic Unfolded Protein Response

Affiliations

XBP1-KLF9 Axis Acts as a Molecular Rheostat to Control the Transition from Adaptive to Cytotoxic Unfolded Protein Response

Emily E Fink et al. Cell Rep. .

Abstract

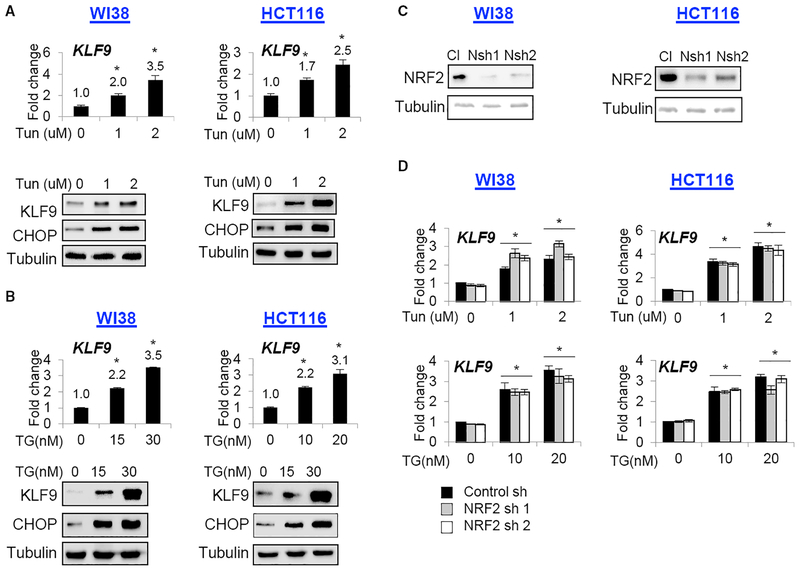
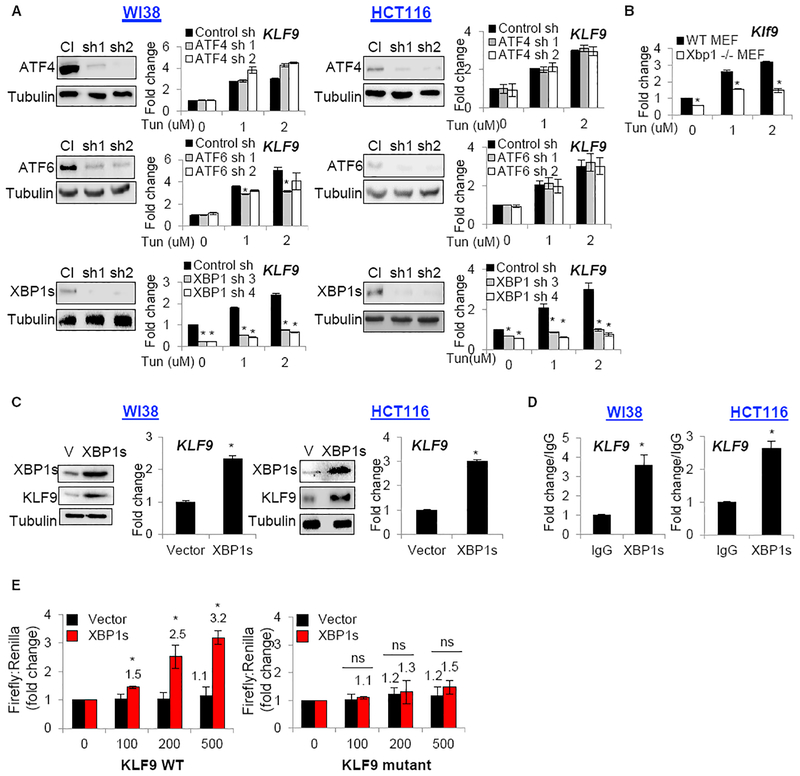
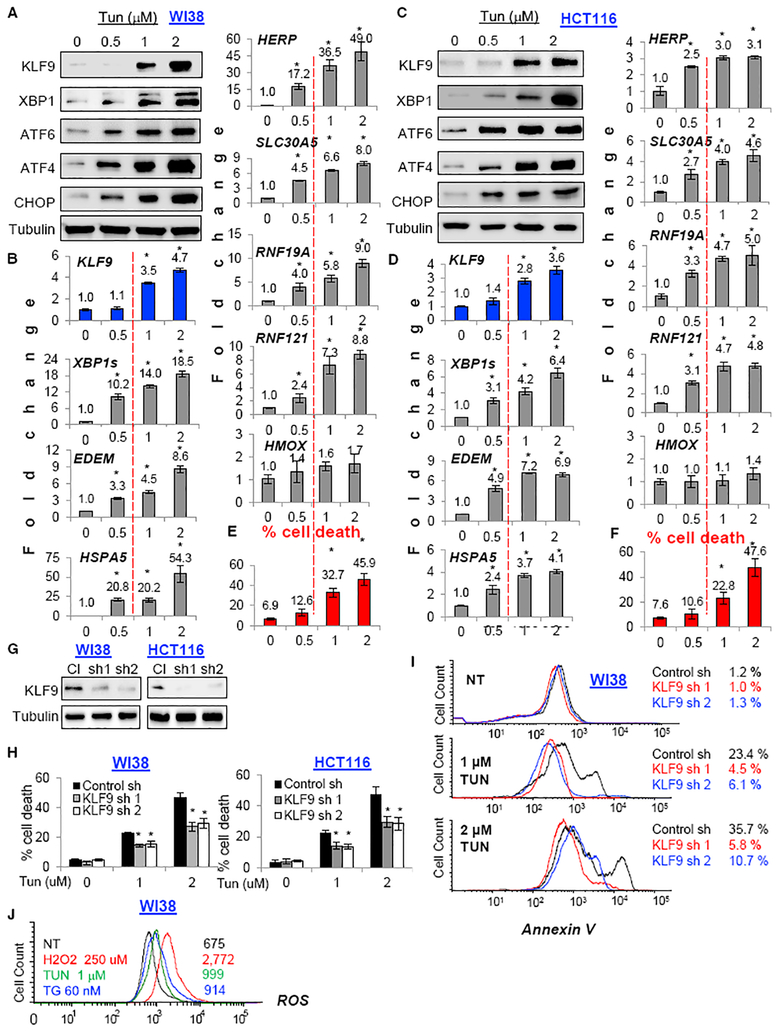
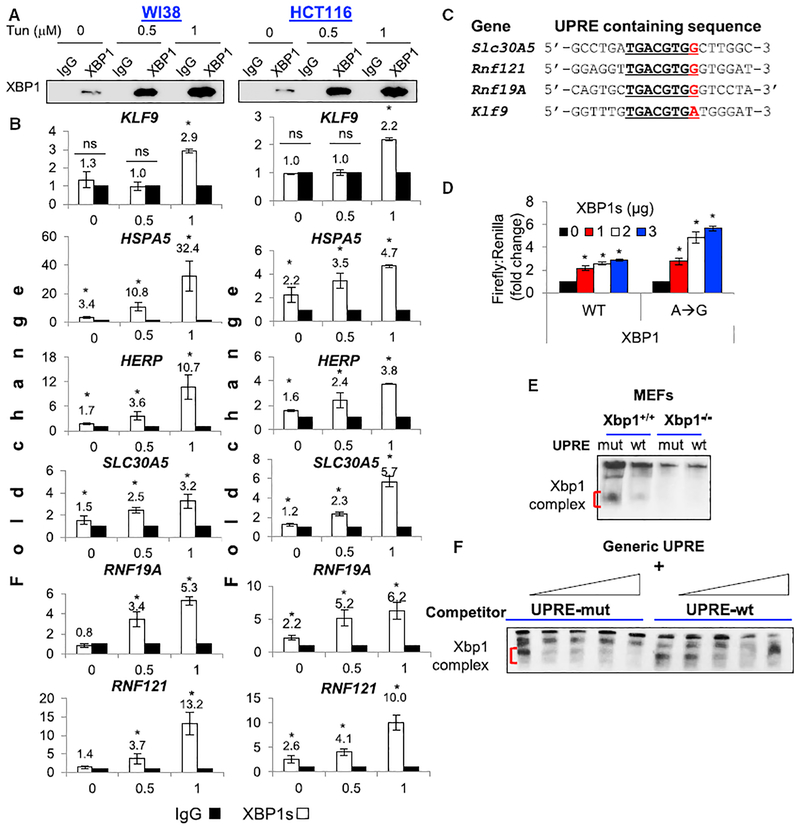
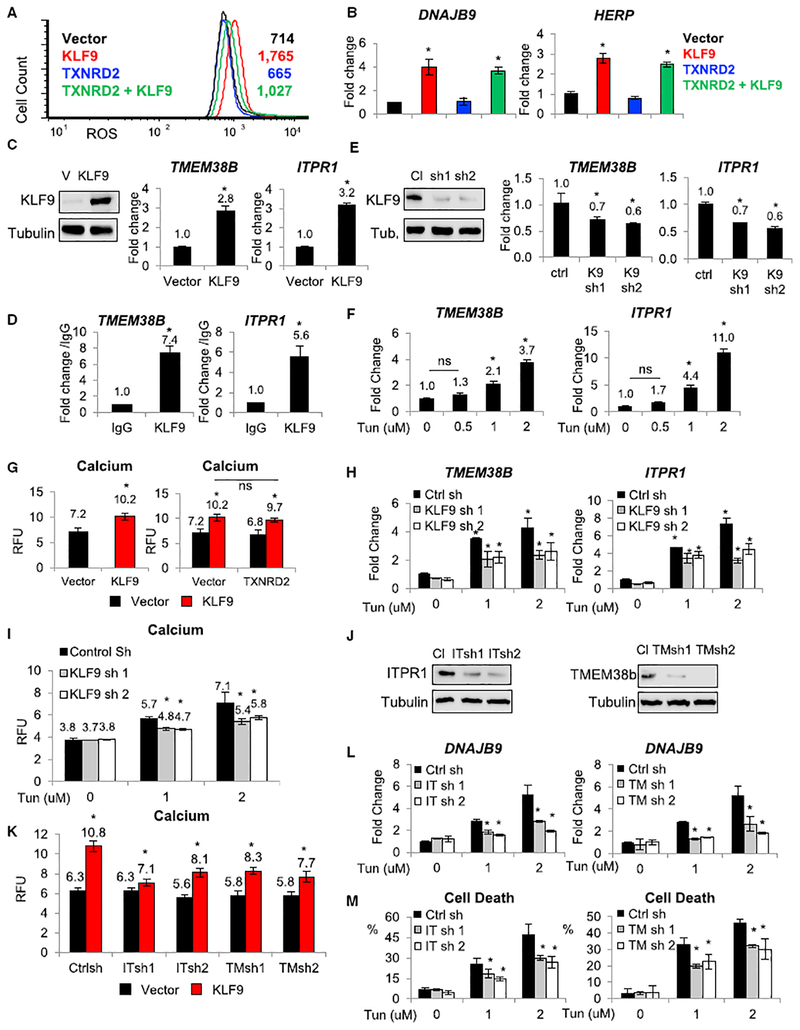
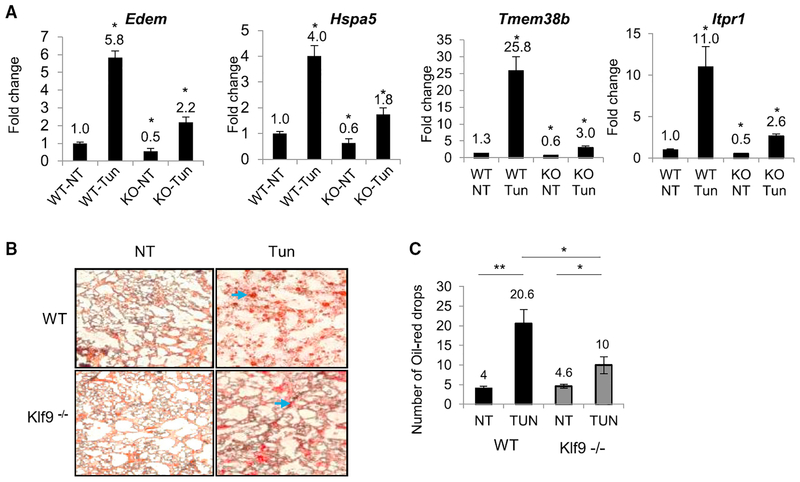
Transcription factor XBP1s, activated by endoplasmic reticulum (ER) stress in a dose-dependent manner, plays a central role in adaptive unfolded protein response (UPR) via direct activation of multiple genes controlling protein refolding. Here, we report that elevation of ER stress above a critical threshold causes accumulation of XBP1s protein sufficient for binding to the promoter and activation of a gene encoding a transcription factor KLF9. In comparison to other XBP1s targets, KLF9 promoter contains an evolutionary conserved lower-affinity binding site that requires higher amounts of XBP1s for activation. In turn, KLF9 induces expression of two regulators of ER calcium storage, TMEM38B and ITPR1, facilitating additional calcium release from ER, exacerbation of ER stress, and cell death. Accordingly, Klf9 deficiency attenuates tunicamycin-induced ER stress in mouse liver. These data reveal a role for XBP1s in cytotoxic UPR and provide insights into mechanisms of life-or-death decisions in cells under ER stress.

Keywords: ITPR1; KLF9; TMEM38B; UPR; XBP1s; calcium channel; endoplasmic reticulum stress.


Conflict of interest statement

DECLARATION OF INTERESTS

The authors declare no competing interests.

Figures

Figure 1.
Figure 1.. KLF9 Is Upregulated by ER Stress Independently from NRF2
(A and B) Cells were treated with indicated doses of (A) tunicamycin (Tun) or (B) thapsigargin (TG) for 24 hr and probed by qRT-PCR (upper panels, KLF9/β-actin signal ratios are shown) or immunoblotting (lower panels) with indicated antibodies. (C) Indicated cells were transduced with control (Cl) or NRF2 (Nsh1 or Nsh2) shRNAs followed by immunoblotting with the indicated antibodies.(D) Cells described in (C) were treated with indicated doses of Tun or TG for 24 hr and probed in qRT-PCR (KLF9/β-actin signal ratios are shown). Representative images shown. All data represent mean ± SEM of 2 or more biological replicates. Statistical significance was analyzed using two-tailed Student’s t test. A p < 0.05 (*) was considered significant.
Figure 2.
Figure 2.. XBP1s Transcriptionally Activates KLF9
(A) Lysates from cells transduced with the indicated shRNAs were probed in immunoblotting with the indicated antibodies (left panels) or treated with indicated doses of Tun followed by qRT-PCR (KLF9/β-actin signal ratios are shown). (B) Wild-type or Xbp1 knockout MEFs were probed in qRT-PCR (Klf9/β-actin signal ratios are shown).(C) Cells were transduced with empty vector (V) or XBP1s cDNA followed by immunoblotting with the indicated antibodies or probed in qRT-PCR (KLF9/β-actin signal ratios are shown).(D) DNA from indicated cells was immunoprecipitated with control (IgG) or XBP1s-specific (XBP1s) antibodies. The precipitated material was probed in qPCR with primers for KLF9 promoter.(E) HEK293FT cells were transfected with the pGL3-promoter-KLF9-WT or pGL3-promoter-KLF9 mutant promoter (lacking first 4 bp of XBP1s UPRE) and the pRLSV40 plasmid expressing the Renilla luciferase gene. Cells were co-transfected with empty vector or XBP1s cDNA. Luciferase activity was measured 24 hr post-treatment. Representative images shown. All data represent mean ± SEM of 2 or more biological replicates. Statistical significance was analyzed using two-tailed Student’s t test. A p < 0.05 (*) was considered significant.
Figure 3.
Figure 3.. KLF9 Is Upregulated by Toxic Doses of Tunicamycin
(A–D) Indicated cells treated with the indicated doses of Tun for 24 hr were probed in immunoblotting with the indicated antibodies (A and C) or in qRT-PCR (shown are ratios of signal for an indicated gene and β-actin; B and D). (E and F) Viability of cells treated as in (A) or (D) was assessed via trypan blue viability assay. (G) Cells transduced with control shRNA (Cl) or KLF9 shRNAs (sh1 and sh2) were probed in immunoblotting with indicated antibodies. Representative images are shown. (H and I) Cells described in (G) were treated with Tun for 48 hr and probed in trypan blue viability assay (H) or annexin V apoptosis assay (I). (J) Cells were treated with indicated doses of the drugs and analyzed for ROS levels using fluorescence-activated cell sorting (FACS). All data represent mean ± SEM of 2 or more biological replicates. Statistical significance was analyzed using two-tailed Student’s t test. A p < 0.05 (*) was considered significant.
Figure 4.
Figure 4.. XBP1s Does Not Efficiently Interact with the UPRE in KLF9 Promoter
(A) Indicated cells treated with the indicated doses of Tun were processed for ChIP assay and immunoprecipitated with IgG or XBP1s-specific antibodies followed by immunoblotting with XBP1s antibodies. (B) Cells treated as in (A) were probed by qPCR with primers encompassing XBP1s binding sites in the regulatory regions of indicated genes (see Figure S4A). (C) Nucleotide sequence of the UPRE sites in the regulatory regions of indicated genes. (D) HEK293FT cells were transduced with the pGL3-promoter-KLF9-WT or pGL3-promoter-KLF9 mutant promoter (containing TGACGTGG sequence) and the pRLSV40 plasmid expressing the Renilla luciferase gene. Cells were co-transfected with empty vector or XBP1s cDNA. Luciferase activity was measured 24 hr post-treatment. (E) Nuclear extracts from tunicamycin-treated wild-type and Xbp1s−/− MEFs were incubated with biotin-labeled probe containing wild-type (wt) or mutant (mut) KLF9 UPRE and resolved on native gels. Protein/DNA complexes were visualized with a chemiluminescent system. (F) Nuclear extracts from tunicamycin-treated wild-type MEFs were incubated with a biotin-labeled probe containing a generic UPRE site and increasing amounts of unlabeled wt or mut KLF9 UPRE. Protein/DNA complexes were visualized with a chemiluminescent system. Representative images shown. All data represent mean ± SEM of 2 or more biological replicates. Statistical significance was analyzed using two-tailed Student’s t test. A p < 0.05 (*) was considered significant.
Figure 5.
Figure 5.. KLF9 Increases Intracellular Calcium Levels
All experiments were performed in WI38 cells. (A) Cells expressing the indicated constructs were analyzed for ROS levels using FACS. (B) Cells described in (A) were probed in qRT-PCR with the indicated probes (shown are ratios of signal for an indicated gene and β-actin). (C) Cells transduced with V or KLF9 cDNA (KLF9) were probed in immunoblotting with indicated antibodies (left panel) or in qRT-PCR with the indicated probes (right panel; shown are ratios of signal for an indicated gene and β-actin). (D) DNA from cells overexpressing KLF9 cDNA was immunoprecipitated with control (IgG) or KLF9-specific (KLF9) antibodies. The precipitated material was probed in qPCR with primers for TMEM38B or ITPR1 promoters. (E) Cells transduced with control shRNA (Cl) or KLF9 shRNAs (sh1 and sh2) were probed in immunoblotting with indicated antibodies (left panel) or in qRT-PCR with the indicated probes (right panel; shown are ratios of signal for the indicated gene and β-actin). (F) Cells were treated with indicated doses of Tun for 24 hr followed by qRT-PCR with the indicated probes (shown are ratios of signals for an indicated gene and β-actin). (G) Cells expressing empty vector, KLF9 cDNA, TXNRD2 cDNA, or co-expressing these constructs (as in A) were probed for intracellular calcium content using Fluo-4 Direct Calcium Assay Kit. (H) Control and KLF9-depleted cells (described in E) were treated with indicated doses of Tun for 24 hr followed by qRT-PCR with the indicated probes (shown are signal ratios for an indicated gene and β-actin). (I) Cells described in (H) were probed for intracellular calcium content using Fluo-4 Direct Calcium Assay kit. (J) Cells were transduced with the control shRNA (Cl) or ITPR1 shRNAs (ITsh1 and ITsh5) or TMEM38B shRNAs (TMsh1 and TMsh3) followed by immunoblotting with indicated antibodies. (K) Cells expressing indicated constructs were probed for intracellular calcium content using Fluo-4 Direct Calcium Assay Kit. (L) Cells expressing indicated constructs were probed in qRT-PCR with the indicated probes (shown are ratios of signal for an indicated gene and β-actin). (M) Cells described in (K) were treated with indicated doses of Tun for 48 hr and analyzed by trypan blue viability assay. Representative images shown. All data represent mean ± SEM of 2 or more biological replicates. Statistical significance was analyzed using two-tailed Student’s t test. A p < 0.05 (*) was considered significant.
Figure 6.
Figure 6.. Klf9 Deficiency Decreases ER Stress Markers and Hepatic Steatosis in Mice
(A) WT and Klf9 knockout mice (KO) mice were injected intraperitoneally with vehicle (V) or Tun. The animals were euthanized, and the livers were excised 30 hr post-injection. RNA isolation and expression of the indicated genes was assayed by qRT-PCR (shown are ratios of signal for an indicated gene and β-actin). (B) Sections of livers from mice described in (A) were fixed in formalin and stained with oil red O. (C) Quantification of oil red drops in samples described in (B). Representative images shown. All data represent mean ± SEM of 2 or more biological replicates. Statistical significance was analyzed using two-tailed Student’s t test. *p < 0.05; **p < 0.01. A p < 0.05 was considered significant.

References

    1. Arnér ES (2009). Focus on mammalian thioredoxin reductases–important selenoproteins with versatile functions. Biochim. Biophys. Acta 1790, 495–526. - PubMed
    1. Cabral WA, Ishikawa M, Garten M, Makareeva EN, Sargent BM, Weis M, Barnes AM, Webb EA, Shaw NJ, Ala-Kokko L, et al. (2016). Absence of the ER cation channel TMEM38B/TRIC-B disrupts intracellular calcium homeostasis and dysregulates collagen synthesis in recessive osteogenesis imperfecta. PLoS Genet. 12, e1006156. - PMC - PubMed
    1. Camandola S, Cutler RG, Gary DS, Milhavet O, and Mattson MP (2005). Suppression of calcium release from inositol 1,4,5-trisphosphate-sensitive stores mediates the anti-apoptotic function of nuclear factor-kappaB.J. Biol. Chem 280, 22287–22296. - PubMed
    1. Chitnis NS, Pytel D, Bobrovnikova-Marjon E, Pant D, Zheng H, Maas NL, Frederick B, Kushner JA, Chodosh LA, Koumenis C, et al. (2012). miR-211 is a prosurvival microRNA that regulates chop expression in a PERK-dependent manner. Mol. Cell 48, 353–364. - PMC - PubMed
    1. Ghosh R, Wang L, Wang ES, Perera BG, Igbaria A, Morita S, Prado K, Thamsen M, Caswell D, Macias H, et al. (2014). Allosteric inhibition of the IRE1α RNase preserves cell viability and function during endoplasmic reticulum stress. Cell 158, 534–548. - PMC - PubMed

Publication types