. 2018 Nov 5;215(11):2778-2795.
doi: 10.1084/jem.20181468. Epub 2018 Oct 3.

Neutrophils instruct homeostatic and pathological states in naive tissues

Affiliations

Neutrophils instruct homeostatic and pathological states in naive tissues

Maria Casanova-Acebes et al. J Exp Med. .

Abstract

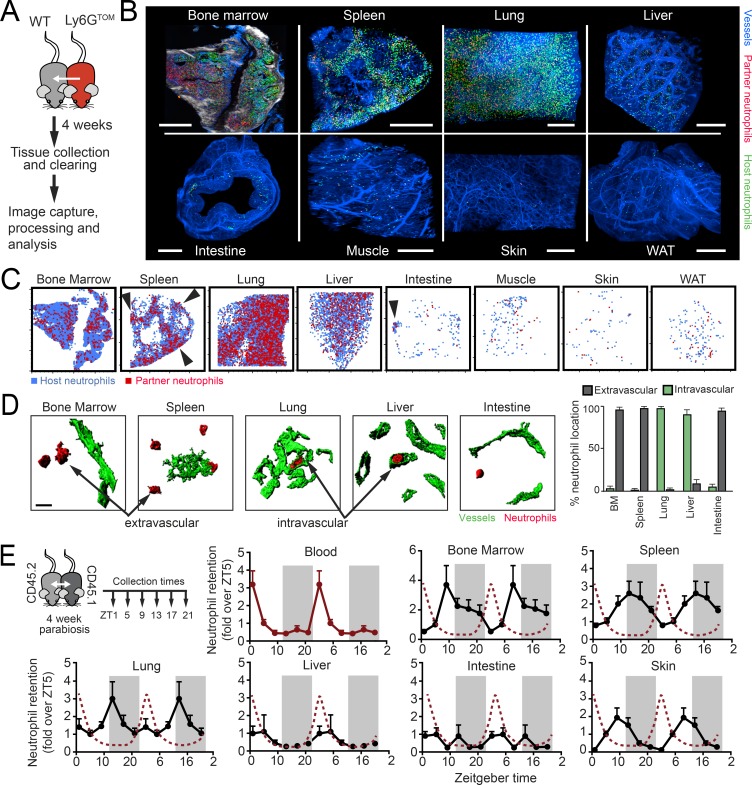
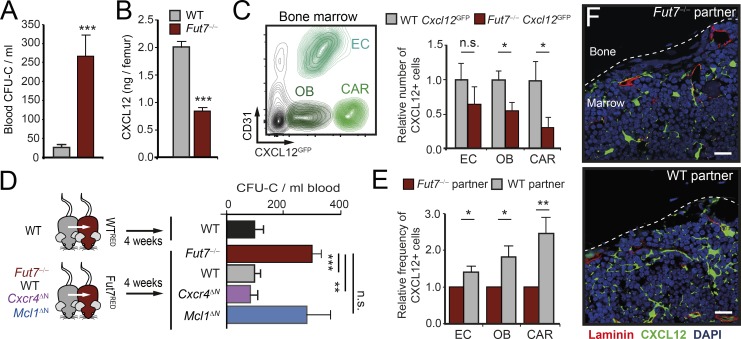
Immune protection relies on the capacity of neutrophils to infiltrate challenged tissues. Naive tissues, in contrast, are believed to remain free of these cells and protected from their toxic cargo. Here, we show that neutrophils are endowed with the capacity to infiltrate multiple tissues in the steady-state, a process that follows tissue-specific dynamics. By focusing in two particular tissues, the intestine and the lungs, we find that neutrophils infiltrating the intestine are engulfed by resident macrophages, resulting in repression of Il23 transcription, reduced G-CSF in plasma, and reinforced activity of distant bone marrow niches. In contrast, diurnal accumulation of neutrophils within the pulmonary vasculature influenced circadian transcription in the lungs. Neutrophil-influenced transcripts in this organ were associated with carcinogenesis and migration. Consistently, we found that neutrophils dictated the diurnal patterns of lung invasion by melanoma cells. Homeostatic infiltration of tissues unveils a facet of neutrophil biology that supports organ function, but can also instigate pathological states.


Figures

None
Graphical abstract
Figure 1.
Figure 1.
Multi-organ infiltration of neutrophils in the steady-state. (A) Micrographs of tissues illustrating the presence of neutrophils (green; shown by yellow arrowheads) in Lyz2GFP reporter mice. These GFPHI cells also stained for Ly6G (see Fig. S1 B). Insets show details of neutrophils within each tissue. Bars: 100 µm (main images); 10 µm (inset images). (B) Neutrophils infiltrate multiple organs from the circulation, as observed in parabiotic pairs (left scheme). Representative images of Lyz2GFP neutrophils present in tissues of the nonfluorescent WT partner mouse. Bars: 50 µm (main images); 10 µm (inset images). (C) Quantification of partner-derived neutrophils per organ (except for blood, which represents 1 ml; for BM, one femur; for skin and muscle, 100 mg); n = 8–18 from three independent experiments. (D) Neutrophil chimerism in tissues of the nonfluorescent partner from WT with Lyz2GFP parabiotic pairs; n = 20–22 from two independent experiments. Note that chimerism in tissues equilibrates with that in blood, except for the BM. Error bars show mean ± SEM values.
Figure 2.
Figure 2.
Distribution and dynamics of neutrophils in tissues. (A) Experimental scheme and imaging of Ly6GTOM neutrophils in tissues of the WT parabiotic partner. (B) Distribution of neutrophils in optically cleared organs by multiphoton microscopy (for BM; white is bone captured by second harmonic generation) or LSM; n = organs from 2–3 mice. Blue, vessels; green, host-derived neutrophils; red, partner-derived neutrophils. Bars, 500 µm. See also Videos 1–8 showing partner-derived neutrophils within the tissue. (C) Positioning plots showing the distribution of host- (blue) and partner-derived (red) neutrophils in two-dimensional maps of each tissue. Arrows show areas where neutrophils cluster. Plots obtained from the tissues shown in B. (D) Confocal reconstruction of neutrophils (red) proximal to blood vessels (green) in representative tissues from parabionts as in A. Partner-derived neutrophils were preferentially found in the parenchyma (extravascular) or within vessels (intravascular), depending on the tissues, as quantified in the right bar graph. Bars show mean ± SEM values from the analysis 31–73 neutrophils per tissue from three different animals. (E) Left, experimental design. Curves show the number of partner-derived neutrophils as determined by flow cytometry from the tissues of parabiotic pairs collected at the indicated ZTs. Values are normalized to ZT5 and duplicated over two complete days for better visualization. Periods of darkness are shown by the shaded rectangles, and the red dotted lines show the oscillations in blood for reference. Values are mean ± SEM from 10–12 mice per time and tissue from two experiments. Intestine refers to the large intestine (colon).
Figure 3.
Figure 3.
Control of BM homeostasis by extramedullary neutrophils. (A) Number of CFUs in culture (CFU-C) at ZT5 in the blood of WT and Fut7−/− mice; n = 6 mice from two experiments. (B) Levels of CXCL12 protein in the BM of WT and Fut7−/− mice; n = 6–10 mice from two experiments. (C) Reduced number of CXCL12-producing cells in the BM of Fut7−/−; Cxcl12GFP mice, as measured by flow cytometry; n = 5–8 mice from two experiments. Density plot at left shows the gating strategy to identify endothelial cells (EC), osteoblasts (OB), and reticular cells (CAR). (D) Experimental design (left) and number of WTRED or Fut7RED-derived circulating progenitors (CFU-C) after 1 mo in parabiosis with WT or the indicated mutant mice. For comparison, the levels of circulating HPCs in WT control parabionts is shown; n = 3–20 mice. Cxcr4ΔN and Mcl1ΔN are neutrophil-specific mutants (characterized in Fig. S3). (E) Relative number of CXCL12-producing cells in the BM of Fut7−/−; Cxcl12GFP mice after 1 mo in parabiosis with Fut7−/− or WT mice; n = 8–9 mice from three independent experiments. (F) Micrographs showing GFP+ niche cells (green) in the BM of Fut7−/−; Cxcl12GFP mice after parabiosis with Fut7−/− or WT mice. Dashed lines outline the bone surface. Data from three mice per group. Bars, 20 µm. Data shown as mean ± SEM. *, P < 0.05; **, P < 0.01; ***, P < 0.001; n.s., not significant, as determined by unpaired Student’s t test (A, B, C, and E), or ANOVA with Tukey’s multigroup correction (D).
Figure 4.
Figure 4.
Regulatory functions of neutrophils in the intestine. (A) Experimental strategy and cytometry plots. Dot plots, gated on CD45+ CD11b+ Ly6G+ cells, show neutrophils in tissues of Fut7RED mice after parabiosis with Fut7−/− control or WT partners. Numbers indicate mean ± SEM of partner-to-host ratios corrected by ratios in blood and normalized to the Fut7−/−; Fut7−/− parabiotic pairs (see Materials and methods). (B) Radial plots showing the relative infiltration of partner-derived and Fut7−/− neutrophils in different tissues. Polygons show the mean ± SEM ratio of partner to Fut7RED neutrophils in each tissue, which are shown in the plots in A. Data from four to five pairs per group from three independent experiments. (C) Experimental approach to estimate phagocytosis of partner-derived fluorescent leukocytes by tissue macrophages using flow cytometry. (D) Percentage of macrophages that engulf partner-derived cells in organs of Fut7−/− parabionts paired with WTRED or Fut7RED partners; n = 5–6 mice from two independent experiments. (E) Number of circulating progenitors in Fut7−/− mice after 1 mo in parabiosis with Fut7−/− or WT partners or Fut7−/−; Cd169DTR mice paired with WT mice after macrophage depletion by treatment with DT; n = 6–12 mice from three independent experiments. (F) Whole-mount staining of the large intestine of Lyz2GFP mice showing GFP+ foci in the mucosal surface. Bar, 1 mm. (G) Detail of an ILF showing the distribution of CD169+ macrophages, MRP14+ neutrophils, and the microvasculature (laminin; white). Bar, 100 µm (see also Video 9). (H) Representative plot showing intestinal macrophages that phagocytose (red) or not (black) partner-derived DsRed+ cells, as in C and D. Bar graph at right shows expression of Il1b and Il23 in phagocytic macrophages relative to non-phagocytic cells; data are from cells sorted from three individual mice. (I) Scheme of the IL-23–IL-17–G-CSF pathway. (J) Number of circulating CFU-C in Fut7−/− mice after treatment with isotype or blocking antibodies against the cytokines shown in I; n = 5–6 mice from two (left) and one independent experiments. Data shown as mean ± SEM. *, P < 0.05; **, P < 0.001; ***, P < 0.001; n.s., not significant, as determined by unpaired t test analysis (B, D, H, and J) or one-way ANOVA analysis with Tukey’s multigroup test (E).
Figure 5.
Figure 5.
Diurnal regulation of the lung transcriptome by neutrophils. (A) Experimental scheme for neutrophil depletion and collection of lungs at different diurnal times for RNA sequencing; n = 7 replicates per condition and time from two experiments. (B) Distribution of pulmonary transcripts: total genes (green; 100%) and genes that display diurnal changes in transcription (purple; 9.2%), a fraction of which loses diurnal oscillations when neutrophils are depleted (orange; representing 26.7% of diurnally oscillating or 2.5% of total transcripts). (C) Heat map of diurnally expressed genes that lose their diurnal variation in neutrophil-depleted lungs, with several representative genes indicated at right. Only genes with an adjusted P value <0.05 in a moderated t test in the non-depleted group were included; n = 7 mice per group. (D) Major biological functions affected by the neutrophil-regulated diurnal genes shown in C. The functions were identified from the pathways indicated by numbers (1–21) and listed in Fig. S5 C and Table S1. The total number of unique genes in the list was calculated for each biological function, and the color scale reflects the proportion of the genes in each pathway that contribute to the specific function.
Figure 6.
Figure 6.
Diurnal metastasis of melanoma cells in lungs. (A) Experimental design to assess the effect of time of day in metastatic invasion of lungs by B16F1Luc melanoma cells. (B) Number of metastatic lesions 14 d after injection of B16F1Luc melanoma cells, as determined by the luminescence of lung explants, shown at bottom. Values are from a representative of two experiments, each with n = 3–5 mice per time point and experiment. (C) Representative H&E-stained sections of lungs from each time point. Bar, 100 µm. (D) Bioluminescence counts reflecting metastatic burden of lungs, 14 d after injection of B16F1Luc cells in the morning (AM, corresponding to ZT4) or in the evening (PM, corresponding to ZT16), in control mice or mice previously depleted of neutrophils. Values are normalized to AM; n = 9 mice from two independent experiments. Data are shown as mean ± SEM. *, P < 0.05; n.s., not significant, as determined by unpaired t test analysis.
Figure 7.
Figure 7.
Homing of metastatic cells to lung is regulated by neutrophils. (A) Disrupted diurnal infiltration of Bmal1ΔN neutrophils into lungs. Experimental design. (B) Relative number of partner-derived neutrophils in the lungs of partner mice at AM or PM (ZT4 and 16, respectively), determined by flow cytometry; n = 4 (for Bmal1ΔN) to 20 (for WT) mice. ND, not determined for neutrophil-depleted (1A8 antibody) mice. (C) Relative homing of B16F1Luc cells to the lungs of control, neutrophil-depleted mice and Bmal1ΔN mice, as determined by flow cytometry 24 h after injection; n = 3–5 mice (control and depleted) or 9 (Bmal1ΔN) per time and experiment from at least two independent experiments. Values are normalized to AM. Values show mean ± SEM. *, P < 0.05; n.s., not significant, comparing AM versus AM or PM versus PM values, as determined by Student’s two-tailed unpaired t test analysis. (D) Schematic of neutrophil dynamics during homeostasis and physiological roles in intestine and lungs. Neutrophils released from the BM into blood infiltrate multiple tissues with distinct circadian dynamics (boxes next to tissue names). Most tissues display rhythms in anti-phase with blood, while infiltration in liver, WAT, and intestine are arrhythmic. Illustration of remote control of hematopoietic niches through modulation of Il23 transcription within intestinal ILF (bottom left box). In the lung, neutrophils regulated diurnal transcription (bottom right box), thereby affecting the susceptibility to metastatic invasion by B16F1 melanoma cells (right; see also Video 10).

References

    1. Adrover J.M., Nicolás-Ávila J.A., and Hidalgo A.. 2016. Aging: A Temporal Dimension for Neutrophils. Trends Immunol. 37:334–345. 10.1016/j.it.2016.03.005 - DOI - PubMed
    1. A-González N., Quintana J.A., García-Silva S., Mazariegos M., González de la Aleja A., Nicolás-Ávila J.A., Walter W., Adrover J.M., Crainiciuc G., Kuchroo V.K., et al. . 2017. Phagocytosis imprints heterogeneity in tissue-resident macrophages. J. Exp. Med. 214:1281–1296. 10.1084/jem.20161375 - DOI - PMC - PubMed
    1. Asano K., Takahashi N., Ushiki M., Monya M., Aihara F., Kuboki E., Moriyama S., Iida M., Kitamura H., Qiu C.H., et al. . 2015. Intestinal CD169(+) macrophages initiate mucosal inflammation by secreting CCL8 that recruits inflammatory monocytes. Nat. Commun. 6:7802 10.1038/ncomms8802 - DOI - PMC - PubMed
    1. Auffray C., Fogg D., Garfa M., Elain G., Join-Lambert O., Kayal S., Sarnacki S., Cumano A., Lauvau G., and Geissmann F.. 2007. Monitoring of blood vessels and tissues by a population of monocytes with patrolling behavior. Science. 317:666–670. 10.1126/science.1142883 - DOI - PubMed
    1. Bermejo D.A., Jackson S.W., Gorosito-Serran M., Acosta-Rodriguez E.V., Amezcua-Vesely M.C., Sather B.D., Singh A.K., Khim S., Mucci J., Liggitt D., et al. . 2013. Trypanosoma cruzi trans-sialidase initiates a program independent of the transcription factors RORγt and Ahr that leads to IL-17 production by activated B cells. Nat. Immunol. 14:514–522. 10.1038/ni.2569 - DOI - PMC - PubMed

Publication types

MeSH terms

Substances