Review
. 2018 Oct 3;15(147):20180244.
doi: 10.1098/rsif.2018.0244.

Lessons from pressure denaturation of proteins

Affiliations
Review

Lessons from pressure denaturation of proteins

Julien Roche et al. J R Soc Interface. .

Abstract

Although it is now relatively well understood how sequence defines and impacts global protein stability in specific structural contexts, the question of how sequence modulates the configurational landscape of proteins remains to be defined. Protein configurational equilibria are generally characterized by using various chemical denaturants or by changing temperature or pH. Another thermodynamic parameter which is less often used in such studies is high hydrostatic pressure. This review discusses the basis for pressure effects on protein structure and stability, and describes how the unique mechanisms of pressure-induced unfolding can provide unique insights into protein conformational landscapes.

Keywords: pressure; protein folding; protein stability.


Conflict of interest statement

We declare we have no competing interests.

Figures
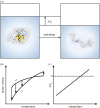
Figure 1.
Figure 1.
Protein volumetric properties. (a) Schematic depicting the fact that the volume of a molar solution of folded protein is larger than that of a solution of unfolded protein. This is the case at atmospheric pressure. (b) Schematic of the temperature dependence of the volume of a protein folded state and unfolded state. Arrows depict the difference between the two as the volume of the folded state minus the volume of the unfolded state. (c) Schematic of how the difference in volume between the folded and unfolded states of a protein, ΔVu, changes with temperature. (Online version in colour.)
Figure 2.
Figure 2.
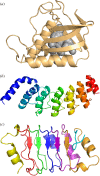
Model protein systems. (a) Staphylococcal nuclease [76]. The grey spheres represent the internal void volume detected using Hollow and a 1.1 A probe [78]. (b) The ankyrin repeat domain of the Notch receptor (Nank) [79]. Each ankyrin repeat is coloured a different colour in rainbow order from N- to C-terminus. (c) The leucine-rich repeat domain of the Anp32 tumour suppressor protein (pp32) [80]. The N-terminal capping motif is coloured yellow, the C-terminal capping motif is coloured cyan, and repeats 1–5 are coloured red, green, blue, purple and orange, respectively. All protein structures were rendered using PyMol [81]. (Online version in colour.)
Figure 3.
Figure 3.
Effects of cavity-creating mutations on the volume change of unfolding of the hyerstable Snase variant, Δ+PHS. (a) Cartoons of the structures of the Snase Δ + PHS background, and the L125A, I92A and V66A variants, as indicated [22]. The cavities in purple and green were calculated using McVol [89] and a 1.1 A probe as described in [22]. (b) Volume change of folding, ΔVf, for the Δ + PHS background and 10 variants studied using HP fluorescence. Results first reported in [22]. Error bars represent uncertainty in the value of obtained from rigorous confidence limit testing analysis of three curves at different denaturant concentration for each variant. (Online version in colour.)
Figure 4.
Figure 4.
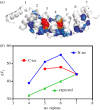
Effect of size on the volume change of unfolding. (a) Cartoon representation of the Nank protein obtained from molecular dynamics simulations showing the internal cavities in red and blue. Red regions are those for which the distance to the closest water molecule is greater than 5 Å, while in blue are those for which water molecules were present at a distance of less than 5 Å as described in [95]. Repeats are numbered 1–7. (b) The dependence of volume change of folding, ΔVf, determined from HP fluorescence on the size of the protein. In blue are results from variants deleted for 1, 2 and 3 repeats from the N-terminus, and in red are the results from variants deleted for 1 or 2 repeats from the C-terminus. In green is the result that was expected if hydration of exposed surface area and differences in density between bulk and hydrating water molecules were responsible for the value of ΔVf. Results were first reported in [95]. (Online version in colour.)
Figure 5.
Figure 5.
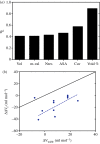
Origin of the volume change for unfolding. (a) Correlation coefficient between the published volume change for unfolding and various properties of a series of proteins. The internal cavity volume (CAV), the number of residues (NRes), the molecular volume (Vol), the m-value from chemical denaturation, the change in ASA upon unfolding and the void volume/molar volume (V%). Proteins are BdpA (Roche and Royer, unpublished data), CI2 [96], CspB [97], ubiquitin, P13 [98], two azurin mutants (AzI7A and AzF110S) [99], lysozyme [100], a series of Snase Δ + PHS cavity mutants (I92A, V66A, F34A, L38A, L103A, V74A, L25A and L36A) [22] and WT Snase and a series of cavity mutants V66G, V66A and V66 L [88]. (b) Correlation between the measured difference in volume change of folding, ΔVf, with respect to the difference in van der Waals volume for a series of Δ + PHS Snase mutants in which buried hydrophobic residues (I, L, V) have been replaced by ionizable residues (D, E, K, R). The black line is simply the difference in van der Waals volume versus the difference in van der Waals volume for each mutation (a line with a zero intercept and a slope of unity). (Online version in colour.)
Figure 6.
Figure 6.
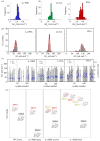
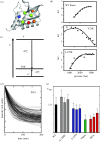
Pressure-dependent HSQC experimental approach. (a) HSQC spectrum of WT pp32 at 293 K and 1 bar, (b) HSQC spectrum of WT pp32 at 293 K and 2500 bar, (c) example curves for the loss of native state peak intensity as a function of pressure. Curves from three of the 155 residues are shown and labelled as residue X, Y and Z, simply for illustrative purposes. (d) Fractional contact histogram for WT pp32 at 1300 bar and 303 K as calculated from the fractional intensity values for each native contact according to the equation in the inset. Native contacts are in grey above the diagonal. (Online version in colour.)
Figure 7.
Figure 7.
Conformational landscapes from structure-based simulations constrained by HP-NMR data. (a) RMSD versus Q (fraction of native contacts) heat map of the 10 million configurations obtained from the constrained simulations of Snase Δ + PHS at 800 bar and 293 K as described in [22]. (b) Examples of configurations of Snase Δ + PHS from the regions of the heat map in (a), labelled as indicated. (c) Pseudo free energy profile using the number of configurations at all Q-values in (a), –lnN, at atmospheric pressure (blue), 400 bar (purple), 600 bar (pink) and 800 bar (red). (d) Pseudo free energy landscape of pp32 at 293 K and 900 bar in 1.4 M urea obtained from constrained structure-based simulations as described in [105]. Structures represent the centroids of cluster analysis of the conformations in the indicated Q regions. (Online version in colour.)
Figure 8.
Figure 8.
Chemical shift perturbation mapping of Snase Δ + PHS I92A and L125A relative to WT Δ + PHS. (Left) Difference in chemical shift, δΔ, between Snase Δ + PHS L125A and WT Δ + PHS (a) and between Snase Δ + PHS I92A and WT Δ + PHS (b); σ < ΔΔ < 2σ, 2σ < ΔΔ < 3σ and ΔΔ > 3σ are coloured in yellow, orange and red, respectively. Data are taken from [107]. Grey bars are placed in the position of the WT Snase residues that are deleted in the Δ + PHS hyperstable variant. (Online version in colour.)
Figure 9.
Figure 9.
Effect of cavity creating mutations on the pressure response of Snase Δ + PHS. (a) Distribution of residue-specific free energy changes of unfolding, ΔGu, from HSQC detected pressure-induced unfolding for (left) WT Snase Δ + PHS at 1.8 M GuHCl, (centre) Δ + PHS L125A at 0.75 M GuHCl and (right) Δ + PHS I92A at 0.75 M GuHCl. (b) A distribution of residue-specific volume changes of folding, ΔVf, from HSQC detected pressure-induced unfolding for (left) WT Snase Δ + PHS at 1.8 M GuHCl, (centre) Δ + PHS L125A at 0.75 M GuHCl and (right) Δ + PHS I92A at 0.75 M GuHCl. (c) A distribution of residue-specific free energy changes of exchange, ΔGu, (grey bars) and volume changes of exchange, ΔVf, (blue circles) from pressure-dependent H/D exchange experiments for (left) WT Snase Δ + PHS, (centre) Δ + PHS L125A and (right) Δ + PHS I92A. (d) Schematic diagram of the intermediate conformational states for WT Snase, Snase Δ + PHS, Δ + PHS L125A and Δ + PHS I92A. All data are taken from [87]. (Online version in colour.)
Figure 10.
Figure 10.
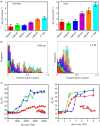
Results of HSQC-detected unfolding of pp32 and capping variants. (a) Fractional contact histograms of WT pp32 at 1.4 M urea and (left) 900 bar and 293 K and (right) 900 bar and 303 K. Inset on left graph, schematic of WT pp32 structure coloured per repeat. All data are taken from [105]. (b) HSQC-detected unfolding of the pp32 YFDL variant (destabilized in the C-terminal capping motif) at 293 K and 0.5 M urea. (Left) Normalized pressure-induced loss of native state amide NH peak intensity for all residues in the pp32 YFDL variant and (right) fractional contact histogram of pp32 YFDL at 950 bar and 0.5 M urea. Contacts are coloured per repeat according to the colour scheme in the inset in (a, left) Data are from [116]. (c) HSQC-detected unfolding of the pp32 ΔN-cap variant (destabilized in the C-terminal capping motif) at 293 K. (Left) Normalized pressure-induced loss of native state amide NH peak intensity for all residues in the pp32 ΔN-cap variant and (right) fractional contact histogram of pp32 ΔN-cap at 850 bar. Contacts are coloured per repeat according to the colour scheme in the inset in (a, left). Data are from [116]. Note that the N-terminal capping motif (yellow) is not present in this variant. (Online version in colour.)
Figure 11.
Figure 11.
Comparison of pressure and urea denaturation of pp32 ΔN-cap. (a) Average free energy of unfolding per repeat, ΔGu, from HSQC detected (left) pressure-induced unfolding and (right) urea-induced unfolding of pp32 ΔN-cap as described in [116]. (b) Fractional contact histograms for pp32 ΔN-cap at (left) 1300 bar and (right) 2 M urea. Contacts are colour coded as in figure 10. (c) Comparison of radius of gyration, Rg, for (left) pressure- and (right) urea-induced unfolding of WT pp32 in 1.4 M urea (blue), pp32 YFDL in 0.5 M urea (green) and pp32 ΔN-cap (red). Rg values were calculated from the pair distribution functions, P(r) as described in [116]. (Inset on left is a bead model of pp32 ΔN-cap at 4.1 kbar and the inset on the right is a model of WT pp32 in 6 M urea obtained as described in [116].) (Online version in colour.)
Figure 12.
Figure 12.
Pressure-jump kinetics on WT Snase. (a) Fluorescence intensity of the single tryptophan of WT Snase (Trp 140) as a function of time after pressure jumps. Top curve is at 930 bar; bottom curve is at 2500 bar. Jumps are approximately 100–150 bar. Adapted from [122]. (b) Pressure chevron plot of the natural logarithm of the relaxation time versus pressure for WT Snase. Circles are values of lnτ obtained from fluorescence-detected p-jumps [122] and triangles are from SAXS detected p-jumps as described in [123]. (c) Volume diagram for the kinetics of WT Snase folding. F is folded state, U is unfolded state and TSE is transition state ensemble. The activation volume for folding, ΔVf, is positive while that of unfolding, ΔVu, is negative. The total difference in volume corresponds to the equilibrium volume change, formula image.
Figure 13.
Figure 13.
Effect of mutations on the volumetric properties of the TSE of Snase variants. (a) Schematic diagram of Snase with positions of mutations to ionizable residues coloured from blue to red according to their effects on the volume of the TSE. Positions in red exhibited very low volume TSEs relative to WT Snase, while those in blue were indistinguishable from WT Snase TSE volume. (b) Pressure chevron plots for WT Snase, Snase Δ + PHS V23 K and Snase Δ + PHS L125 K. Adapted from [102]. (c) Volumetric diagram of the Δ + PHS V23 K variant. (d) Residue specific p-jump relaxation profiles from time-dependent HSQC spectra of Snase Δ + PHS I92A as described in [64]. (e) Average VTSE (ratio of ΔVf/ΔVof) for WT Snase, Snase Δ + PHS and several cavity-containing variants as indicated. The value of VTSE is the average of all the residue-specific values obtained from p-jump HSQC or HMQC SO-FAST experiments as described in [64]. Error bars represent the standard deviation for all residues. (Online version in colour.)
Figure 14.
Figure 14.
Effect of temperature on the volumetric properties of the TSE of the ankyrin repeat domain, Nank. (a) Pressure chevron plot for Nank at 12 and 28°C. Different colour plots correspond to different urea concentrations increasing from red to blue as described in [94]. (b) Temperature dependence of the activation and equilibrium volume changes for Nank as noted. (c) Schematic of the temperature dependence of the relative volumes of the folded (F), unfolded (U) and transition state ensemble (TSE) for Nank. The coefficients of thermal expansion, α, are larger for the unfolded state and the TSE than for the folded state. (Online version in colour.)

References

    1. Englander SW, Mayne L, Kan Z. 2016. Protein folding—how and why: by hydrogen exchange, fragment separation, and mass spectrometry. Annu. Rev. Biophys. 45, 135–152. (10.1146/annurev-biophys-062215-011121) - DOI - PMC - PubMed
    1. Englander SW, Mayne L. 2014. The nature of protein folding pathways. Proc. Natl. Acad. Sci. USA 111, 15 873–15 880. (10.1073/pnas.1411798111) - DOI - PMC - PubMed
    1. Englander SW, Mayne L. 2017. The case for defined protein folding pathways. Proc. Natl. Acad. Sci. USA 114, 8253–8258. (10.1073/pnas.1706196114) - DOI - PMC - PubMed
    1. Gruebele M, Dave K, Sukenik S. 2016. Globular protein folding in vitro and in vivo. Annu. Rev. Biophys. 45, 233–251. (10.1146/annurev-biophys-062215-011236) - DOI - PubMed
    1. Jagannathan B, Marqusee S. 2013. Protein folding and unfolding under force. Biopolymers 99, 860–869. (10.1002/bip.22321) - DOI - PMC - PubMed

LinkOut - more resources