. 2018 Nov 5;217(11):3930-3946.
doi: 10.1083/jcb.201804205. Epub 2018 Oct 3.

Aneuploidy in intestinal stem cells promotes gut dysplasia in Drosophila

Affiliations

Aneuploidy in intestinal stem cells promotes gut dysplasia in Drosophila

Luís Pedro Resende et al. J Cell Biol. .

Abstract

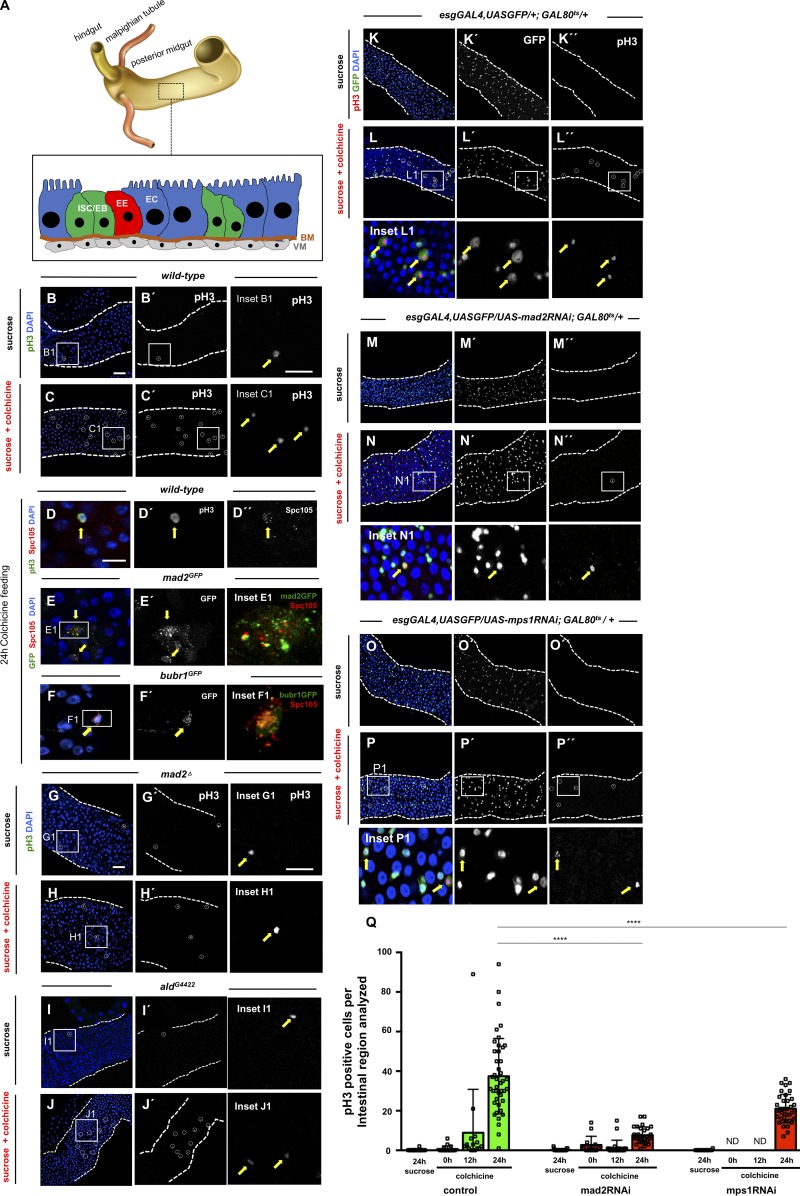
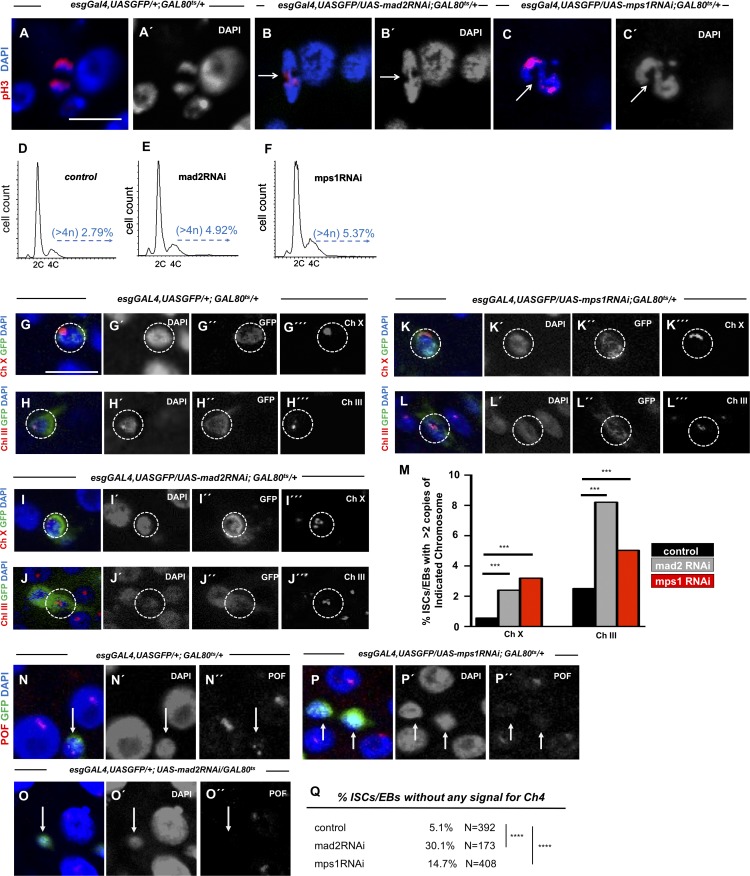
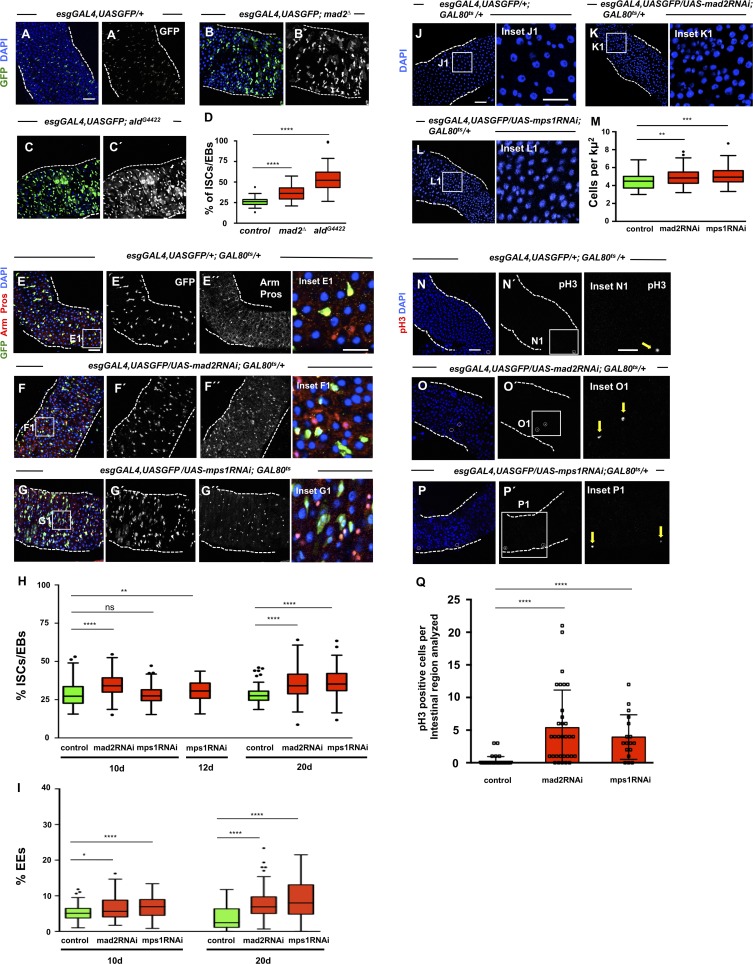
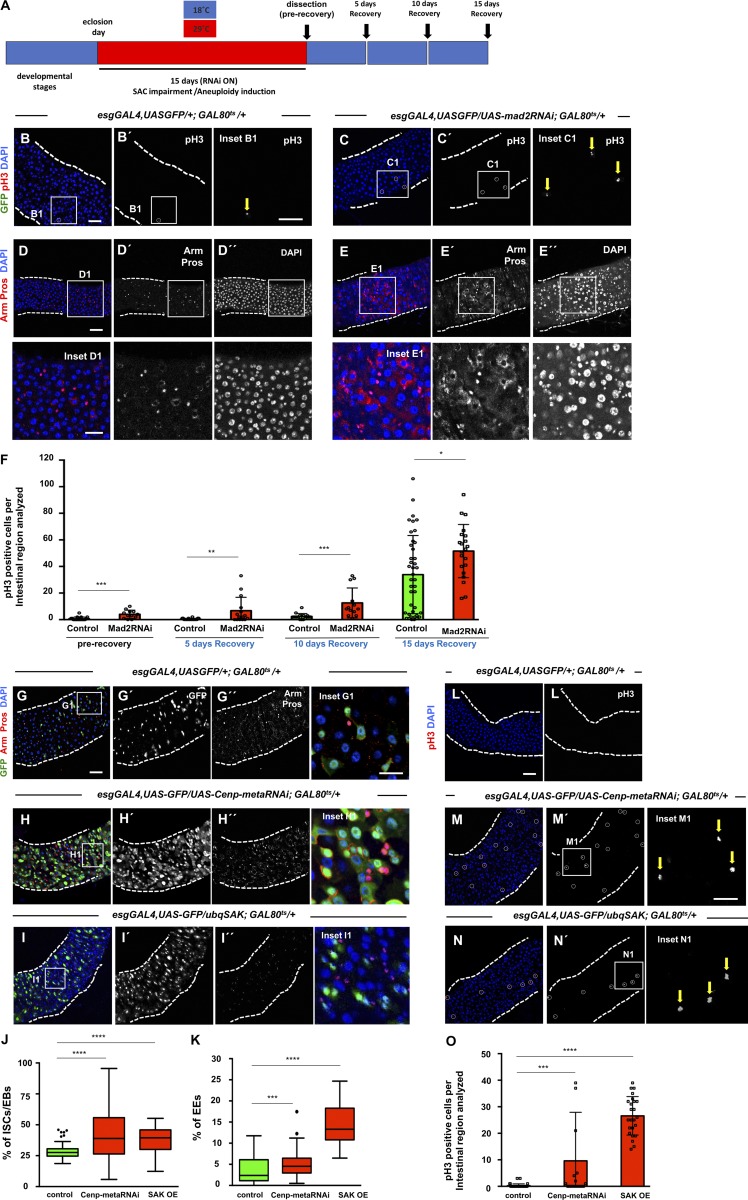
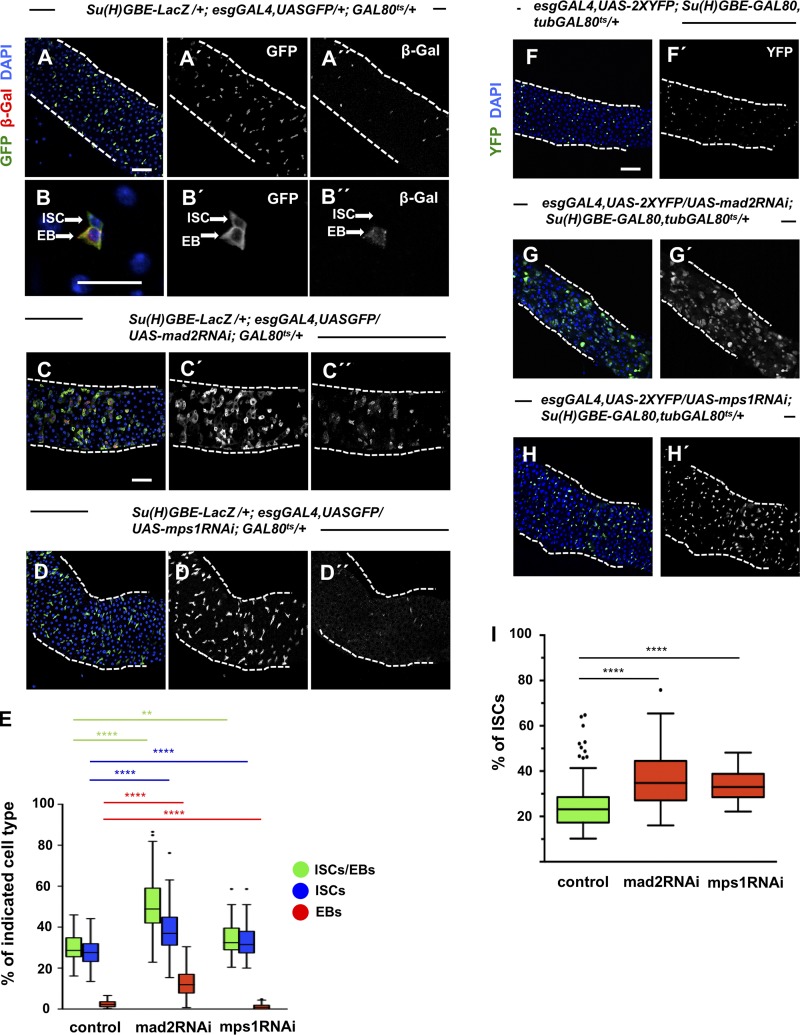
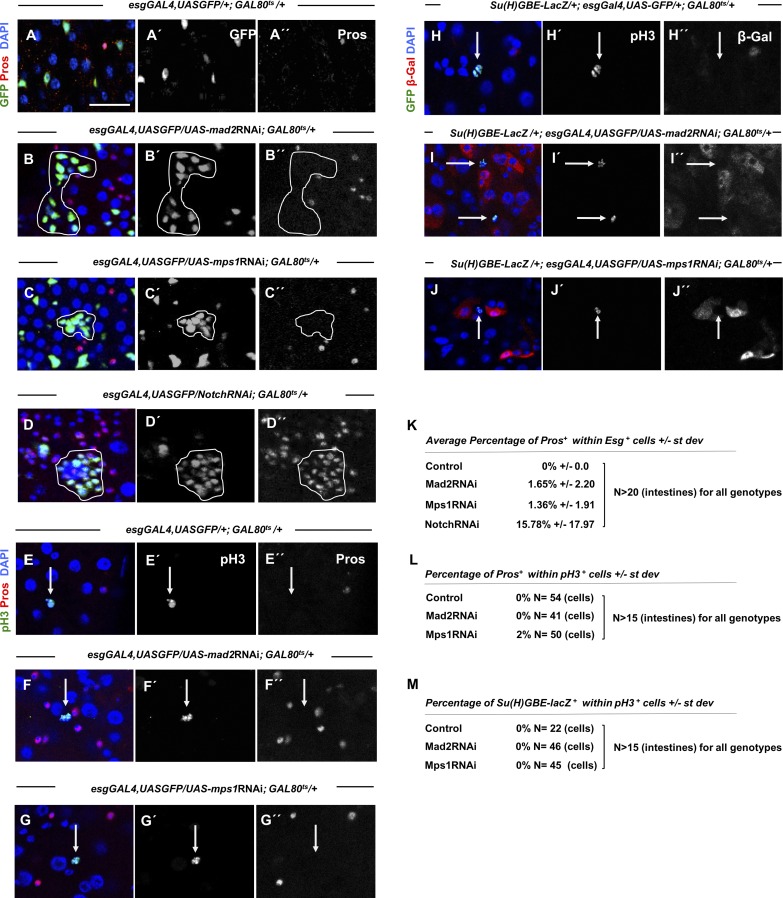
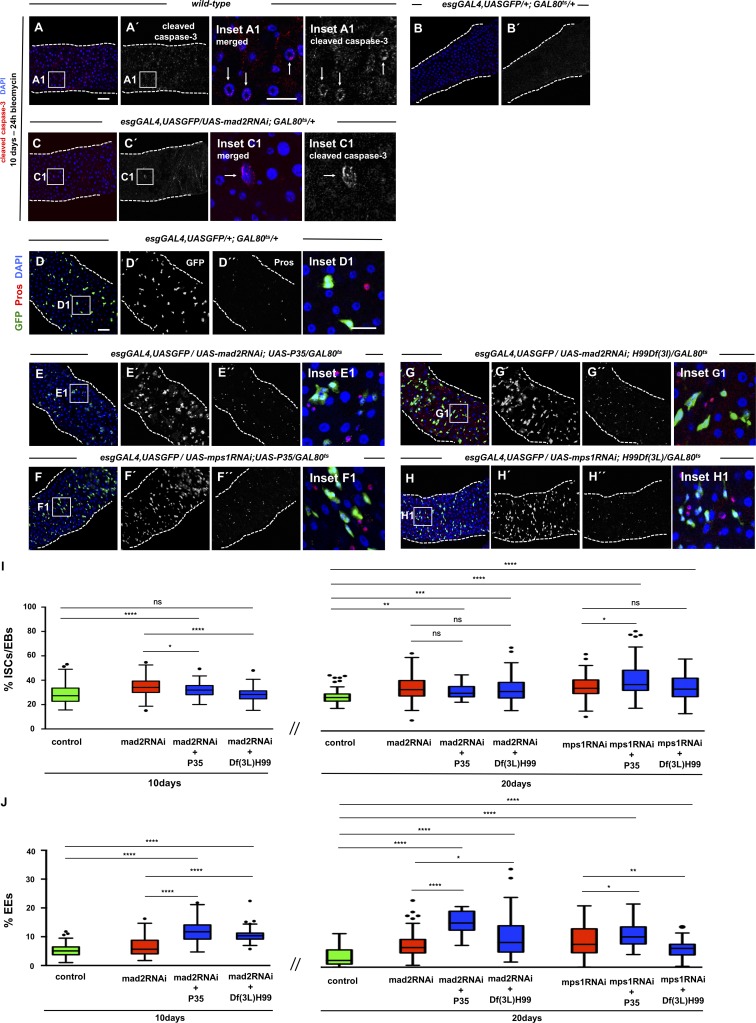
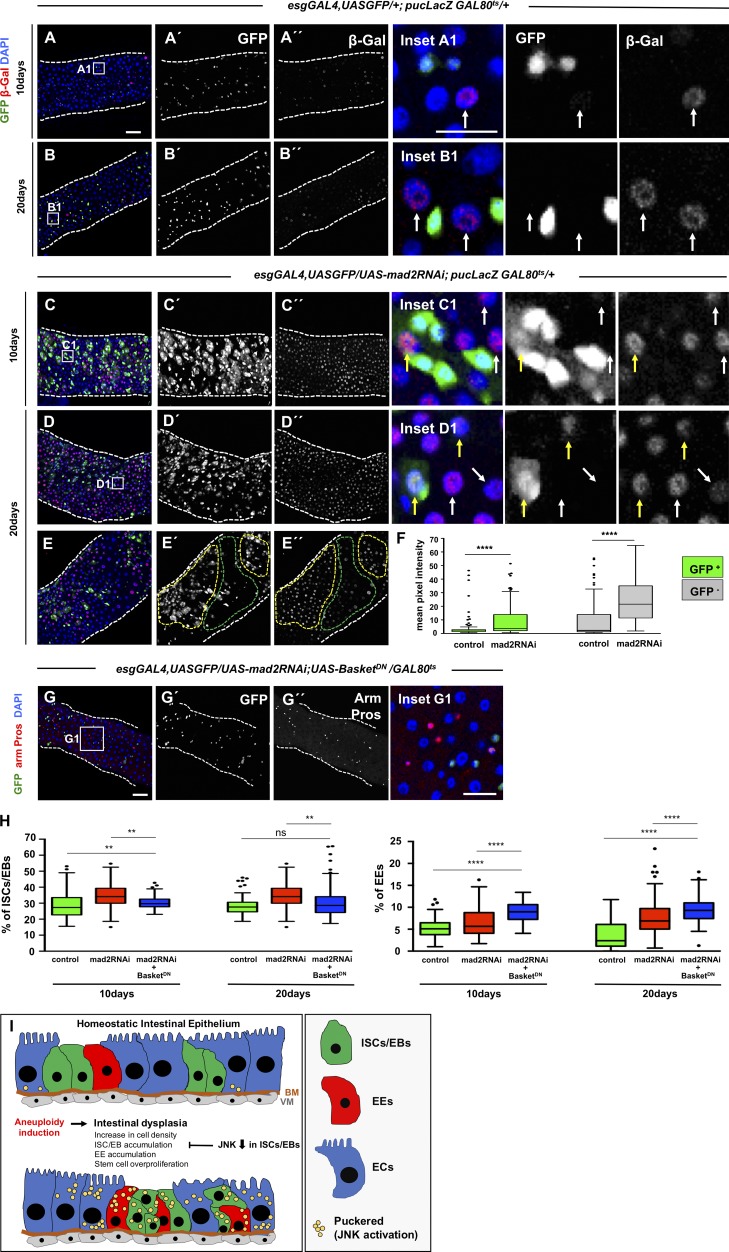
Aneuploidy is associated with different human diseases including cancer. However, different cell types appear to respond differently to aneuploidy, either by promoting tumorigenesis or causing cell death. We set out to study the behavior of adult Drosophila melanogaster intestinal stem cells (ISCs) after induction of chromosome missegregation either by abrogation of the spindle assembly checkpoint or through kinetochore disruption or centrosome amplification. These conditions induce moderate levels of aneuploidy in ISCs, and we find no evidence of apoptosis. Instead, we observe a significant accumulation of ISCs associated with increased stem cell proliferation and an excess of enteroendocrine cells. Moreover, aneuploidy causes up-regulation of the JNK pathway throughout the posterior midgut, and specific inhibition of JNK signaling in ISCs is sufficient to prevent dysplasia. Our findings highlight the importance of understanding the behavior of different stem cell populations to aneuploidy and how these can act as reservoirs for genomic alterations that can lead to tissue pathologies.


Figures

Figure 1.
Figure 1.
ISCs are SAC competent. (A) Anatomical organization of the Drosophila intestine and schematic representation of different cell types of the posterior midgut. ISCs/EBs are the progenitor cells and are found in close association with basement membrane (BM) and visceral muscle (VM). Differentiated cell types include EE cells and absorptive ECs. (B) Mitotic cells labeled with pH3 (B′) in WT 2–5-d-old OreR fed with 5% sucrose control solution during 24 h (white circle and yellow arrow show pH3-positive cell; inset B1). (C) Same as B, but flies were fed with 5% sucrose and 0.2 mg/ml colchicine. Note the increase in pH3-positive cells (compare C′ with B′). (D) Kinetochore marker Spc105 is detected in SAC-arrested ISCs (pH3 positive; yellow arrows). (E and F) mad2 or bubR1 reporter lines show GFP signal in SAC-arrested cells (yellow arrows). (G–J) 2–5-d-old mad2 or mps1 mutants flies fed with the same feeding method as described for WT flies in B and C. (K–P) Mitotic cells labeled with pH3 in intestines from control and flies where indicated RNAi was expressed. Flies were kept at 18°C during development to suppress the GAL4-UAS system and then were shifted to 29°C at eclosion day. After 48 h at 29°C on regular food, flies were shifted to vials with either sucrose or sucrose + colchicine solutions for 24 h. White circles and yellow arrows show pH3-positive cells. Bars: 40 µm (B, C, and G–P); 20 µm (B1 and G1); 10 µm (D–F). (Q) Number of mitotic cells present in first two fields of view of the posterior midgut after the pyloric ring (40× objective) in control, mad2RNAi, and mps1RNAi. Sucrose or colchicine feeding was initiated after flies spent 2 d at 29°C (0 h time point). n > 16 for all genotypes/conditions. ND, not determined; ****, P < 0.0001; Mann–Whitney U test.
Figure 2.
Figure 2.
Induction of aneuploidy in intestinal cells after SAC impairment. (A) Control cell in anaphase. (B and C) Lagging chromosomes/chromatin bridges (white arrows) in dividing cells from 10-d-old mad2RNAi and mps1RNAi flies. (D–F) Examples of FACS profiles of ISCs/EBs from control, mad2RNAi, and mps1RNAi flies. For control versus mad2RNAi, two biological replicates were performed. In both, the percent aneuploidy was higher in the mad2RNAi flies (P < 0.01; Fisher exact t test). For control versus mps1RNAi flies, two biological replicates were performed. In both, the percent aneuploidy was higher in the mps1RNAi (P < 0.01; Fisher exact t test). Average percent aneuploidy ± SD: control, 2.4 ± 0.5; mad2RNAi, 5.4 ± 0.73; mps1RNAi, 7.77 ± 1.1. (G–L) FISH analysis in combination with IF labeling Chromosomes X or III within ISCs/EBs (GFP+/esg+; white circles). Due to somatic chromosome pairing, cells were only scored as aneuploid when more than two FISH signals were observed. (M) Quantification of ISCs/EBs where more than two FISH signals for Chromosome X or III were detected within control, mad2RNAi, and mps1RNAi intestines. n (ISCs/EBs) for controls = 1,161 (Ch III) and 541 (Ch X); n (ISCs/EBs) for mad2RNAi = 841 (Ch III) and 751 (Ch X); n (ISCs/EBs) for mps1RNAi = 936 (Ch III) and 720 (Ch X). (N–P) 15–20-d control, mad2RNAi, and mps1RNAi intestines stained for anti-POF antibody to label the fourth chromosome. Bars, 5 µm. (Q) Percentage of ISCs/EBs where no signal for anti-POF was observed in N–P. N refers to number the ISCs/EBs analyzed in each genotype. ***, P < 0.001; ****, P < 0.0001; Fisher's exact t test.
Figure 3.
Figure 3.
SAC inactivation results in intestinal dysplasia. (A) 2–5-d-old control intestine where ISCs/EBs can be visualized by GFP expression under the control of esgGAL4. DAPI marks cell nuclei. (B and C) 2–5-d-old intestines of homozygous mutants for SAC genes mad2 or mps1. Note accumulation of ISCs/EBs (compare B′ or C′ with A′). (D) Quantification of percent ISCs/EBs (GFP positive) per total cell number in A–C. Tukey boxplots. (E) 20-d-old control intestine where ISCs and EBs are marked based on esg expression (green). EEs can be identified by expression of Pros (nuclear red signal). Arm marks all cell membranes. DAPI marks cell nuclei. (F and G) Intestines where RNAi constructs against SAC genes mad2 or mps1 were expressed under the control of the esgGAL4 promoter during the first 20 d of the adult fly. Note accumulation of ISCs/EBs (compare F′ and G′ with E′ or green cells in the corresponding insets); note also the excess of EEs (compare F′′ and G′′ with E′′ or red nuclear signaling in corresponding insets). (H and I) Quantification of percentage of ISCs/EBs (GFP positive) or EEs (Pros positive) per total cell number in control, mad2RNAi, and mps1RNAi flies at different time points. Tukey boxplots; n = 28 (intestines) for controls at 10 d; n = 22 for mad2RNAi at 10 d; n = 25 for mps1RNAi at 10 d; n = 22 for mps1RNAi at 12 d; n = 21 (intestines) for controls at 20 d; n = 26 for mad2RNAi at 20 d; n = 21 for mps1RNAi at 20 d. (J) 20-d-old control intestine. Cell nuclei are marked by DAPI. (K and L) 20-d-old mad2RNAi and mps1RNAi intestines. Note high cell density (compare K1 or L1 with J1). In control and RNAi conditions, suppression of the GAL4-UAS system was performed during development by using the temperature-sensitive repressor GAL80ts and by raising the flies at 18°C. (M) Quantification of cell densities in J–L. n (intestines) = 20 for controls; n (intestines) = 20 for mad2RNAi; n (intestines) = 18 for mps1RNAi. (N–P) Same genotypes/time points as in E–G or J–L but stained for pH3 to label mitotic cells (white circles or yellow arrows). Bars: 40 µm (main images); 20 µm (insets). (Q) Number of mitotic cells present in the first two fields of view of the posterior midgut after the pyloric ring (40× objective) from situations N–P. *, P < 0.05; **, P < 0.01; ****, P < 0.0001; Mann–Whitney U test. n = 39 flies for controls; n = 32 flies for mad2RNAi; n = 17 flies for mps1RNAi.
Figure 4.
Figure 4.
Aneuploidy promotes dysplasia. (A) Scheme illustrating temperature shifts performed in control and mad2RNAi flies. (B) Example of a 20-d-old control intestine subjected to temperature shifts as described in A (5 d recovery). In the majority of intestines, no GFP-positive cells could be detected (GAL4-UAS OFF). Only in a very small percentage of intestines could a couple of GFP-positive cells sometimes be detected (yellow arrow; inset B1). Cells undergoing proliferation were labeled with pH3 (white circle; inset B1), and cell nuclei with DAPI. (C) Example of a mad2RNAi intestine after 5 d recovery as described in A. (D and E) Intestines from control and mad2RNAi after 10 d recovery. (F) Quantification of mitotic cells before and during recovery. (G) 20-d-old control intestine where ISCs and EBs are marked based on esg expression (green). EEs can be identified by expression of Pros (nuclear red). Arm marks cells membrane, and DAPI marks cell nuclei. (H) Example of an intestine where RNAi construct against cenp-meta was expressed under the control of the esgGAL4 driver during the first 20 d of the adult. (I) Example of a 20-d-old intestine where the protein SAK was constitutively overexpressed (OE). (J and K) Quantification of the percentage of ISCs/EBs (GFP positive) per total cell number or EEs (Pros positive) in situations G–I. Control data are the same as shown in Fig. 3. Tukey boxplots. n (intestines) = 21 flies for control; n (intestines) = 32 flies for cenp-metaRNAi; n (intestines) = 8 for SAK overexpression. (L–N) Same genetic conditions and time point as described for G–I but stained for pH3. Bars: 40 µm (main images); 20 µm (insets). White circles and yellow arrows show pH3-positive cells. (O) Number of mitotic cells present in the first two fields of view of the posterior midgut after the pyloric ring (40× objective) from L–N. Mean ± SD. *, P < 0.05; **, P < 0.01; ***, P < 0.0001; ****, P < 0.0001; Mann–Whitney U test. n (intestines) = 39 flies for control (control data are the same as in Fig. 3); n (intestines) = 18 flies for cenp-metaRNAi; n (intestines) = 24 for SAK overexpression.
Figure 5.
Figure 5.
Aneuploidy causes ISC accumulation. (A and B) Low (A) and high (B) magnifications of a 20-d-old control intestine where ISCs and EBs can be distinguished based on expression of Su(H)GBE-LacZ. esg marks ISCs and EBs, and β-Gal marks EBs. (C and D) Intestines where RNAi constructs against Mad2 or Mps1 were expressed under the control of the esgGAL4 promoter during the first 20 d of the adult and where ISCs and EBs can be distinguished as described in A and B. (E) Quantification of percentage of ISCs/EBs (GFP positive), ISCs (GFP positive/β-Gal negative), and EBs (GFP positive/β-Gal positive) per total cell number (DAPI) in control and SAC loss-of-function situations. n = 25 for controls; n = 25 for mad2RNAi; n = 21 for mps1RNAi (intestines). (F) Control intestine where ISCs can be identified by expression of YFP. (G and H) Intestines where RNAi against Mad2 or Mps1 were expressed specifically in ISCs during the first 20 d after eclosion. Bars: 40 µm (A, C, and F); 10 µm (B). (I) Quantification of ISCs in F–H. Tukey boxplots; **, P < 0.01; ****, P < 0.0001; Mann–Whitney U test. n (intestines) = 19 for control; n (intestines) = 23 for mad2RNAi; n (intestines) = 8 for mps1RNAi.
Figure 6.
Figure 6.
Dysplasia is driven by overproliferative ISCs. (A–D) 10–15-d-old control, mad2RNAi, mps1RNAi, and NotchRNAi intestines where ISCs/EBs and EEs are marked by Esg expression (esgGal4,UASGFP) and Pros (antibody), respectively. Note that in NotchRNAi flies, the dysplastic regions are generally populated by cells that express both markers of ISCs/EBs and EE lineages, in contrast with mad2RNAi and mps1RNAi. Bar, 20 µm. (E–G) 10–15-d-old control, mad2RNAi, and mps1RNAi where mitotic cells are labeled with pH3 and EE cells are marked with Pros. (H–J) 10–15-d-old control, mad2RNAi, and mps1RNAi where mitotic cells are labeled with pH3 and EBs are evident by expression of Su(H)GBE-LacZ. Arrows indicate pH3-positive cells. (K–M) Quantifications of overlap between different indicated cell identity markers or mitotic markers in situations described in A–J.
Figure 7.
Figure 7.
Aneuploidy induction does not result in activation of apoptosis. (A) 10-d-old WT intestine fed 24 h with bleomycin as a positive control for cleaved caspase-3 staining. Many apoptotic cells were detected. Examples are shown in the inset and are indicated by white arrows. (B and C) 10-d-old control and mad2RNAi intestines stained for cleaved caspase-3. No apoptotic cells were found in the control samples. n = 10 intestines. In a total of 17 intestines, apoptotic cells were only found in only two intestines for mad2RNAi (two apoptotic cells in one intestine and three in the other). (D–H) 20-d-old intestines from controls or flies where mad2RNAi or mps1RNAi constructs were expressed in ISCs/EBs; apoptosis was blocked either in ISCs/EBs specifically or in all cell types as indicated in respective genotypes. Bars: 40 µm (main images); 20 µm (insets). (I and J) Quantification of ISCs/EBs or EEs in conditions described in D–H. Control data are the same as shown in Fig. 3. Control, mad2RNAi, and mps1RNAi data are the same as shown in Fig. 2. n = 20 for 10-d mad2RNAi + P35; n = 22 for 10-d mad2RNAi + H99Df(3L); n = 10 for 20-d mad2RNAi + P35; n = 16 for 20-d mad2RNAi + H99Df(3L); n = 12 for 20-d mps1RNAi + P35; n = 16 for 20-d mps1RNAi + H99Df(3L). Tukey boxplots; *, P < 0.05; **, P < 0.01; ***, P < 0.001; ****, P < 0.0001; Mann–Whitney U test.
Figure 8.
Figure 8.
JNK pathway modulates intestinal dysplasia. (A and B) 10- and 20-d-old control intestines where pucLacZ serves as readout of the activation status of JNK pathway. pucLacZ-positive cells were found in low intensity and in very reduced numbers (white arrows in the insets show examples of pucLacZ-positive cells). (C and D) 10- and 20-d-old intestines where mad2RNAi was expressed and where a strong up-regulation of pucLacZ can be noted (compare C’’ and D’’ with A’’ and B’’). Up-regulation was found in both progenitor cells (Esg positive; yellow arrows in the insets) and differentiated cells (Esg negative; white arrows in the insets). (E) 20-d-old intestine where mad2RNAi was expressed. Note that pucLacZ is up-regulated within midgut regions where dysplasia is more pronounced (yellow-dashed areas) as opposed to regions within the same gut where dysplasia is absent or less pronounced (green-dashed areas). (F) Quantification of pucLacZ signal intensity in ISCs/EBs (Esg positive) and differentiated cells (Esg negative) at 20 d. (G) 20-d-old intestine where mad2RNAi was coexpressed with BskDN in ISCs/EBs. Note the absence of dysplasia. Compare with control and mad2RNAi in Fig. 2. Bars: 40 µm (main images); 20 µm (insets). (H) Quantification of the percentage ISCs/EBs and EEs in control, mad2RNAi, and mad2RNAi + BasketDN. Control and mad2RNAi data are the same as shown in Fig. 3. n = 14 for 10-d mad2RNAi + basketDN; n = 21 for 20-d mad2RNAi + basketDN. Tukey boxplots; **, P < 0.01; ****, P < 0.0001; Mann-Whitney U test. (I) Graphical abstract of results gathered on the impact of aneuploidy induction in the intestine epithelium. BM, basement membrane; VM, visceral muscle.

Similar articles

Cited by

References

    1. Amcheslavsky A., Jiang J., and Ip Y.T.. 2009. Tissue damage-induced intestinal stem cell division in Drosophila. Cell Stem Cell. 4:49–61. 10.1016/j.stem.2008.10.016 - DOI - PMC - PubMed
    1. Amcheslavsky A., Song W., Li Q., Nie Y., Bragatto I., Ferrandon D., Perrimon N., and Ip Y.T.. 2014. Enteroendocrine cells support intestinal stem-cell-mediated homeostasis in Drosophila. Cell Reports. 9:32–39. 10.1016/j.celrep.2014.08.052 - DOI - PMC - PubMed
    1. Apidianakis Y., and Rahme L.G.. 2011. Drosophila melanogaster as a model for human intestinal infection and pathology. Dis. Model. Mech. 4:21–30. 10.1242/dmm.003970 - DOI - PMC - PubMed
    1. Basto R., Brunk K., Vinadogrova T., Peel N., Franz A., Khodjakov A., and Raff J.W.. 2008. Centrosome amplification can initiate tumorigenesis in flies. Cell. 133:1032–1042. 10.1016/j.cell.2008.05.039 - DOI - PMC - PubMed
    1. Biteau B., Hochmuth C.E., and Jasper H.. 2008. JNK activity in somatic stem cells causes loss of tissue homeostasis in the aging Drosophila gut. Cell Stem Cell. 3:442–455. 10.1016/j.stem.2008.07.024 - DOI - PMC - PubMed

Publication types

LinkOut - more resources