. 2018 Oct 3;9(10):1014.
doi: 10.1038/s41419-018-1068-x.

LncRNA-MEG3 inhibits activation of hepatic stellate cells through SMO protein and miR-212

Affiliations

LncRNA-MEG3 inhibits activation of hepatic stellate cells through SMO protein and miR-212

Fujun Yu et al. Cell Death Dis. .

Erratum in

Abstract

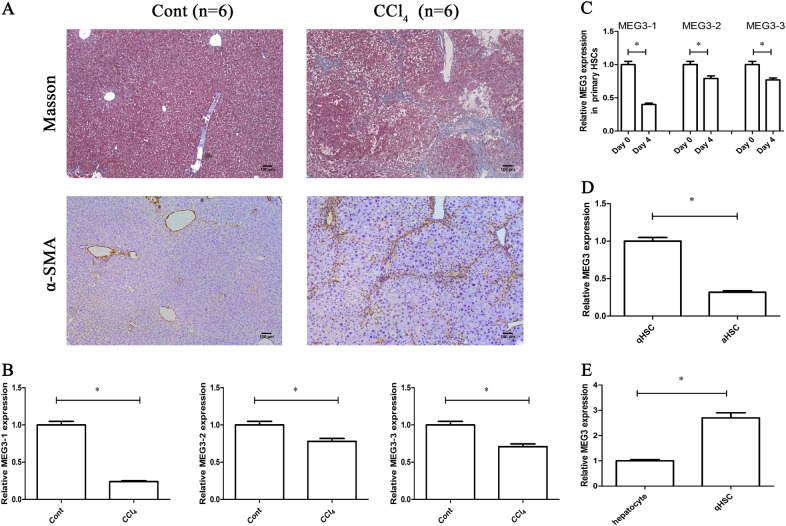
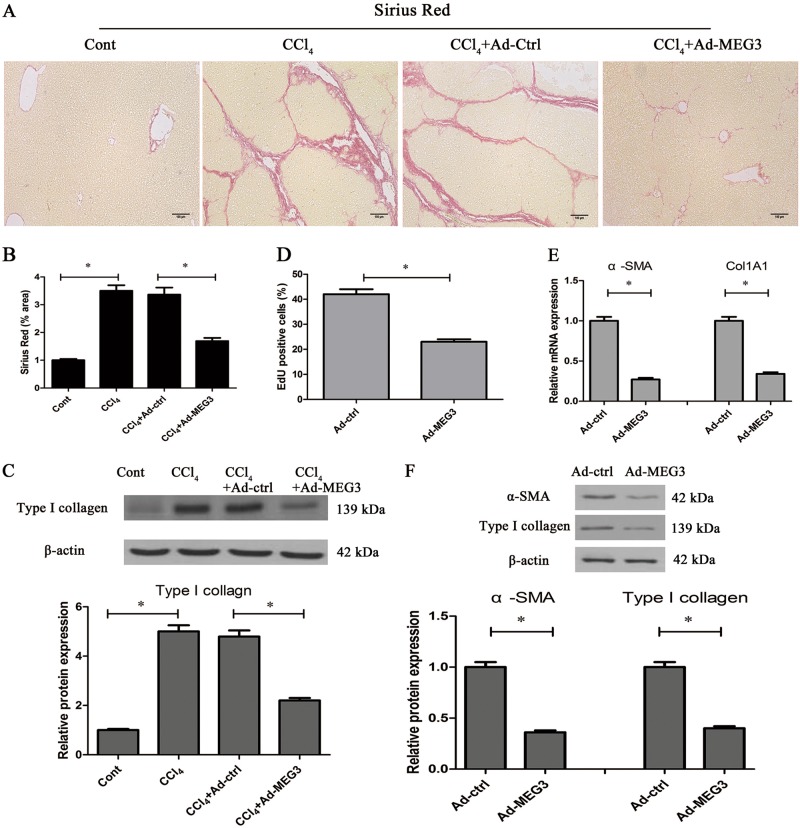
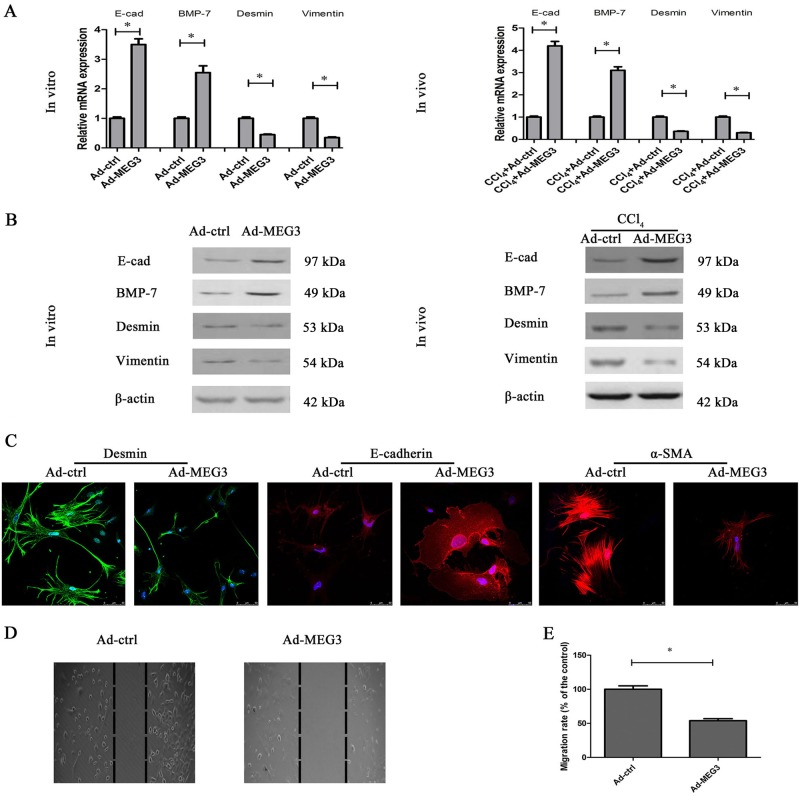
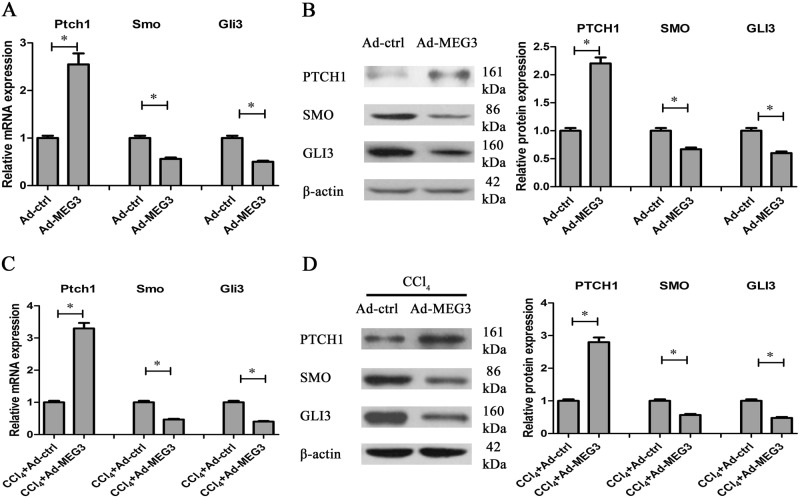
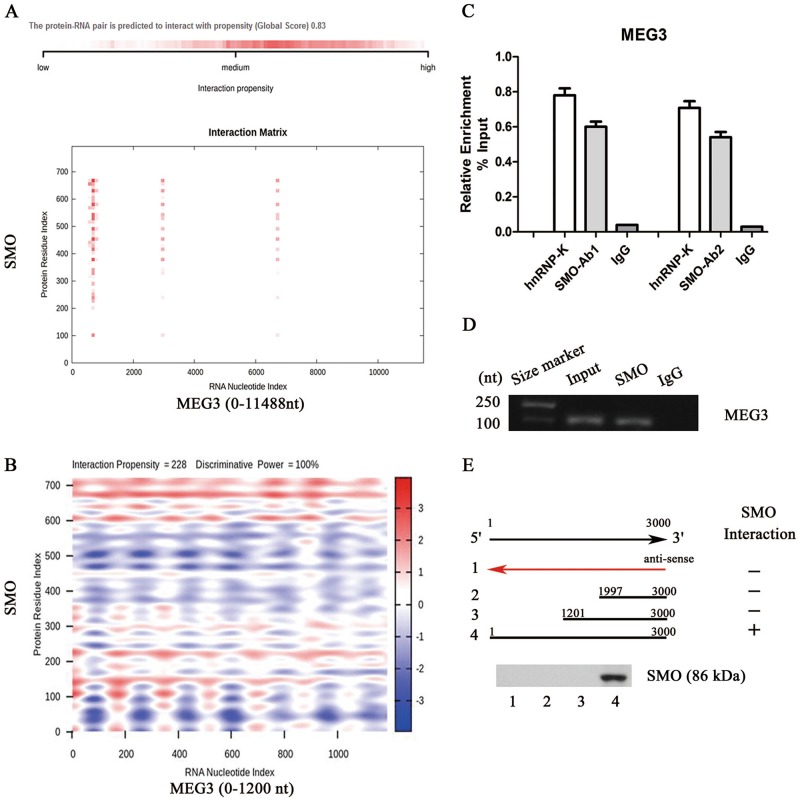
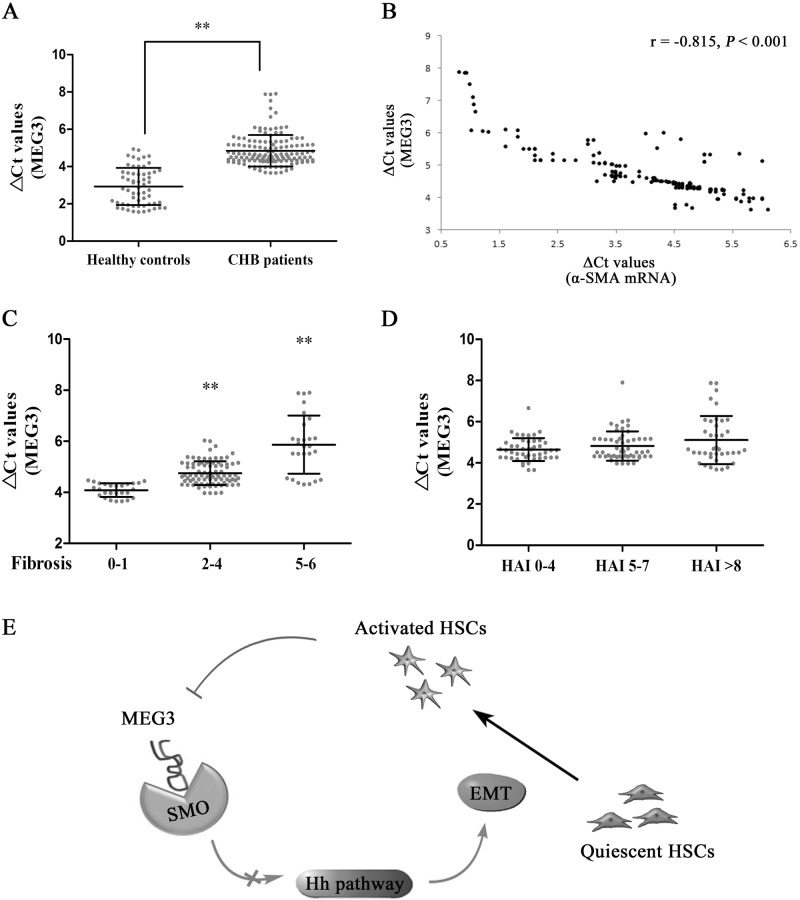
Activation of hepatic stellate cells (HSCs), a pivotal event in liver fibrosis, is considered as an epithelial-mesenchymal transition (EMT) process. Deregulation of long noncoding RNAs (lncRNAs) has been reported to be involved in a series of human diseases. LncRNA-maternally expressed gene 3 (MEG3) functions as a tumor suppressor in cancers and has been shown to play a vital role in EMT process. However, the biological role of MEG3 in liver fibrosis is largely unknown. In this study, MEG3 was reduced in vivo and in vitro during liver fibrosis. Restoring of MEG3 expression led to the suppression of liver fibrosis, with a reduction in α-SMA and type I collagen. Notably, MEG3 overexpression inhibited HSC activation through EMT, associated with an increase in epithelial markers and a reduction in mesenchymal markers. Further studies showed that Hedgehog (Hh) pathway-mediated EMT process was involved in the effects of MEG3 on HSC activation. Smoothened (SMO) is a member of Hh pathway. Using bioinformatic analysis, an interaction between MEG3 and SMO protein was predicted. This interaction was confirmed by the results of RNA immunoprecipitation and deletion-mapping analysis. Furthermore, MEG3 was confirmed as a target of microRNA-212 (miR-212). miR-212 was partly responsible for the effects of MEG3 on EMT process. Interestingly, MEG3 was also reduced in chronic hepatitis B (CHB) patients with liver fibrosis when compared with healthy controls. MEG3 negatively correlated with fibrosis stage in CHB patients. In conclusion, we demonstrate that MEG3 inhibits Hh-mediated EMT process in liver fibrosis via SMO protein and miR-212.


Conflict of interest statement

The authors declare that they have no conflict of interest.

Figures

Fig. 1
Fig. 1. Downregulation of MEG3 in liver fibrosis.
a Collagen and α-SMA were analyzed in CCl4 mice by Masson staining and immunohistochemistry, respectively. Scale bar, 100 μm. b MEG3-1, MEG3-2, and MEG3-3 expressions were detected by qRT-PCR in CCl4 mice. c Expressions of MEG3-1, MEG3-2, and MEG3-3 were analyzed in primary HSCs at Day 0 and Day 4. Primary HSCs were isolated from the livers of healthy mice. d MEG3 was analyzed in primary HSCs isolated from oil- or CCl4-treated mice. e MEG3 was analyzed in primary HSCs and primary hepatocytes from the livers of healthy mice. *P < 0.05
Fig. 2
Fig. 2. Upregulation of MEG3 inhibits liver fibrosis in vivo and in vitro.
a, b Collagen deposits were analyzed by Sirius Red staining. n = 6 mice per group. Scale bar, 100 μm. c Type I collagen level was suppressed by MEG3 overexpression in vivo. d HSC proliferation was analyzed by EdU assays in primary HSCs at Day 0 after Ad-MEG3 treatment for 48 h. The mRNA (e) and protein (f) expressions of α-SMA and Col1A1 were analyzed in primary HSCs at Day 0 after Ad-MEG3 treatment for 48 h. *P < 0.05
Fig. 3
Fig. 3. Effects of MEG3 overexpression on EMT process.
Primary HSCs at Day 0 were transduced with Ad-MEG3 for 48 h. The mRNA (a) and protein (b) expressions of E-cadherin, BMP-7, Desmin and Vimenin were detected in MEG3 over-expressing HSCs (in vitro) and in the livers of CCl4 mice after Ad-MEG3 treatment (in vivo). c Immunofluorescence staining for Desmin (green), E-cadherin (red), and α-SMA (red) were evaluated by confocal laser microscopy. DAPI stained nuclei blue. Scale bar, 50 μm. d Cell migration was examined by wound healing. Dashed line indicates edge of cell migration. e Cell migration was evaluated by transwell migration assay. Five fields of migrated cells in the lower side of transwell were counted with a microscope at ×100. *P < 0.05
Fig. 4
Fig. 4. Effects of MEG3 on Hh pathway.
Primary 4-day-old HSCs were transduced with Ad-MEG3 for 48 h. a In HSCs, Ptch1 mRNA was enhanced by MEG3, whereas the mRNA expressions of Smo and Gli3 were reduced by MEG3. b In HSCs, MEG3 induced an increase in Ptch1 protein and a reduction in the protein expressions of Smo and Gli3. c In CCl4 mice, Ad-MEG3 treatment enhanced Ptch1 mRNA and reduced the mRNA expressions of Smo and Gli3. d In CCl4 mice, Ad-MEG3 treatment resulted in an increase in Ptch1 protein and a decrease in the protein expressions of Smo and Gli3. *P < 0.05
Fig. 5
Fig. 5. MEG3 physically interacts with SMO protein.
a The overall interaction propensity of MEG3 and SMO protein was predicted by catRAPID. b Predicted interaction between MEG3 (nucleotide positions 0–1200 nt) and SMO protein (amino acid residues 0–720). c RIP experiments were performed using SMO antibody in primary HSCs at Day 0. qRT-PCR was performed to detect pulled-down MEG3. hnRNP-K antibody and IgG were used as positive and negative controls, respectively. d SMO asscociated MEG3 was detected by regular RT-PCR. e Mapping the SMO interaction region of MEG3. Biotinylated RNAs corresponding to different fragments of MEG3 or its antisense sequences (red line) were co-incubated with cell lysates and associated SMO proteins were detected by immunoblotting
Fig. 6
Fig. 6. Downregulation of MEG3 expression in liver correlates with fibrosis stage in CHB patients.
a Liver MEG3 was downregulated in CHB patients. b Negative correlation between transcriptional level of α-SMA and MEG3 in fibrotic human liver tissues. Pearson’s correlation analysis was used for statistical analysis. c △Ct values of MEG3 levels in CHB patients with fibrosis score 0–1, fibrosis score 2–4, and fibrosis score 5–6. d △Ct values of MEG3 levels in CHB patients with HAI score 0–4, HAI score 5–7, and HAI score >8. e Schematic representation of a working model by which MEG3 suppresses the activation of Hh pathway via binding to Smo. The △Ct method was used to calculate MEG3 expression, which was normalized to GAPDH, and smaller ΔCt value indicated higher expression

Similar articles

Cited by

References

    1. Kim Y, et al. Temporal trends in population-based death rates associated with chronic liver disease and liver cancer in the United States over the last 30 years. Cancer. 2014;120:3058–3065. doi: 10.1002/cncr.28843. - DOI - PMC - PubMed
    1. Bataller R, Brenner DA. Liver fibrosis. J. Clin. Invest. 2005;115:209–218. doi: 10.1172/JCI24282. - DOI - PMC - PubMed
    1. Hernandez-Gea V, Friedman SL. Pathogenesis of liver fibrosis. Annu. Rev. Pathol. 2011;6:425–456. doi: 10.1146/annurev-pathol-011110-130246. - DOI - PubMed
    1. Tu X, et al. MicroRNA-101 suppresses liver fibrosis by targeting the TGFbeta signalling pathway. J. Pathol. 2014;234:46–59. doi: 10.1002/path.4373. - DOI - PubMed
    1. Choi SS, et al. Hedgehog pathway activation and epithelial-to-mesenchymal transitions during myofibroblastic transformation of rat hepatic cells in culture and cirrhosis. Am. J. Physiol. Gastrointest. Liver Physiol. 2009;297:G1093–G1106. doi: 10.1152/ajpgi.00292.2009. - DOI - PMC - PubMed

Publication types