. 2019 Sep;24(9):1383-1397.
doi: 10.1038/s41380-018-0258-3. Epub 2018 Oct 3.

Integrative approach to sporadic Alzheimer's disease: deficiency of TYROBP in a tauopathy mouse model reduces C1q and normalizes clinical phenotype while increasing spread and state of phosphorylation of tau

Affiliations

Integrative approach to sporadic Alzheimer's disease: deficiency of TYROBP in a tauopathy mouse model reduces C1q and normalizes clinical phenotype while increasing spread and state of phosphorylation of tau

Mickael Audrain et al. Mol Psychiatry. 2019 Sep.

Abstract

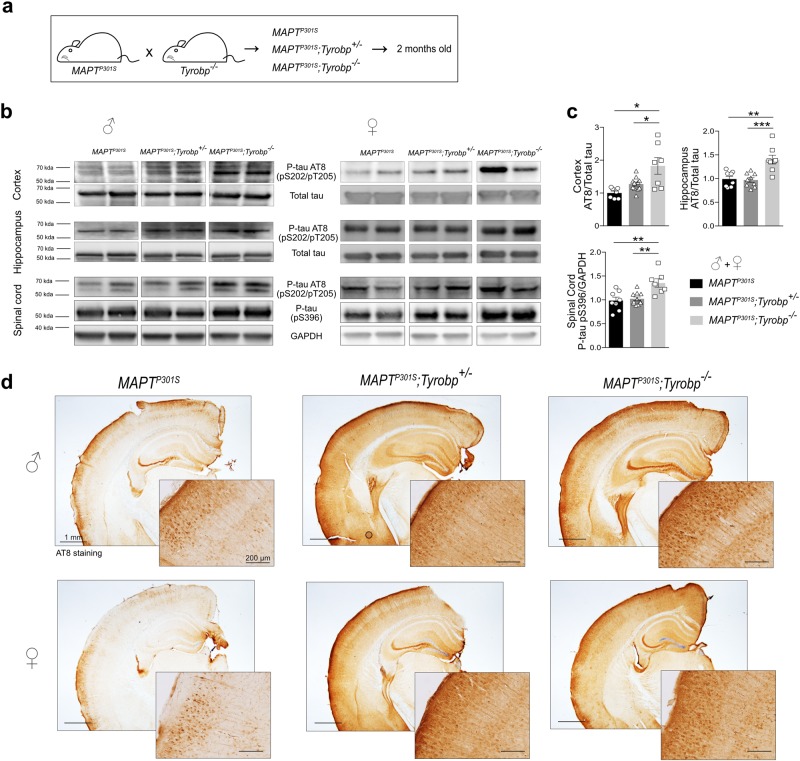
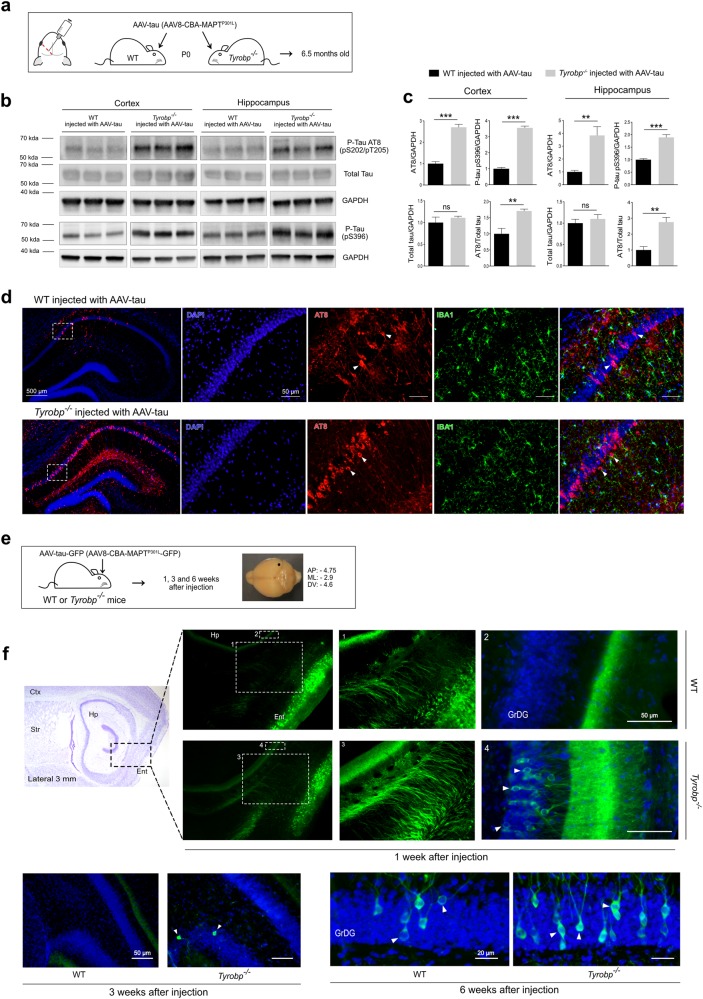
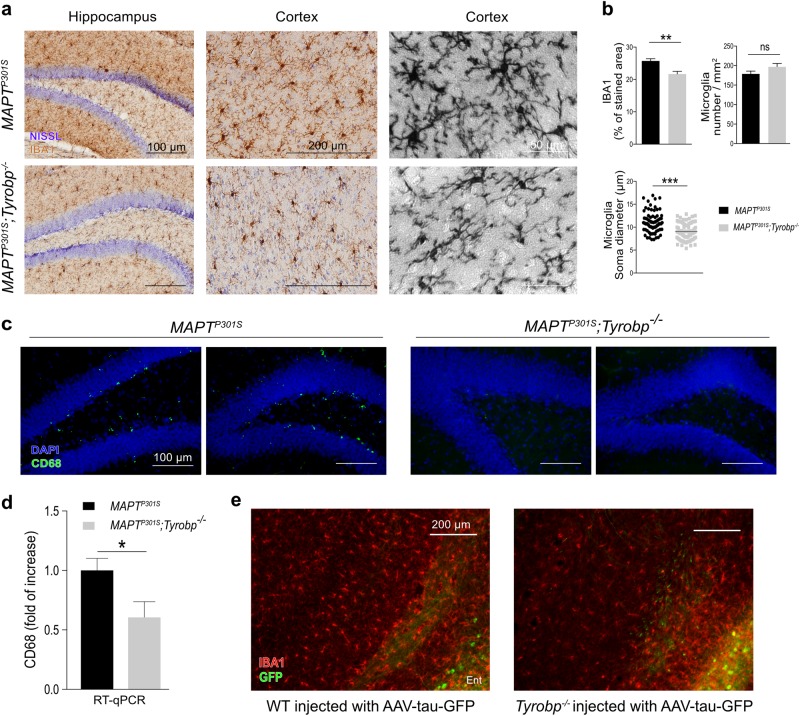
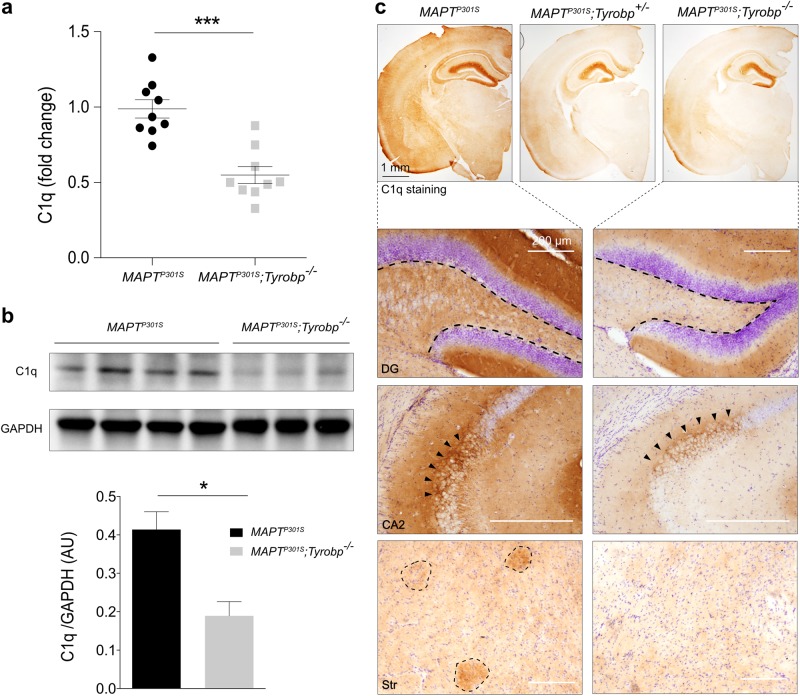
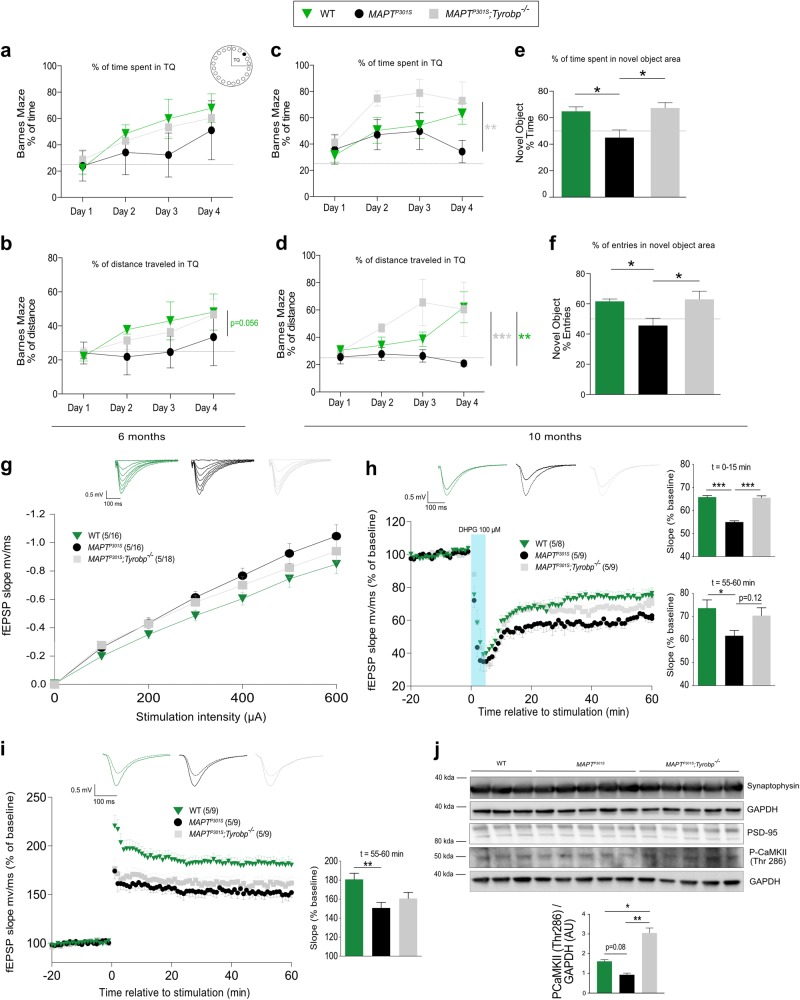
TYROBP/DAP12 forms complexes with ectodomains of immune receptors (TREM2, SIRPβ1, CR3) associated with Alzheimer's disease (AD) and is a network hub and driver in the complement subnetwork identified by multi-scale gene network studies of postmortem human AD brain. Using transgenic or viral approaches, we characterized in mice the effects of TYROBP deficiency on the phenotypic and pathological evolution of tauopathy. Biomarkers usually associated with worsening clinical phenotype (i.e., hyperphosphorylation and increased tauopathy spreading) were unexpectedly increased in MAPTP301S;Tyrobp-/- mice despite the improved learning behavior and synaptic function relative to controls with normal levels of TYROBP. Notably, levels of complement cascade initiator C1q were reduced in MAPTP301S;Tyrobp-/- mice, consistent with the prediction that C1q reduction exerts a neuroprotective effect. These observations suggest a model wherein TYROBP-KO-(knock-out)-associated reduction in C1q is associated with normalized learning behavior and electrophysiological properties in tauopathy model mice despite a paradoxical evolution of biomarker signatures usually associated with neurological decline.


Conflict of interest statement

The authors declare that they have no conflict of interest.

Figures

Fig. 1
Fig. 1
TYROBP deficiency rapidly increases phosphorylated tau levels in a MAPTP301S transgenic mouse model of tauopathy. a MAPTP301S mice were crossed with Tyrobp-/- mice, yielding progeny with genotypes of: (1) MAPTP301S mice expressing wild-type TYROBP (abbreviated MAPTP301S); (2) MAPTP301S mice heterozygous for Tyrobp knock-out (abbreviated MAPTP301S;Tyrobp+/-); (3) MAPTP301S mice homozygous for Tyrobp knock-out (abbreviated MAPTP301S;Tyrobp-/-). Male and female mice (2 months of age) were used for this experiment. b Representative western blots of tissues from mice of the indicated genotype were performed using antibodies as indicated: antibody AT8 (detects paired helical filament epitopes of tau phosphorylated at residues serine 202 and/or threonine 205); antibody anti-tau (phospho S396) (detects tau phosphorylated at residue serine 396); antibody T46 (detects total tau); anti-GAPDH. Extracts from cortex, hippocampus and spinal cord from male and female mice of the indicated genotypes were studied. Full-length blots are presented in Supplementary Figure 2. c Densitometric analyses of western blots standardized to total tau or GAPDH. n = 7 (MAPTP301S), n = 11 (MAPTP301S;Tyrobp+/-) or n = 7 (MAPTP301S;Tyrobp-/-) for extracts from cortex; n = 8 (MAPTP301S), n = 9 (MAPTP301S;Tyrobp+/-) or n = 8 (MAPTP301S;Tyrobp-/-) for extracts from hippocampus; n = 8 (MAPTP301S), n = 11 (MAPTP301S;Tyrobp+/-) or n = 7 (MAPTP301S;Tyrobp-/-) for extracts from spinal cord. Material from male and female mice was pooled for analysis. d Representative images of immunohistochemistry with antibody AT8. Hemibrain scale bar = 1 mm; high magnification scale bar = 200 μm. Error bars represent means ± SEM. Statistical analyses were performed using one-way ANOVA followed by Tukey’s post-hoc test, *p < 0.05; **p < 0.01; ***p < 0.001
Fig. 2
Fig. 2
TYROBP deficiency promotes tau phosphorylation and spread in AAV-tau-based mouse models of tauopathy. a Wild-type or Tyrobp-/- P0 pups received intracerebroventricular injections of AAV8-TauP301L (designated AAV-tau) using a chicken β-actin (CBA) promoter. Brains were examined at age 6.5 months. b Representative western blots of extracts from cortical and hippocampal regions of wild-type (WT) or Tyrobp-/- mice injected with AAV-tau using antibodies as indicated: antibody AT8 (detects paired helical filament epitopes of tau phosphorylated at residues serine 202 and/or threonine 205); antibody anti-tau (phospho S396) (detects tau phosphorylated at residue serine 396); antibody T46 (detects total tau); anti-GAPDH. Full-length blots are presented in Supplementary Figure 2. c Densitometric analyses of P-tau western blots standardized to GAPDH or total tau. n = 5 (WT and Tyrobp-/-) for extracts from hippocampus and n = 4 (WT) or n = 5 (Tyrobp-/-) for extracts from cortex. Error bars represent means ± SEM. Both males and females were used, and analysis was performed on combined results. Statistical analyses were performed using a Student’s t-test, **p < 0.01; ***p < 0.001; ns nonsignificant. d High magnification of coronal sections of hippocampi showing increased AT8 staining in Tyrobp-/- mice injected with AAV-tau. Scale bar: hippocampus = 500 μm and high magnification = 5 μm. e AAV8-TauP301L-GFP (designated AAV-tau-GFP) was injected in the medial entorhinal cortex to study the spread of tau from this structure to the hippocampus. AP anteroposterior, ML mediolateral, DV dorsoventral. The perforant pathway connecting these two regions is implicated in this spread, although the diffuseness of the immunoreactivity raises the possibility that spread may occur via the interstitium in addition to (or instead of) via neuronal uptake and transneuronal propagation along the classical neuroanatomic pathway. f Wild-type or Tyrobp-/- mice were injected with AAV-tau-GFP at 4 months of age, and brains were examined at 1, 3 or 6 weeks after injection (n = 3 per group). Males and females were used for experiments, and results were combined for analysis. Ctx cortex, Str striatum, Hp hippocampus, Ent entorhinal cortex, GrDG granule cell layer of the dentate gyrus
Fig. 3
Fig. 3
TYROBP deficiency alters microglia phenotype. a Representative images of anti-Iba1 DAB immunohistochemistry in 4-month-old MAPTP301S mice with (top) and without (bottom) TYROBP. Scale bars = 100, 200 and 50 μm, respectively. b Top left panel: quantification of IBA1 immunoreactivity in cortical areas (n = 4 mice per group with an average of 4–5 slices per mouse). Top right panel: average microglia density (cells/mm2; n = 4 mice per group with an average of 4–5 slices per mouse). Bottom panel: diameter of microglial soma in cortex. n = 20 microglia per mouse and area with n = 4 (MAPTP301S) or n = 5 (MAPTP301S;Tyrobp-/-) mice per group. c Representative images of anti-CD68 immunohistochemistry in the hippocampus of the same groups as in Fig. 3a. Scale bar = 100 μm. d RT-qPCR of CD68 mRNA in the prefrontal cortex in the same mice as in Fig. 3a with n = 4 mice per group. e Representative images of immunohistochemistry with anti-Iba1 antibody in WT or Tyrobp-null mice injected with AAV-tau-GFP in the medial entorhinal cortex (see Fig. 2 and Supplementary Figure 3). Scale bar = 200 μm. Error bars represent means ± SEM. Males and females were used for experiments, and results were combined for analysis. Statistical analyses were performed using a Student’s t-test, *p < 0.05; **p < 0.01; ***p < 0.001
Fig. 4
Fig. 4
TYROBP deficiency is associated with decreased C1q RNA and protein levels. a RT-qPCR analysis for C1q in MAPTP301S mice with normal or absent TYROBP. Assay was performed on prefrontal cortex samples from males and females. n = 9 mice per group. b Western blot and densitometric analysis of C1q protein in cortical samples. n = 4 (MAPTP301S) or n = 3 (MAPTP301S;Tyrobp-/-) mice per group. c Representative images of anti-C1q immunohistochemistry, showing intense immunoreactivity in cells of the hippocampus and in a nerve terminal-like pattern in the dentate gyrus (DG) and in region CA2. C1q-immunopositive patches are visualized in the cortex and striatum. Scale bar = 200 μm. Immunostaining intensity in all regions is decreased in the indicated regions of Tyrobp-/- mice. Males and females (4 months of age) were used for experiments, and results were combined for analysis. Error bars represent means ± SEM. Statistical analyses were performed using a Student’s t-test, *p < 0.05; ***p < 0.001
Fig. 5
Fig. 5
TYROBP deficiency enhances Barnes Maze and Novel Object Recognition performances and reduces synaptic impairments. a, b Wild-type and MAPTP301S mice with and without knock-out of Tyrobp were tested at 6 months of age in the Barnes Maze. Training was performed on 4 days with two trials per day, and the percentage of time (a) or distance (b) spent in the target quadrant (TQ) containing the entry for the escape zone is located were measured. c, d Barnes Maze testing was performed in the same cohort at 10 months of age. e, f The same mice used in Figs. 5a–d were tested with the Novel Object Recognition task at 10 months of age. The percentage of time spent in the novel object area (e), as well as the percentage of entries into the novel object area (f) were measured. The dotted lines represent 25 and 50% for Figs. 5 a–d, e–f, respectively. n = 6 (WT), n = 7 (MAPTP301S) or n = 7 (MAPTP301S;Tyrobp-/-) mice per group. Error bars represent the means ± SEM. A two-way ANOVA corrected for multiple comparisons by a Tukey’s post-hoc test was used for Figs. 5a–d. A one-way ANOVA followed by a Tukey’s post-hoc test was used for Figs. 5e, f, *p < 0.05; **p < 0.01; ***p < 0.001. Males and females were used for experiments, and results were combined for analysis. g Input–output relationship measuring basal synaptic function in 11-month-old wild-type (WT; n = 5 mice; 16 recordings), MAPTP301S (n = 5; 16 recordings) and MAPTP301S;Tyrobp-/- (n = 5 mice; 18 recordings) mice. h Long-term depression (LTD) was induced using (RS)-3,5-dihydroxyphenylglyine (DHPG) in mice of the same genotype series described above: WT (n = 5 mice; 8 recordings), MAPTP301S (n = 5 mice; 9 recordings) and MAPTP301S;Tyrobp-/- (n = 5 mice; 9 recordings) mice. Mean values for the first 15’ after DHPG induction or for the last 5’ after DHPG induction are presented in the panels on the right side of the figure. i Synaptically induced long-term potentiation (LTP) over 60 min was induced by high-frequency stimulation in mice of the same genotype series described above: WT (n = 5 mice; 9 recordings), MAPTP301S (n = 5; 9 recordings) and MAPTP301S;Tyrobp-/- (n = 5 mice; 9 recordings) mice. For panels g-i, representative traces are shown on the top. j Western blots for synaptophysin, calcium/calmodulin-dependent protein kinase II (CaMKII) phosphorylated on threonine 286, PSD-95 and GAPDH were performed on extracts of prefrontal cortex from the same cohorts: WT (n = 3), MAPTP301S (n = 5) and MAPTP301S;Tyrobp-/- (n = 5). Extracts were prepared from samples of prefrontal cortex removed prior to slicing for the electrophysiological recordings. Error bars represent means ± SEM. Males and females were used for experiments, and results were combined for analysis. Statistical analyses were performed using a one-way ANOVA followed by a Tukey’s post-hoc test, *p < 0.05; **p < 0.01; ***p < 0.001

References

    1. Readhead B, Haure-Mirande JV, Zhang B, Haroutunian V, Gandy S, Schadt E, et al. Molecular systems evaluation of oligomerogenic APPE693Q and fibrillogenic APPKM670/671NL/PSEN1Δexon9 mouse models identifies shared features with human Alzheimer’s brain molecular pathology. Mol Psychiatry. 2015;21:1099–111. doi: 10.1038/mp.2015.167. - DOI - PMC - PubMed
    1. Zhang B, Gaiteri C, Bodea LG, Wang Z, Joshua M, Podtelezhnikov AA, et al. Integrated systems approach identifies genetic nodes and networks in late-onset Alzheimer’s disease. Cell. 2013;153:707–20. doi: 10.1016/j.cell.2013.03.030. - DOI - PMC - PubMed
    1. Painter MM, Atagi Y, Liu CC, Rademakers R, Xu H, Fryer JD, et al. TREM2 in CNS homeostasis and neurodegenerative disease. Mol Neurodegener. 2015;10:43. doi: 10.1186/s13024-015-0040-9. - DOI - PMC - PubMed
    1. Gaikwad S, Larionov S, Wang Y, Dannenberg H, Matozaki T, Monsonego A, et al. Signal regulatory protein-beta1: a microglial modulator of phagocytosis in Alzheimer’s disease. Am J Pathol. 2009;175:2528–39. doi: 10.2353/ajpath.2009.090147. - DOI - PMC - PubMed
    1. Mócsai A, Abram CL, Jakus Z, Hu Y, Lanier LL, Lowell CA. Integrin signaling in neutrophils and macrophages uses adaptors containing immunoreceptor tyrosine-based activation motifs. Nat Immunol. 2006;7:1326–33. doi: 10.1038/ni1407. - DOI - PMC - PubMed

Publication types

MeSH terms