. 2018 Oct;562(7728):595-599.
doi: 10.1038/s41586-018-0581-5. Epub 2018 Oct 3.

OTX2 restricts entry to the mouse germline

Affiliations

OTX2 restricts entry to the mouse germline

Jingchao Zhang et al. Nature. 2018 Oct.

Abstract

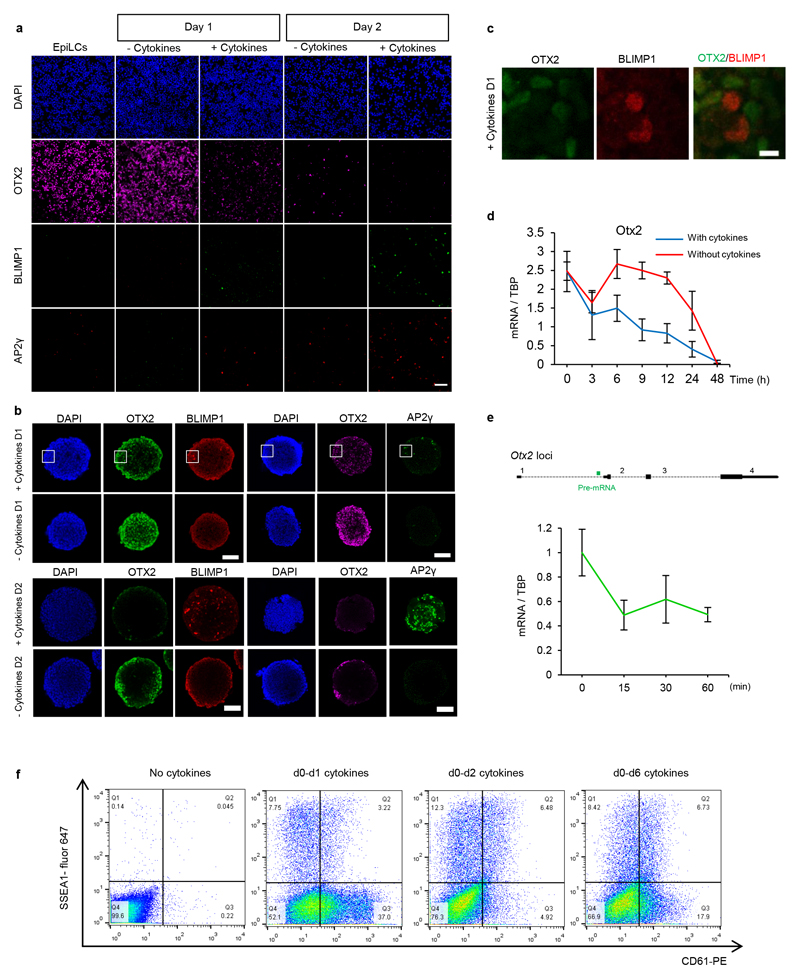
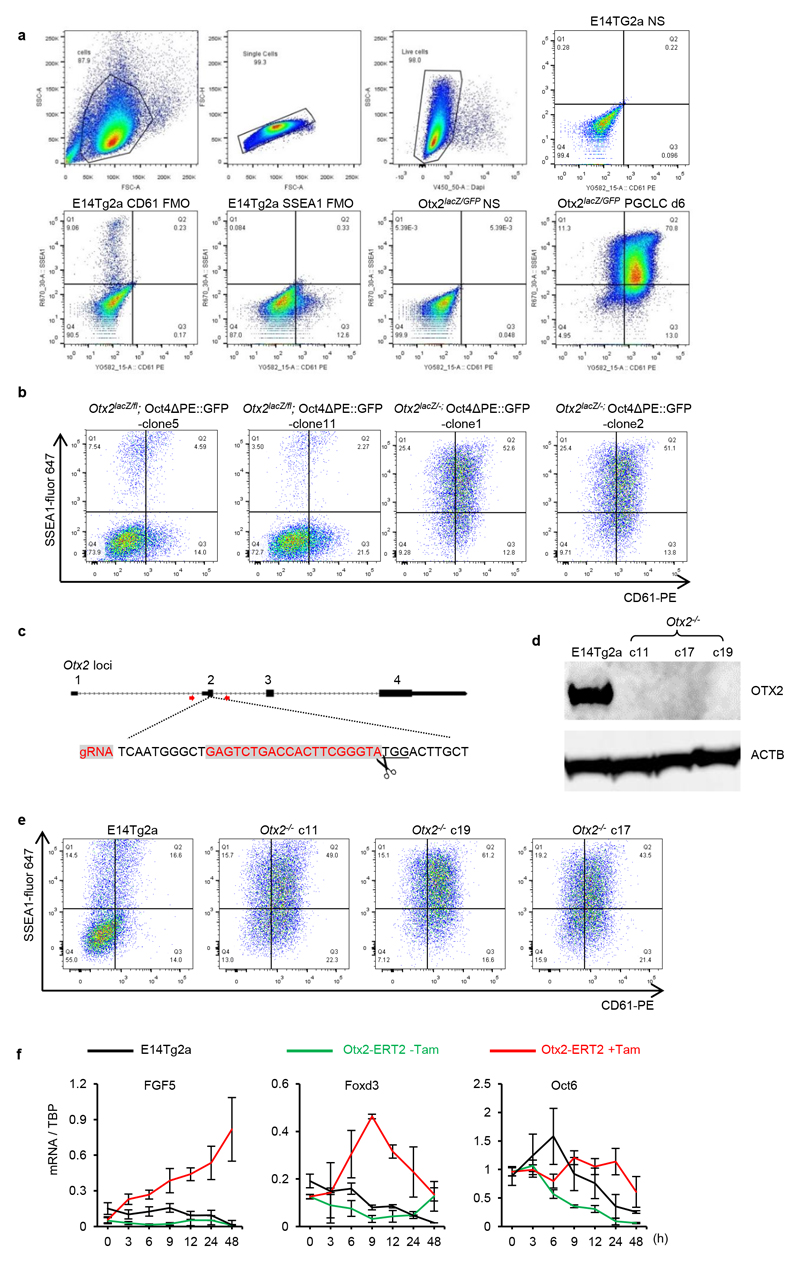
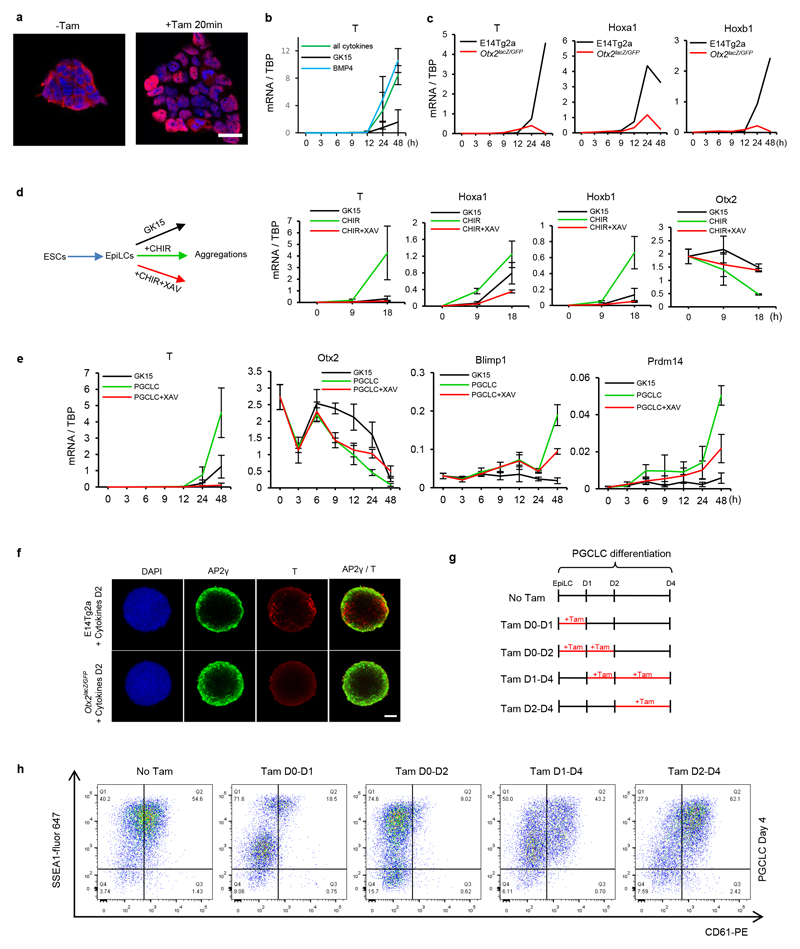
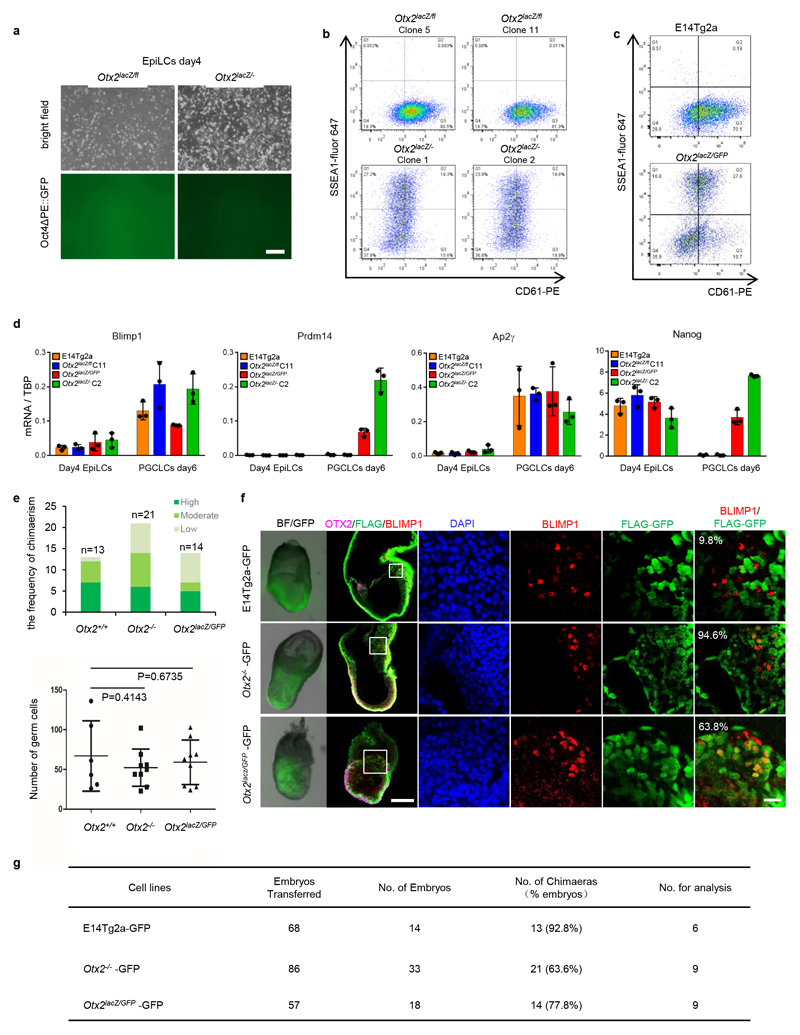
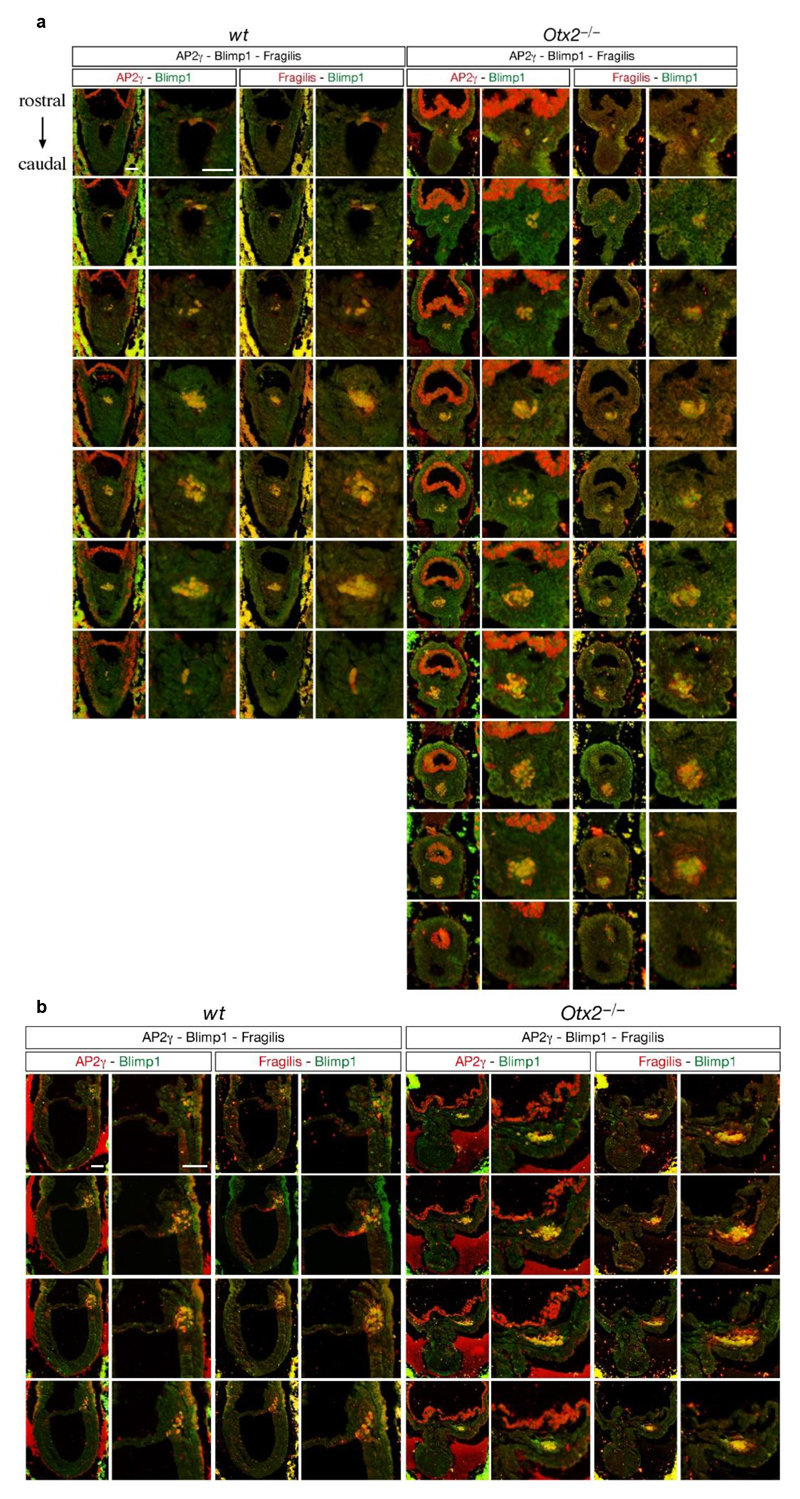
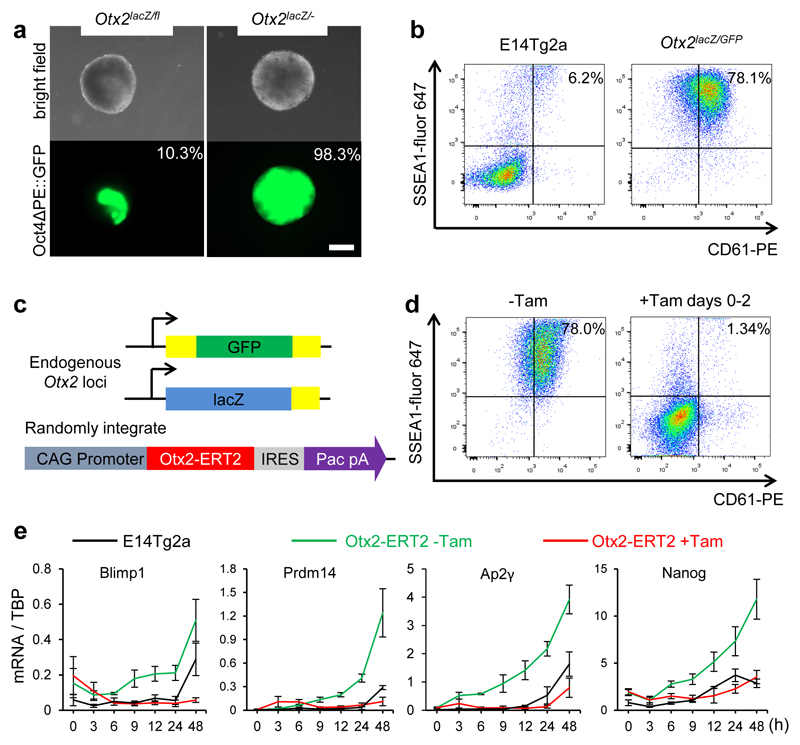
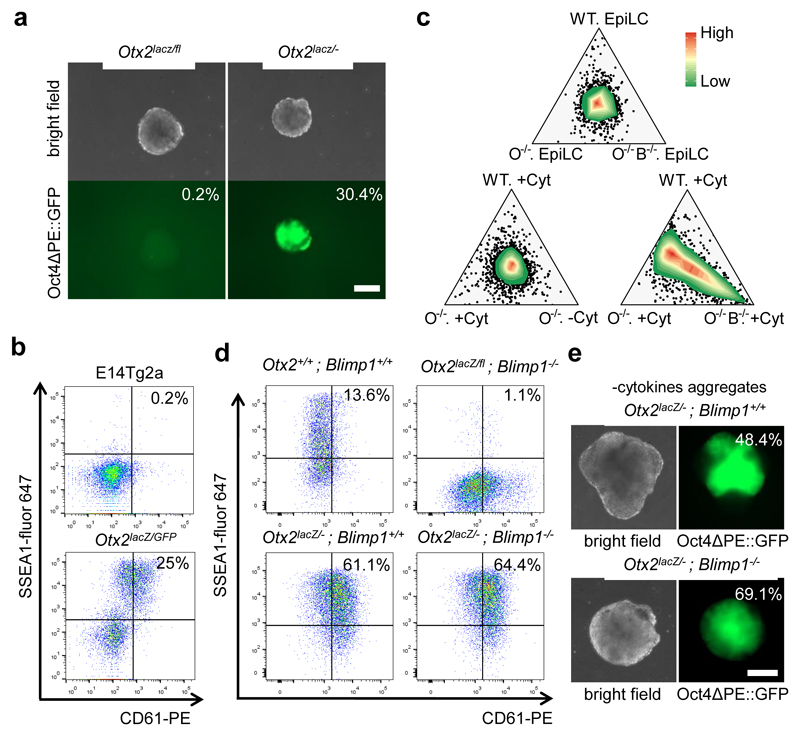
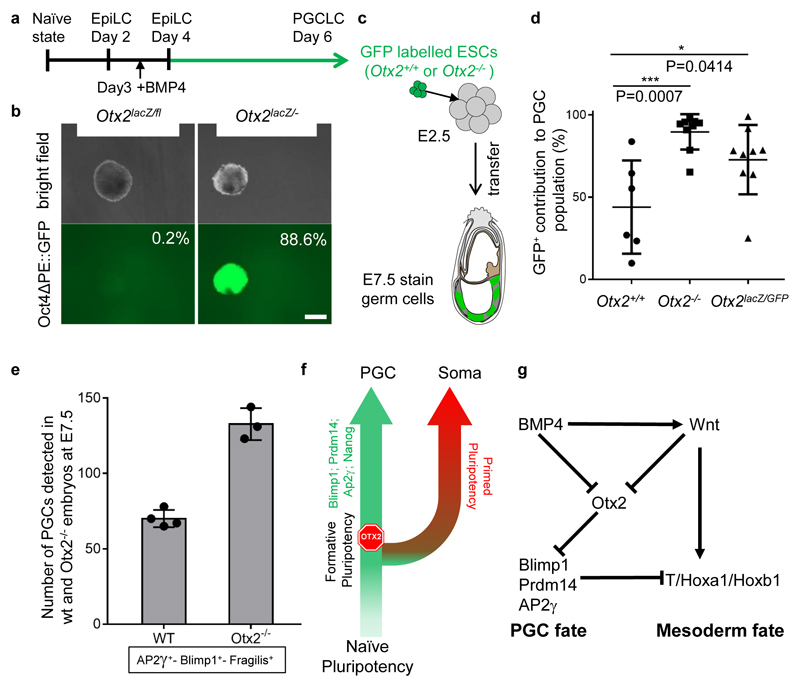
The successful segregation of germ cells from somatic lineages is vital for sexual reproduction and species survival. In the mouse, primordial germ cells (PGCs), precursors of all germ cells, are induced from the post-implantation epiblast1. Induction requires BMP4 signalling to prospective PGCs2 and the intrinsic action of PGC transcription factors3-6. However, the molecular mechanisms that connect BMP4 to induction of the PGC transcription factors that are responsible for segregating PGCs from somatic lineages are unknown. Here we show that the transcription factor OTX2 is a key regulator of these processes. Downregulation of Otx2 precedes the initiation of the PGC programme both in vitro and in vivo. Deletion of Otx2 in vitro markedly increases the efficiency of PGC-like cell differentiation and prolongs the period of PGC competence. In the absence of Otx2 activity, differentiation of PGC-like cells becomes independent of the otherwise essential cytokine signals, with germline entry initiating even in the absence of the PGC transcription factor BLIMP1. Deletion of Otx2 in vivo increases PGC numbers. These data demonstrate that OTX2 functions repressively upstream of PGC transcription factors, acting as a roadblock to limit entry of epiblast cells to the germline to a small window in space and time, thereby ensuring correct numerical segregation of germline cells from the soma.


Conflict of interest statement

The authors declare no competing financial interests.

Figures

Extended Data Figure 1
Extended Data Figure 1. Summary of cell lines used in this report.
Otx2lacZ/GFP and Otx2lacZ/fl ESCs have been described previously. Summarized below are further modifications to Otx2 or Blimp1, or transgene additions in the above or wild-type backgrounds. Further schematic details illustrating the points of Cas9 modification of Otx2 or Blimp1 and genotype verification of derived cell lines are shown in Extended Data Figure 3 or 6, respectively.
Extended Data Figure 2
Extended Data Figure 2. Competence for germline entry is preceded by downregulation of OTX2 protein.
a. Representative cytospin images of OTX2, BLIMP1 and AP2γ staining using E14Tg2a aggregates after 1 day or 2 days of PGCLC differentiation. n=2. Scale bar; 100 μm. b. Whole mount immunofluorescence of E14Tg2a aggregates after 1 (D1) or 2 days (D2) of differentiation of EpiLCs in the presence or absence of cytokines. Representative images of OTX2 and BLIMP1 are shown. n=3. Scale bar; 50 μm. c. Magnified image of the region highlighted in b. Scale bar; 10 μm. d. Quantitative transcript analysis of Otx2 in E14Tg2a cultures with (n=4) or without cytokines (n=7) at indicated time point (h, hours). Schematic illustration is shown in Figure 1b. Expression levels are normalised to TBP; Values are means±SD. e. Top, primers used for Otx2 pre-mRNA transcript analysis are shown relative to the primary transcript structure. Bottom, quantitative transcript analysis of Otx2 pre-mRNA at the indicated times (minutes) after changing E14Tg2a EpiLCs into PGCLC medium. Expression levels are normalised to TBP and shown relative to expression at t = 0; Values are means±SD, n= 3 biologically independent replicates. f. Assessing the temporal requirement of cytokine treatment for efficient PGCLC induction. Aggregates of E14Tg2a EpiLCs treated with cytokines for 1 (d0-d1), 2 (d0-d2) or 6 days (d0-6) were assessed by flow cytometry for surface expression of SSEA1 and CD61 at day 6 of PGCLCs differentiation. n=3.
Extended Data Figure 3
Extended Data Figure 3. Independent Otx2-/- clones show enhanced PGCLC induction efficiency.
a. The gating strategies for analysing PGCLCs by flow cytometry. Cells were first gated based on the FSC (size) and SSC (complexities) scatter plot, followed by selection for singlets based on linear correlations between FSC-area and FSC-height. Live cells were then gated based on exclusion of DAPI to indicate cell membrane integrity. Live cells were then analysed for SSEA1 and CD61. Cells stained for fluorescence minus one (FMO) were used to set gates; stained and non-stained cells are also shown. b. Otx2lacZ/fl and Otx2 lacZ/- cells with the Oct4ΔPE::GFP reporter (2 independent clones each) were assessed by flow cytometry for surface expression of SSEA1 and CD61 at day6 of PGCLC differentiation. For clone 5 and clone 1, n=2; for clone 11and clone 2, n=9 c. Diagram showing the gRNA sequence (in red) and targeting strategy for generating Otx2 knockout cell lines. Red arrows represent genotyping primers used for screening clones. d. Immunoblot analysis of OTX2 protein expression in EpiLCs of E14Tg2a and three Otx2-/- clones. Experiment preformed once. e. E14Tg2a and 3 independent Otx2-/- clones generated by CRISPR/Cas9 were assessed by flow cytometry for surface expression of SSEA1 and CD61 at day 6 of PGCLC differentiation. 2 biologically independent experiments for clone c11, one for clone c17 and c19. f. Q-RT-PCR of epiblast markers during the time-course outlined in Fig 1b. Expression levels are normalised to TBP; h, hours; Values are means±SD, n= 3 biologically independent replicates.
Extended Data Figure 4
Extended Data Figure 4. OTX2 restricts PGC specification during the first 2 days of induction.
a. OTX2 immunofluorescence of Otx2lacZ/GFP::Otx2ERT2 ESCs before or after treatment with tamoxifen for 20min, n= 2 biologically independent experiments. Scale bar=20um. b. Quantitative transcript analysis of T (Brachyury) during the time-course outlined in Figure 1b in basal GK15 medium supplemented with the indicated cytokines. Expression levels are normalised to TBP; Values are means±SD, n= 3 biologically independent replicates. c. Quantitative transcript analysis of T (Brachyury), Hoxa1 and Hoxb1 during the time-course outlined in Figure 1b in indicated cell lines. Expression levels are normalised to TBP; values are means from 2 biologically independent replicates. d. Left: scheme illustrating the strategy for induction or repression of wnt signalling. E14Tg2a EpiLCs were aggregated in the indicated media and transcripts analysed at 0, 9 and 18 hours. Right: Quantitative transcript analysis of T (Brachyury), Hoxa1, Hoxb1 and Otx2 during the time-courses outlined on the left. (h, hours). Expression levels are normalised to TBP; Values are means±SD, n= 3 biologically independent replicates. e. Quantitative transcript analysis of T (Brachyury) Otx2, Blimp1 and Prdm14 during E14Tg2a differentiation in three different media conditions (GK15, without cytokines; PGCLC, GK15 with cytokines; PGCLC +XAV, GK15 with cytokines and with XAV939) at the indicated time point (h, hours). Expression levels are normalised to TBP; Values are means±SD, n= 3 biologically independent replicates. f. Whole mount immunofluorescence analysis of AP2γ and T (Brachyury) in E14Tg2a and Otx2lacZ/GFP day2 (D2) PGCLC aggregates. n=2 biological replicates. Scale bar; 50 μm. g. Scheme illustrating tamoxifen administration schemes. h. Otx2lacZ/GFP::Otx2ERT2 cells were assessed by flow cytometry for surface expression of SSEA1 and CD61 at days 6 of PGCLC differentiation following the tamoxifen treatment regime outlined (b). n=2 biological replicates.
Extended Data Figure 5
Extended Data Figure 5. PGCLC differentiation of Otx2–null cells in the absence of cytokines.
a. Otx2lacZ/fl and Otx2lacZ/- cells carrying the Oct4ΔPE::GFP reporter (aggregates shown in Figure 3a) were assessed by flow cytometry for surface expression of SSEA1 and CD61 at day 6 of PGCLC differentiation in the absence of cytokines. n=7. b. E14Tg2a and 3 independent Otx2-/- clones generated by CRISPR/Cas9 were assessed by flow cytometry for surface expression of SSEA1 and CD61 at day 6 of PGCLC differentiation in the absence of cytokines. 2 biologically independent experiments for clone c11, one for clone c17 and c19. c. Quantitative transcript analysis of mRNAs encoding PGC TFs during differentiation without PGCLC cytokines at indicated time point. Expression levels are normalised to TBP; Values are means±SD, n= 3 biologically independent replicates. d. Wholemount immunostaining of aggregates of Otx2lacZ/GFP cells at day 2 in the absence of cytokines for OTX2, BLIMP1 and AP2γ. Bar; 40μm. n=3.
Extended Data Figure 6
Extended Data Figure 6. Transcriptome analysis of EpiLCs and day6 PGCLCs.
a-b. Heatmap of the normalized gene expression and and principal component analysis of microarray data (from 3 biologically independent replicates under 7 different conditions) ordered by unsupervised hierarchical clustering; rows correspond to transcripts and columns to cells. Differentiations performed in the presence (+Cyt) or absence (-Cyt) of cytokines are indicated. WT, E14Tg2a; O-/-, Otx2lacZ/GFP; O-/- B-/-, Otx2lacZ/GFP; Blimp1-/-.
Extended Data Figure 7
Extended Data Figure 7. PGCLC induction of independent Blimp1-null cell lines.
a. Scheme showing the strategy used to generate Blimp1 KO cell lines. A pair of gRNAs flanking Blimp1 exon5 were co-expressed to ensure complete deletion of Blimp1 exon5. Red arrows represent genotyping primer pairs used to screen clones. b, c. Blimp1-null clones used in Figure 3 (b) or Extended Figure 8d (c) were genotyped using primers indicated in a. n= 2 biologically independent replicates for both, all clones have been sequenced. d. Cells of the indicated genotypes (c) were assessed by flow cytometry for surface expression of SSEA1 and CD61 at day 6 of aggregation in the presence of PGC induction cytokines. n=2 e-f. Cells of the indicated genotypes (c) were assessed by flow cytometry for surface expression of SSEA1 and CD61 at day 6 of aggregation in the absence of PGC induction cytokines. n=2
Extended Data Figure 8
Extended Data Figure 8. Otx2-/-; Blimp1-/- PGCLCs activate PGC markers.
a. Quantitative analysis of somatic transcripts at day 2 of PGCLC induction in the indicated cell lines. Expression levels are normalised to TBP; Values are means ± SD; n=4 biological replicates, each dot represents the value from one experiment. b. Quantitative analysis of PGC TF transcripts at day 2 of PGCLC induction in the indicated cell lines. Expression levels are normalised to TBP; Values are means ± SD; n=6 biological replicates for E14Tg2A and Otx2lazZ/GFP, and 4 for Blimp1 KO cell lines each dot represents the value from one experiment. c. Immunofluorescence staining for OCT4 and DAZL of cryo-sections of Otx2lacZ/GFP and Otx2lacZ/GFP; Blimp1-/- aggregates at day6 of PGCLC induction. Bar; 50μm and 20μm. n= 2 biologically independent replicates. d. OCT4, H3K27me3 and H3K9me2 immunofluorescence analysis of cryo-sections of E14Tg2a, Otx2lacZ/GFP and Otx2lacZ/GFP; Blimp1-/- aggregates at day6 of PGCLC induction. Bar; 50μm. n= 2 biologically independent replicates.
Extended Data Figure 9
Extended Data Figure 9. OTX2 safeguards somatic lineages.
a. Representative morphologies and Oct4ΔPE::GFP expression of EpiSCs after 1 passage from EpiLCs (n=3 for 1 clone of each genotype). Bar; 200μm. b, c. Flow cytometry analysis for surface expression of SSEA1 and CD61 at day 6 of PGCLC differentiation, initiated from EpiSCs after 1 passage from EpiLCs. For panel b, One experiment for c5 and c1 and 6 biologically independent replicates for C11 and C2; for panel c, n= 6 biologically independent replicates. d. Quantitative transcript analysis of PGC TFs in the indicated cell lines. Expression levels are normalised to TBP; Values are means±SD, n= 3 biologically independent replicates., each dot represents the value from one experiment. e. Comparison of the frequency of degree of chimaerism (top) and the germ cell numbers (bottom, centre lines and error bars represents means±SD.) in E7.5 chimaeric embryos formed using wildtype or Otx2-null ESCs. P value (two-tailed unpaired T-test, 0.95 confidence intervals) is indicated. High, > 70%; Moderate, 30 - 70%; Low, < 30%. f. Bright field and representative images of E7.5 chimaeric embryos formed by wild-type host embryos and GFP labelled Otx2+/+ (n=6), Otx2-/- (n=9) or Otx2lacZ/GFP (n=9) ESCs assessed for GFP and BLIMP1/SOX2 expression, with magnified images of the proximal posterior regions. The proportion of BLIMP1-positive cells expressing GFP in the embryos is indicated. Bar, 100μm (left) and 20μm. g. Summary of embryo aggregations.
Extended Data Figure 10
Extended Data Figure 10. Otx2-null embryos exhibit increased number of PGCs.
a, b. Frontal-coronal (a) and sagittal (b) sections of wild type and Otx2-/- E7.5 embryos stained with Blimp1, AP2γ and Fragilis to detect PGCs. All sequential sections spanning the PGCLCs niche are shown. Bar; 50μm. The experiments were repeated in 4 wt and 3 Otx2KO embryos.
Figure 1
Figure 1. Otx2 expression is down-regulated prior to expression of PGC TFs.
a. Scheme for PGCLC differentiation. b. Top, scheme illustrating the time-points (hours) during PGCLC differentiation when mRNAs were analysed. Bottom, Q-RT-PCR of Otx2 and PGC TFs in E14Tg2a ESCs. Expression levels are normalised to TBP; h, hours; Values are means±SD, n= 3 biologically independent replicates. c. Single cell quantification of immunofluorescence for Otx2 and Ap2γ in cytospin preparations of EpiLCs and cell aggregates at day 1 and day 2 of PGCLC induction. 2 biologically independent replicates were performed. d. Whole mount immunofluorescence of E14Tg2a aggregates after 1 day of PGCLC differentiation. n=3. Scale bar, 50μm (top) and 10μm (bottom) e-g. Representative confocal images of whole mount staining of embryos at pre-streak (e, n=4), early streak (f, n=3) and late streak (g, n=3) stages. Bar = 40μm (e), 100μm (f, g). h-i. Magnified image of the regions highlighted in (f) and (g) respectively. OTX2-negative cells expressing BLIMP1 and FRAGILIS are outlined (g, h). Bar = 20μm.
Figure 2
Figure 2. Otx2-/- EpiLCs have an enhanced propensity to differentiate into PGCLCs.
a. Representative morphologies and Oct4ΔPE::GFP expression in aggregates at day 4 of PGCLC differentiation in the presence of cytokines. Percentages indicate GFP-positive cells; n=9. Bar = 200μm. b. E14Tg2a and Otx2-/- cells were assessed by flow cytometry for surface expression of SSEA1 and CD61 at days 6 of PGCLC differentiation; (n=12). c. Diagram of the tamoxifen inducible Otx2 cell line, carrying an Otx2-ERT2 fusion protein transgene and replacements of endogenous Otx2 alleles by GFP or LacZ. d. Otx2lacZ/GFP::Otx2ERT2 cells were assessed by flow cytometry for surface expression of SSEA1 and CD61 at day 6 of PGCLC differentiation, either without Tamoxifen or with Tamoxifen from days 0-2, n= 4 biologically independent replicates. e. Q-RT-PCR of PGC TFs. Expression levels are normalised to TBP; h, hours; Values are means±SD, n= 3 biologically independent replicates.
Figure 3
Figure 3. Otx2-null cells can access the germline independently of cytokines and Blimp1.
a. Representative morphologies and Oct4ΔPE::GFP expression in aggregates at day 4 of PGCLC differentiation without cytokines. Percentages indicate GFP-positive cells; (n= 7). Bar = 200μm. b. E14Tg2a and Otx2-/- cells were assessed by flow cytometry for surface expression of SSEA1 and CD61 at day 6 of differentiation in the absence of PGCLC cytokines; (n=9). c. Ternary plot analysis (microarray data from 3 biologically independent replicates under 7 different conditions) comparing transcriptomes of EpiLCs (top) or day6 PGCLCs (bottom). Circles represent probes, with colour indicating the probe density. Differentiations performed in the presence or absence of cytokines are indicated (+/-Cyt). WT, E14Tg2a; O-/-, Otx2lacZ/GFP; O-/- B-/-, Otx2lacZ/GFP Blimp1-/-. d. Cells of the indicated genotypes were assessed by flow cytometry for surface expression of SSEA1 and CD61 at day 6 of PGCLC differentiation; (n=2 for 1 clone of each genotype). Two further clones of each genotype are shown in Extended Data Figure 6. e. Cytokine-free PGCLC differentiation. Representative morphologies and Oct4ΔPE::GFP expression of aggregates at day 6. Percentages indicate GFP-positive cells; (n=2 for 1 clone of each genotype). Bar = 200μm.
Figure 4
Figure 4. Otx2-/- ESCs contribute to the germline at an enhanced rate in vivo.
a. Scheme for PGCLC differentiation, initiated from day 4 EpiLCs obtained after 1 passage from EpiLCs. b. Representative morphologies and Oct4ΔPE::GFP expression from aggregates at day 6 of PGCLC differentiation from EpiLCs day4 (n=3 for 1 clone of each genotype). Bar = 200μm. c. Scheme for generating chimaeras of GFP labelled Otx2+/+ or Otx2-/- ESCs with wildtype host embryos. d. Comparison of the percentage contribution of GFP labelled wildtype (n=6) or Otx2-null ESCs (genotypes indicated, n=9 for each) to the PGC population in E7.5 chimaeric embryos. Each dot represents the percentage from one chimaera, centre lines and error bars represents means±SD. P value (two-sided unpaired T-test, 0.95 confidence intervals) is indicated. GFP positive cells were counted within the PGC population marked with BLIMP1 or SOX2 in each embryo. e. Comparison of PGCs number in wild-type (n= 4) and Otx2-/- (n= 3) E7.5 embryos. PGCs were identified with Blimp1, AP2γ and Fragilis. Values= means ± SD. f. Model indicating the point of operation of OTX2 during germline-soma segregation. g. A scheme illustrating the regulatory relationships upstream and downstream of Otx2 during germline segregation.

Comment in

  • How to lose your inheritance.
    Laird DJ. Laird DJ. Nature. 2018 Oct;562(7728):497-498. doi: 10.1038/d41586-018-06849-5. Nature. 2018. PMID: 30349122 No abstract available.

References

    1. Ohinata Y, et al. A signaling principle for the specification of the germ cell lineage in mice. Cell. 2009;137:571–584. doi: 10.1016/j.cell.2009.03.014. - DOI - PubMed
    1. Lawson KA, et al. Bmp4 is required for the generation of primordial germ cells in the mouse embryo. Genes & development. 1999;13:424–436. - PMC - PubMed
    1. Ohinata Y, et al. Blimp1 is a critical determinant of the germ cell lineage in mice. Nature. 2005;436:207–213. doi: 10.1038/nature03813. - DOI - PubMed
    1. Vincent SD, et al. The zinc finger transcriptional repressor Blimp1/Prdm1 is dispensable for early axis formation but is required for specification of primordial germ cells in the mouse. Development. 2005;132:1315–1325. doi: 10.1242/dev.01711. - DOI - PubMed
    1. Yamaji M, et al. Critical function of Prdm14 for the establishment of the germ cell lineage in mice. Nature genetics. 2008;40:1016–1022. doi: 10.1038/ng.186. - DOI - PubMed

Publication types

MeSH terms