

Projecting potential spatial and temporal changes in the distribution of Plasmodium vivax and Plasmodium falciparum malaria in China with climate change
- PMID: 30283159
- PMCID: PMC6166864
- DOI: 10.1016/j.scitotenv.2018.01.300
Projecting potential spatial and temporal changes in the distribution of Plasmodium vivax and Plasmodium falciparum malaria in China with climate change
Abstract
Background: Global climate change is likely to increase the geographic range and seasonality of malaria transmission. Areas suitable for distribution of malaria vectors are predicted to increase with climate change but evidence is limited on future distribution of malaria with climate in China.
Objective: Our aim was to assess a potential effect of climate change on Plasmodium vivax (P. vivax) and Plasmodium falciparum (P. falciparum) malaria under climate change scenarios.
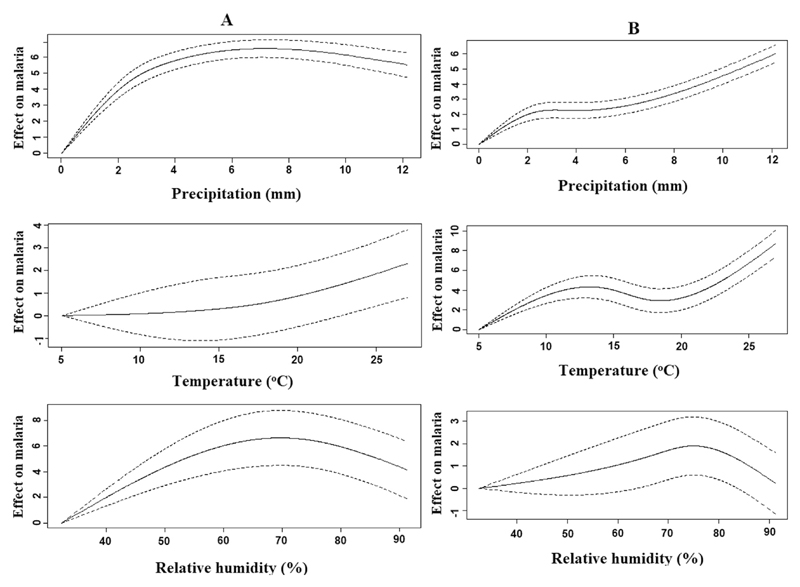
Methods: National malaria surveillance data during 2005-2014 were integrated with corresponding climate data to model current weather-malaria relationship. We used the Generalized Additive Model (GAM) with a spatial component, assuming a quasi-Poisson distribution and including an offset for the population while accounting for potential non-linearity and long-term trend. The association was applied to future climate to project county-level malaria distribution using ensembles of Global Climate Models under two climate scenarios - Representative Concentration Pathways (RCP4.5 and RCP8.5).
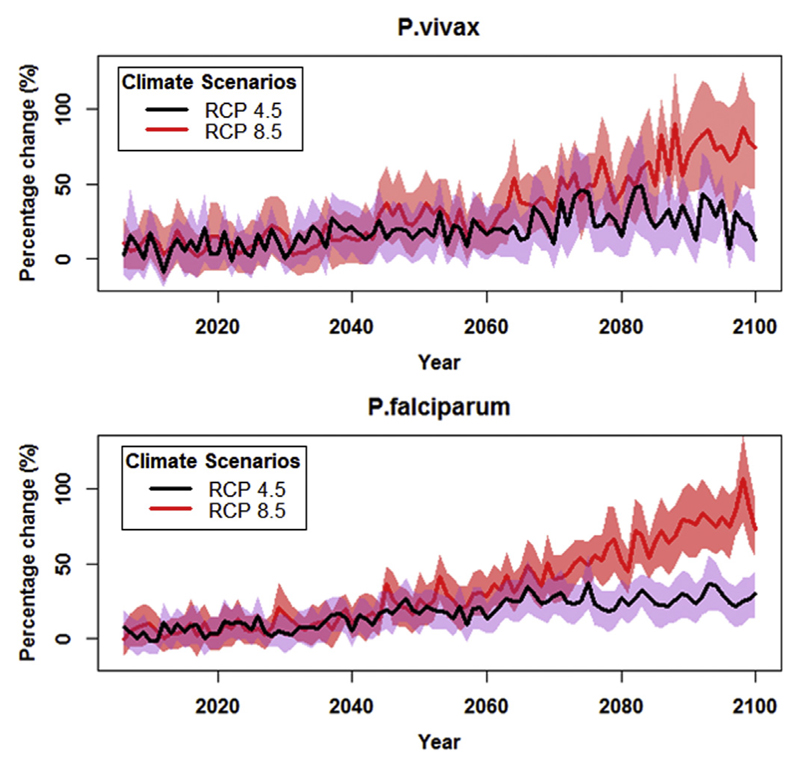
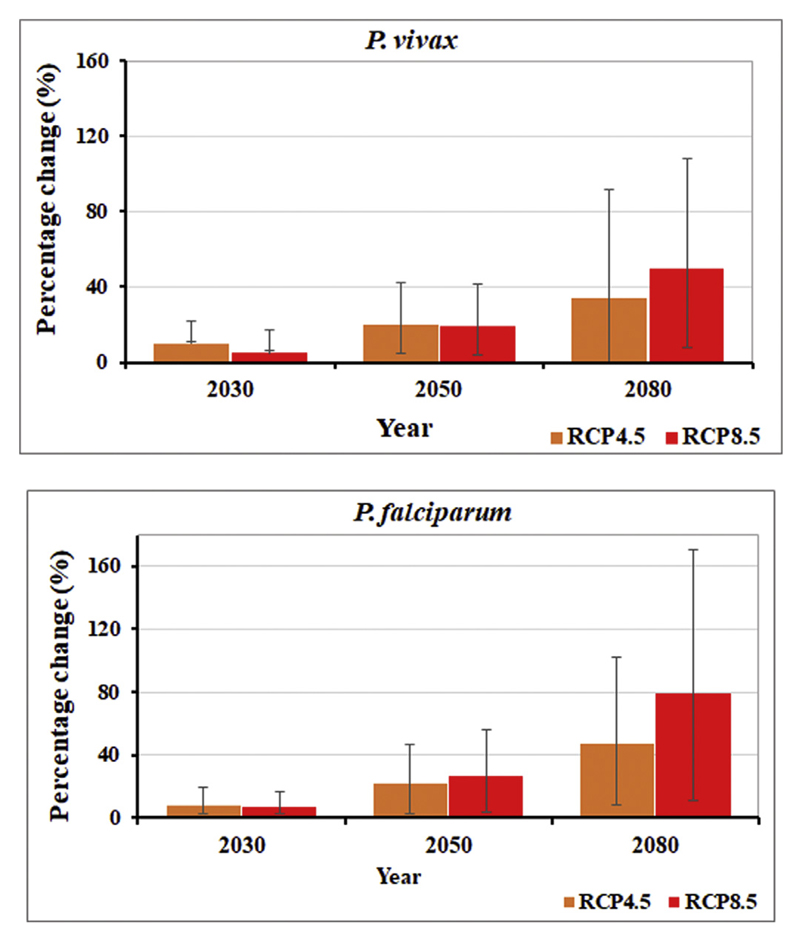
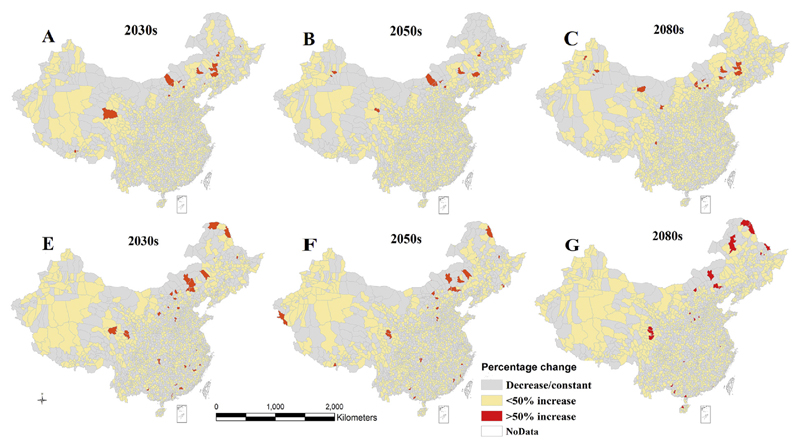
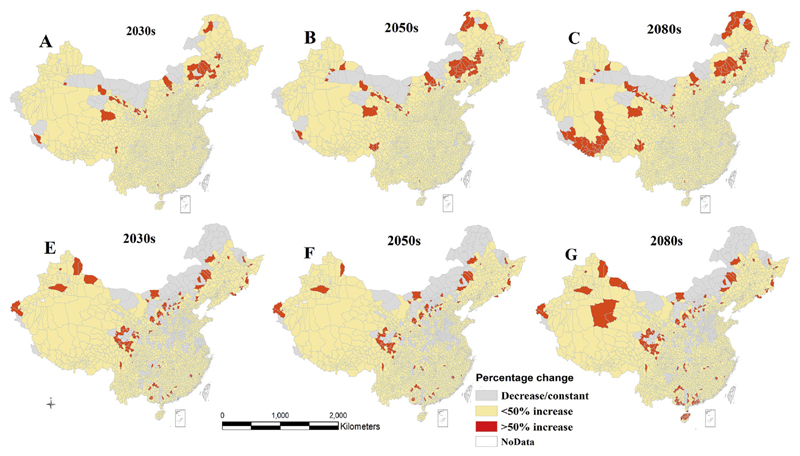
Results: Climate change could substantially increase P. vivax and P. falciparum malaria, under both climate scenarios, but by larger amount under RCP8.5, compared to the baseline. P. falciparum is projected to increase more than P. vivax. The distributions of P. vivax and P. falciparum malaria are expected to increase in most regions regardless of the climate scenarios. A high percentage (>50%) increases are projected in some counties of the northwest, north, northeast, including northern tip of the northeast China, with a clearer spatial change for P. vivax than P. falciparum under both scenarios, highlighting potential changes in the latitudinal extent of the malaria.
Conclusion: Our findings suggest that spatial and temporal distribution of P. vivax and P. falciparum malaria in China will change due to future climate change, if there is no policy to mitigate it. These findings are important to guide the malaria elimination goal for China.
Keywords: Climate; Malaria; P. falciparum; P. vivax; RCP; Scenario.
Figures
References
-
- An Grace. Influence of climate on malaria in China. Penn McNair Res J. 2011;3
-
- Astrom C, Rocklov J, Hales S, Beguin A, Louis V, Sauerborn R. Potential distribution of dengue fever under scenarios of climate change and economic development. EcoHealth. 2012;9:448–454. - PubMed
-
- Bhattacharya S, Sharma C, Dhiman R, Mitra A. Climate change and malaria in India. Curr Sci. 2006;90:369.
MeSH terms
Grants and funding
LinkOut - more resources
Full Text Sources
Medical