. 2018 Sep 19:12:311.
doi: 10.3389/fncel.2018.00311. eCollection 2018.

SK2 Channels Associate With mGlu Receptors and CaV2.1 Channels in Purkinje Cells

Affiliations

SK2 Channels Associate With mGlu Receptors and CaV2.1 Channels in Purkinje Cells

Rafael Luján et al. Front Cell Neurosci. .

Abstract

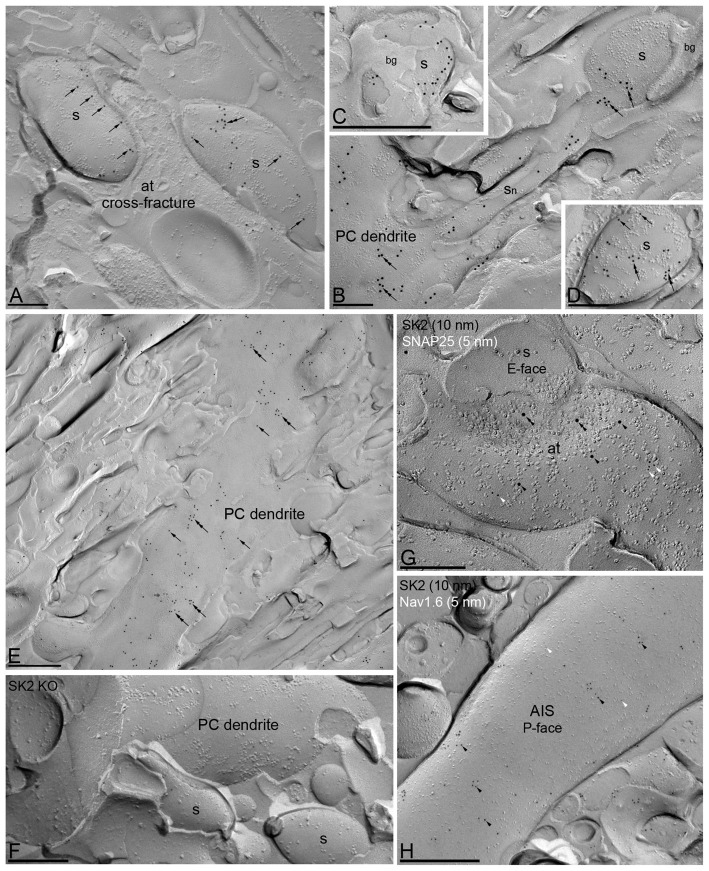
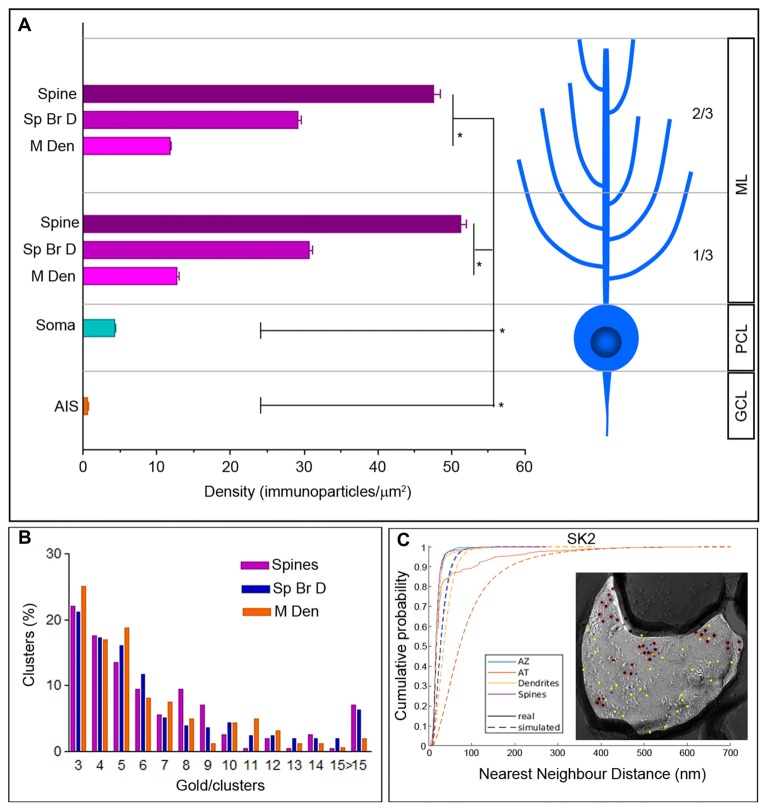
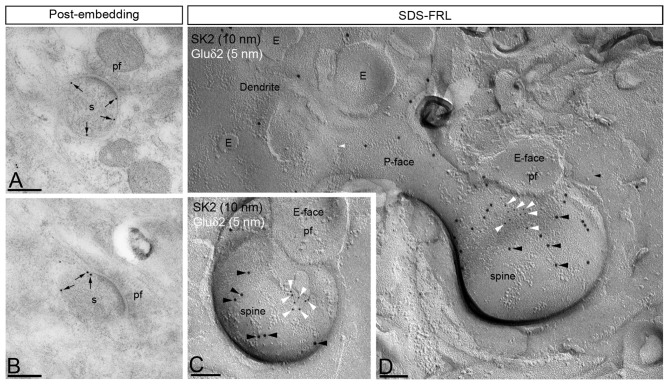
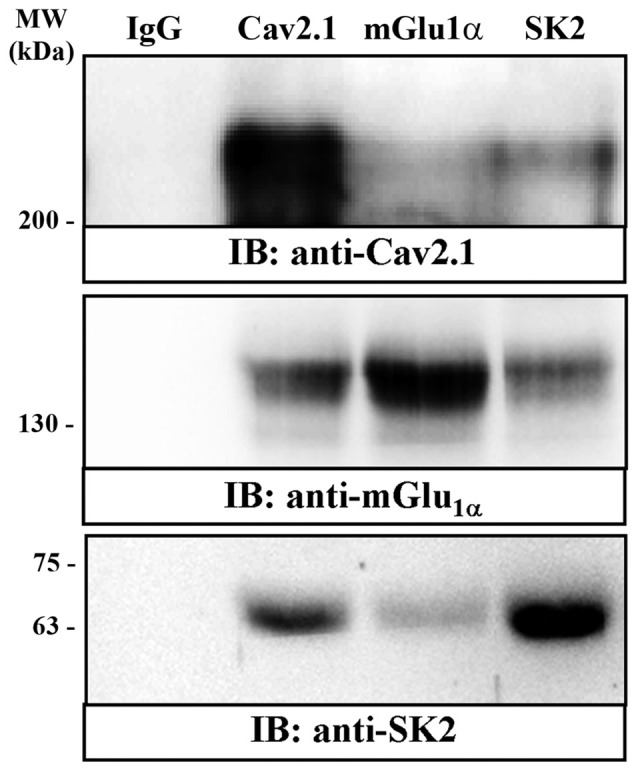
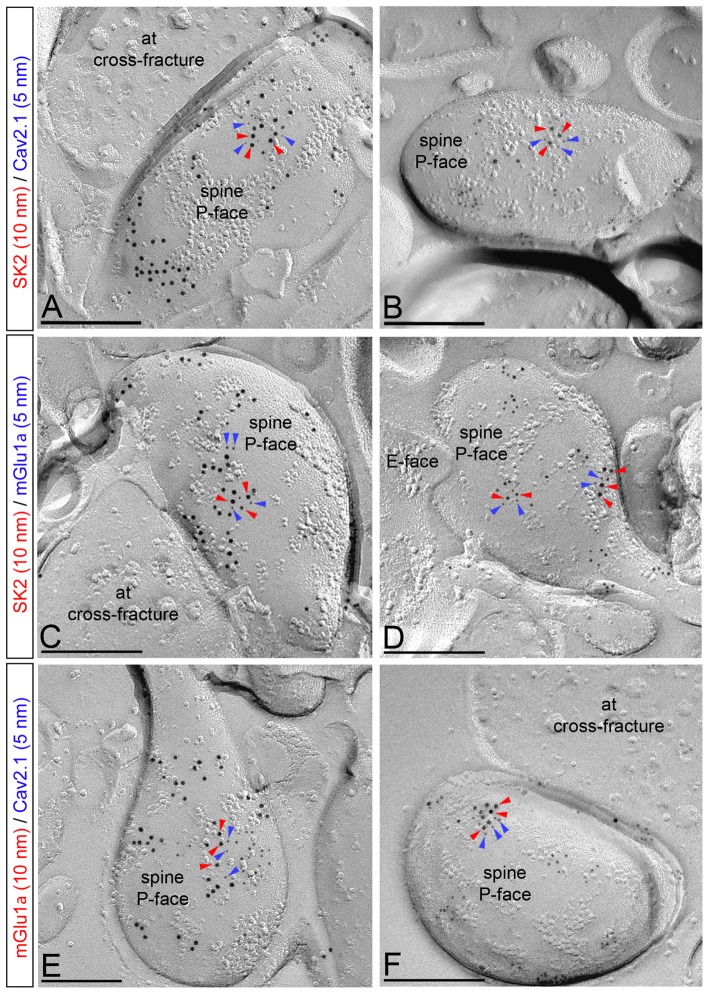
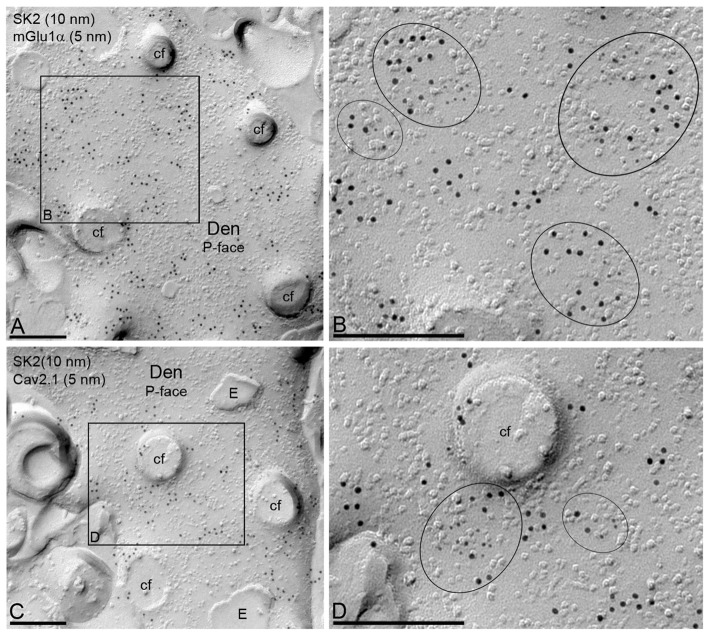
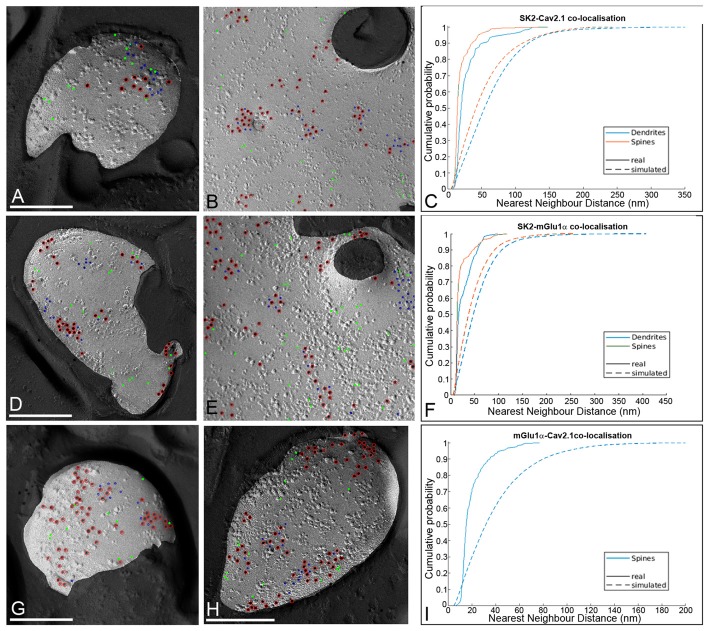
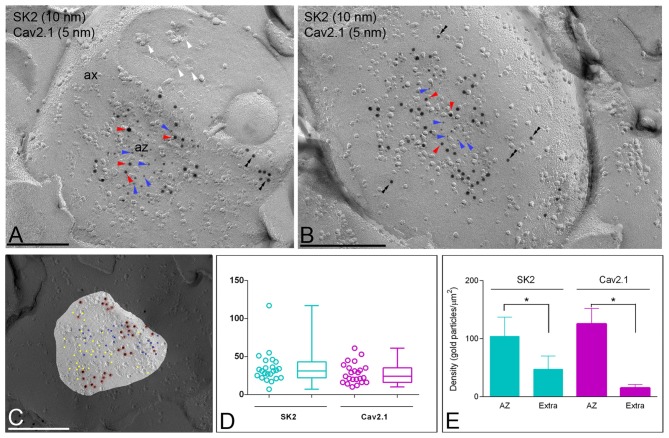
The small-conductance, Ca2+-activated K+ (SK) channel subtype SK2 regulates the spike rate and firing frequency, as well as Ca2+ transients in Purkinje cells (PCs). To understand the molecular basis by which SK2 channels mediate these functions, we analyzed the exact location and densities of SK2 channels along the neuronal surface of the mouse cerebellar PCs using SDS-digested freeze-fracture replica labeling (SDS-FRL) of high sensitivity combined with quantitative analyses. Immunogold particles for SK2 were observed on post- and pre-synaptic compartments showing both scattered and clustered distribution patterns. We found an axo-somato-dendritic gradient of the SK2 particle density increasing 12-fold from soma to dendritic spines. Using two different immunogold approaches, we also found that SK2 immunoparticles were frequently adjacent to, but never overlap with, the postsynaptic density of excitatory synapses in PC spines. Co-immunoprecipitation analysis demonstrated that SK2 channels form macromolecular complexes with two types of proteins that mobilize Ca2+: CaV2.1 channels and mGlu receptors in the cerebellum. Freeze-fracture replica double-labeling showed significant co-clustering of particles for SK2 with those for CaV2.1 channels and mGlu receptors. SK2 channels were also detected at presynaptic sites, mostly at the presynaptic active zone (AZ), where they are close to CaV2.1 channels, though they are not significantly co-clustered. These data demonstrate that SK2 channels located in different neuronal compartments can associate with distinct proteins mobilizing Ca2+, and suggest that the ultrastructural association of SK2 with CaV2.1 and mGlu provides the mechanism that ensures voltage (excitability) regulation by distinct intracellular Ca2+ transients in PCs.

Keywords: calcium channel; cerebellum; electron microscopy; immunohistochemistry; mGlu receptor; potassium channel; synapse.


Figures

Figure 1
Figure 1
Subcellular localization of SK2 channels along the surface of Purkinje cells (PCs) using the SDS-digested freeze-fracturereplica labeling (SDS-FRL) technique. Immunolabeling is restricted to the plasma membrane P-face of PCs. The E-face of Bergmann glia (bg), cross-fractures (panel A) or E-faces of neurons (panel G) are free of any immunolabeling. (A–E) Immunoparticles for SK2 channels (10 nm gold) are scattered (arrows) and clustered (double arrows) in dendritic spines (S) and dendritic shafts (PC dendrite, DEN) of PCs. (G) The image shows a high-magnification of the replicated plasma membrane of an axon terminal (at), presumably from granule cells, and spines (s) in a E-face view, showing the co-localization of SK2 (10 nm immunogold) and SNAP25 (5 nm immunogold, white arrowheads). Within this presynaptic localization, SK2 immunoparticles were observed both along the active zone (AZ; double black arrowheads) and at extrasynaptic membranes (black arrowheads). (H) The image shows the P-face of an axon initial segment (AIS) co-labeled for the SK2 (10 nm, black arrowheads) and Nav1.6 (5 nm, white arrowheads) channels. Very low frequency of immunogold labeling for SK2 was detected along AIS. (F) The specificity of the antibody was confirmed in replicas of SK2 channel-knockout mice (SK2 KO) that were free of any immunolabeling. Scale bar: (A,D,F,G) 0.2 μm; (E,H) 0.5 μm.
Figure 2
Figure 2
Density gradient of SK2 immunoparticles in the surface of PCs. (A) Bar graph shows the density (mean ± SEM) of the SK2 channels in eight compartments of PCs. Density of SK2 immunoparticles increased from soma to dendritic spines (soma = 4.31 ± 0.13/μm2; 1/3 ML main dendrite = 12.69 ± 1.96/μm2; 2/3 ML main dendrite = 11.77 ± 0.81/μm2; 1/3 ML spiny branchlet dendrite = 30.67 ± 3.11/μm2; 2/3 ML spiny branchlet dendrite = 29.14 ± 2.69/μm2; 1/3 ML spines = 51.23 ± 2.78/μm2; 2/3 ML spines = 47.60 ± 2.69/μm2; Kruskal–Wallis test, pairwise Mann–Whitney U test and Dunns method, *p < 0.001). Immunoparticle density for SK2 channels on the AISs was not significantly different from the background (AIS = 0.64 ± 0.02/μm2; background = 0.62 ± 0.03/ μm2). ML, molecular layer; PCL, Purkinje cell layer; GCL, granule cell layer. (B) The graph shows the quantification for the number of SK2 particles per cluster in the spines, spiny branchlets (Sp Br D) and main dendrites (M Den). Approximately 76% of clusters in dendritic spines and spiny branchlets and 81% in main dendrites were in the range of 3–8 immunoparticles. (C) Cumulative probability plots of SK2 to SK2 NND. Real and simulated SK2 are shown by solid and dotted lines, respectively. AZ, active zone; AT, axon terminal. The EM image is an example that show random simulation of SK2 immunoparticles in a dendritic spine. Red, real SK2; Yellow, simulated SK2; blue, real Cav2.1.
Figure 3
Figure 3
SK2 channels are excluded from the postsynaptic membrane specializations in PC spines. Electron micrographs showing immunoparticles for SK2 in the molecular layer of the cerebellar cortex, as detected using the post-embedding immunogold (panels A,B) and the SDS-FRL (panels C,D) techniques in the adult mice. (A,B) Using the post-embedding immunogold method, immunoparticles for SK2 were always detected outside the synaptic specialization and only detected both at perisynaptic and extrasynaptic sites (arrows) of PC spines (s) establishing excitatory synapses with parallel fiber terminals (pf). (C,D) Using the highly sensitive SDS-FRL technique, immunoparticles for SK2 (10 nm, black arrowheads) did not co-cluster with particles for Gluδ2 that is expressed selectively at PF-PC synapses (5 nm, white arrowheads), demonstrating the absence of SK2 from the PSD of excitatory synapses between PC spines and PFs. Scale bars: (A,B) 0.2 μm; (C,D) 0.1 μm.
Figure 4
Figure 4
Co-immunoprecipitation of mGlu receptor and SK2 and Cav2.1 channels from mouse cerebellum. Solubilized cerebellar membrane extracts underwent immunoprecipitation analysis using rabbit control IgG (2 μg, lane 1); rabbit anti-Cav2.1 (2 μg, lane 2); rabbit anti-mGlu (2 μg, lane 3) and rabbit anti-SK2 (2 μg, lane 4). Immunoprecipitates (IP) were investigated by SDS-PAGE and immunoblotted using a rabbit anti-CaV2.1 (1 μg/ml), rabbit anti-mGlu (1 μg/ml) and guinea-pig anti-SK2 (1 μg/ml). Immunoreactive bands were detected as we have described in detail in the experimental procedures.
Figure 5
Figure 5
Co-localization of SK2 channels with CaV2.1 channels and mGlu receptor in PC spines. Electron micrographs obtained in the molecular layer of the cerebellar cortex showing double labeling for SK2 (10 nm, red arrowheads) and CaV2.1 (5 nm, blue arrowheads; panels A,B), double labeling for SK2 (10 nm, red arrowheads) and mGlu (5 nm, blue arrowheads; panels C,D), and double labeling for mGlu (10 nm, red arrowheads) and CaV2.1 (5 nm, blue arrowheads; panels E,F). In dendritic spines of PCs, SK2 immunoparticles (red arrowheads) co-clustered with those for CaV2.1 and mGlu (blue arrows). In addition, mGlu immunoparticles (red arrowheads) co-clustered with those for CaV2.1 (blue arrowheads). at, axon terminals. Scale bars: (A–F) 0.2 μm.
Figure 6
Figure 6
Co-localization of SK2 channels with CaV2.1 channels and mGlu receptor in PC dendritic shafts. Electron micrographs obtained in the molecular layer of the cerebellar cortex showing immunoparticles for SK2, as detected using the SDS-FRL technique. (A,B) Double labeling for SK2 (10 nm) and mGlu (5 nm) showing their co-clustering in the P-face of PC dendritic shafts (Den). The black box in panel (A) demarcates the dendritic area shown at higher magnification in panel (B). Clusters of immunoparticles for the two proteins are delineated by black ellipses. (C,D) Double labeling for SK2 (10 nm) and CaV2.1 (5 nm) showing their co-clustering in dendritic spines of PCs. The black box in panel (C) demarcates the dendritic area shown at higher magnification in panel (D). Clusters of immunoparticles for the two proteins are delineated by black ellipses. cf, cross-fracture of dendritic spines; E, E-face. Scale bars: (A–D) 0.2 μm.
Figure 7
Figure 7
Spatial relationship between SK2, CaV2.1 and mGlu in PCs. (A) Example showing random simulation of immunoparticles for CaV2.1 in a dendritic spine. (B) Example showing random simulation of immunoparticles for CaV2.1 in a dendritic shaft. Red, real SK2; blue, real Cav2.1; green, simulated Cav2.1. (C) Cumulative probability plot of NND from SK2 to CaV2.1 particles in dendrites (blue) and spines (red). Solid: real NND between SK2 and CaV2.1; Dashed: simulated NND. The SK2 to CaV2.1 NNDs were significantly smaller than the random NNDs in dendritic shafts and spines (p < 0.05, pairwise Mann–Whitney U test, numbers of profiles analyzed for spines and dendrites should be indicated). (D) Example showing random simulation of immunoparticles for mGlu in a dendritic spine. (E) Example showing random simulation of immunoparticles for mGlu in a dendritic shaft. Red, real SK2; blue, real mGlu; green, simulated mGlu. (F) Cumulative probability plot of NND from SK2 to mGlu particles in dendrites (blue) and spines (red). Solid: real NND between SK2 and mGlu; Dashed NND: simulated. The SK2 to mGlu NNDs were significantly smaller than the random NNDs in dendritic shafts and spines (p < 0.05, pairwise Mann–Whitney U test, numbers of profiles analyzed for spines and dendrites should be indicated). (G,H) Examples showing random simulation of immunoparticles for CaV2.1 in dendritic spines. Red, real mGlu; blue, real Cav2.1; green, simulated Cav2.1. (I) Cumulative probability plot of NND between CaV2.1 and mGlu particles in spines (blue). Solid: real NND between mGlu and CaV2.1; Dashed: simulated. The mGlu to CaV2.1 NNDs were significantly smaller than the random NNDs in dendritic spines (p < 0.05, pairwise Mann–Whitney U test, number of profiles analyzed should be indicated).
Figure 8
Figure 8
Co-localization of SK2 and CaV2.1 channels in the presynaptic AZ of ATs. Electron micrographs obtained in the molecular layer of the cerebellar cortex showing the P-face and cross-fractured face of ATs (ax), which were identified by presence of synaptic vesicles (white arrowheads), as well as active zones (az) recognized by the concave shape of the P-face and the accumulation of IMPs. (A,B) Immunoparticles for SK2 (10 nm particles, red arrowheads) were found within the AZ co-clustering with immunoparticles for CaV2.1 (5 nm particles, blue arrowheads). A few immunoparticles for SK2 were also observed along the extrasynaptic site (double arrowheads) of ATs. Scale bars: (A,B) 0.2 μm. (C) NNDs from SK2 to CaV2.1 and in AZs. The NNDs from SK2 to real and simulated CaV2.1 immunoparticles were generated using the same numbers of CaV2.1 immunoparticles in the same compartment areas, showing no significant differences (p > 0.05, Kruskal-Wallis test). Insert is an example showing simulation of Cav2.1 immunoparticles in an AZ. Scale bar: 0.2 μm. (D) A high variability in the number of SK2 (range: 3–21) and CaV2.1 (range: 4–24) immunoparticles was found at the AZs. Box chart shows 5th, 25th, 75th and 95th percentiles and median (bar). (E) Histogram showing the densities of SK2 and CaV2.1 immunoparticles at the AZ and extrasynaptic sites of ATs. The density of both SK2 and CaV2.1 immunoparticles was significantly larger at the AZs (SK2 = 104.10 ± 32.87/ μm2; CaV2.1 = 125.50 ± 26.61/μm2) than at extrasynaptic sites (Extra; SK2 = 47.24 ± 22.81/ μm2; CaV2.1 = 14.95 ± 5.93/μm2; Kruskal–Wallis test, pairwise Mann–Whitney U test and Dunns method, *p < 0.001).

Similar articles

Cited by

References

    1. Altman J., Bayer S. A. (1997). Development of the Cerebellar System in Relation to its Evolution, Structure and Functions. New York, NY: CRC Press.
    1. Araki K., Meguro H., Kushiya E., Takayama C., Inoue Y., Mishina M. (1993). Selective expression of the glutamate receptor channel delta 2 subunit in cerebellar Purkinje cells. Biochem. Biophys. Res. Commun. 197, 1267–1276. 10.1006/bbrc.1993.2614 - DOI - PubMed
    1. Ballesteros-Merino C., Lin M., Wu W. W., Ferrandiz-Huertas C., Cabañero M. J., Watanabe M., et al. . (2012). Developmental profile of SK2 channel expression and function in CA1 neurons. Hippocampus 22, 1467–1480. 10.1002/hipo.20986 - DOI - PMC - PubMed
    1. Ballesteros-Merino C., Martínez-Hernández J., Aguado C., Watanabe M., Adelman J. P., Luján R. (2014a). Localization of SK2 channels relative to excitatory synaptic sites in the mouse developing Purkinje cells. Front. Neuroanat. 8:154. 10.3389/fnana.2014.00154 - DOI - PMC - PubMed
    1. Ballesteros-Merino C., Watanabe M., Shigemoto R., Fukazawa Y., Adelman J. P., Luján R. (2014b). Differential subcellular localization of SK3-containing channels in the hippocampus. Eur. J. Neurosci. 39, 883–892. 10.1111/ejn.12474 - DOI - PubMed