

Active Tuberculosis Is Characterized by Highly Differentiated Effector Memory Th1 Cells
- PMID: 30283456
- PMCID: PMC6156157
- DOI: 10.3389/fimmu.2018.02127
Active Tuberculosis Is Characterized by Highly Differentiated Effector Memory Th1 Cells
Abstract
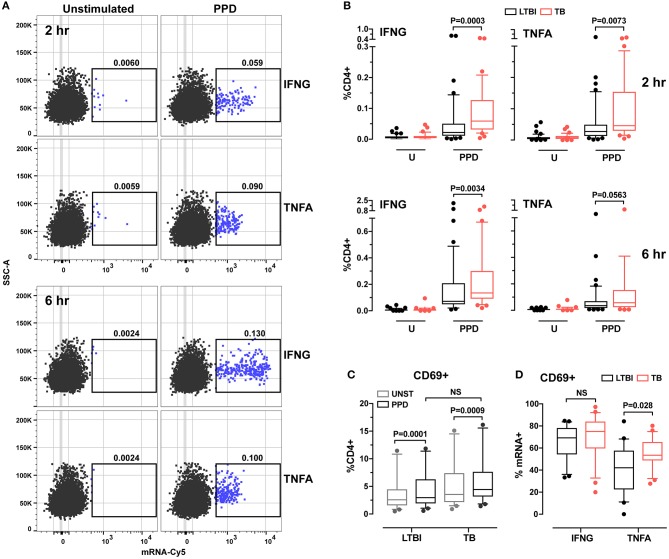
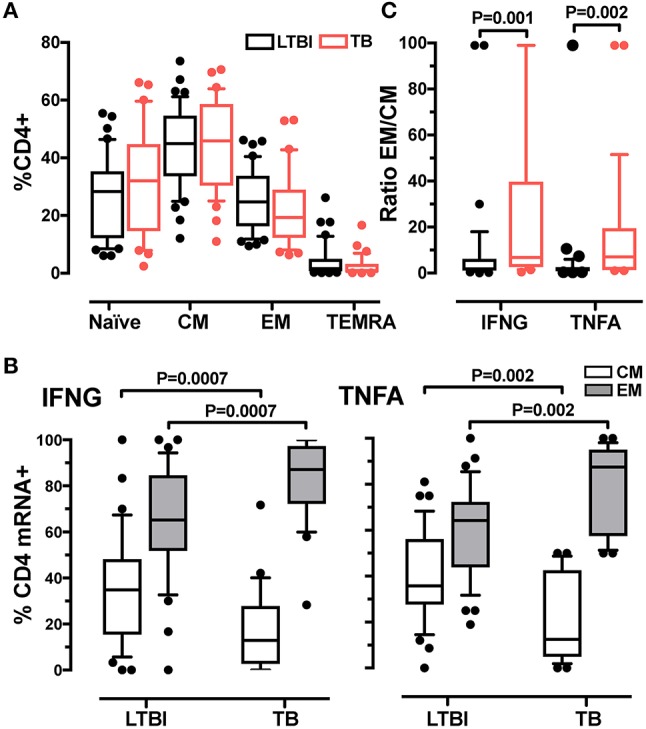
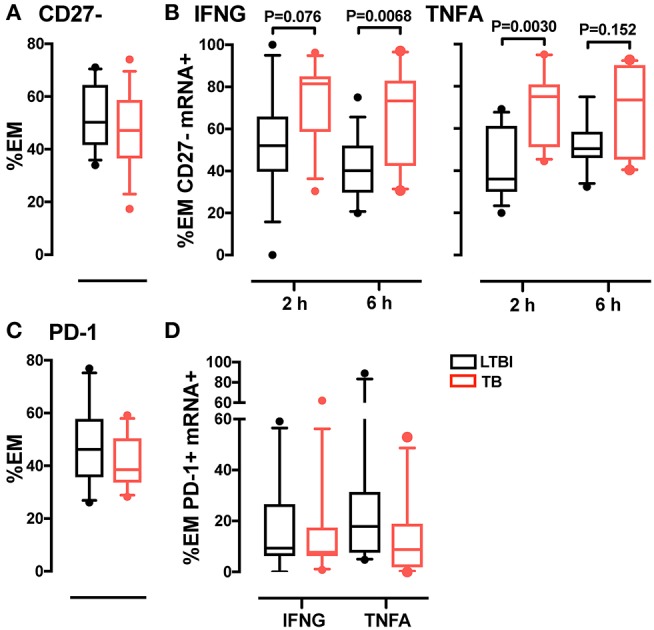
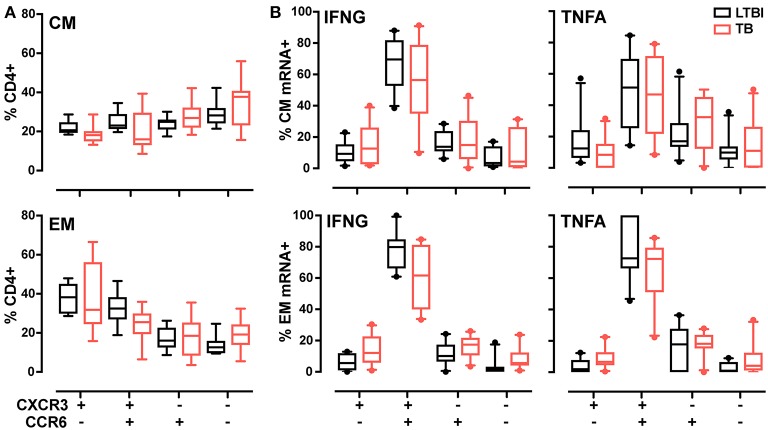
Despite advances in diagnosing latent Mycobacterium tuberculosis infection (LTBI), we still lack a diagnostic test that differentiates LTBI from active tuberculosis (TB) or predicts the risk of progression to active disease. One reason for the absence of such a test may be the failure of current assays to capture the dynamic complexities of the immune responses associated with various stages of TB, since these assays measure only a single parameter (release of IFN-γ) and rely on prolonged (overnight) T cell stimulation. We describe a novel, semi-automated RNA flow cytometry assay to determine whether immunological differences can be identified between LTBI and active TB. We analyzed antigen-induced expression of Th1 cytokine mRNA after short (2- and 6-h) stimulation with antigen, in the context of memory T cell immunophenotyping. IFNG and TNFA mRNA induction was detectable in CD4+ T cells after only 2 h of ex vivo stimulation. Moreover, IFNG- and TNFA-expressing CD4+ T cells (Th1 cells) were more frequent in active TB than in LTBI, a difference that is undetectable with conventional, protein-based cytokine assays. We also found that active TB was associated with higher ratios of effector memory to central memory Th1 cells than LTBI. This effector memory phenotype of active TB was associated with increased T cell differentiation, as defined by loss of the CD27 marker, but not with T cell exhaustion, as determined by PD-1 abundance. These results indicate that single-cell-based, mRNA measurements may help identify time-dependent, quantitative differences in T cell functional status between latent infection and active tuberculosis.
Keywords: FISH-Flow; T cell activation; cytokine; flow cytometry; immunophenotyping; memory T cells; single-cell gene expression.
Figures
Similar articles
-
HBHA induces IL-10 from CD4+ T cells in patients with active tuberculosis but IFN-γ and IL-17 from individuals with Mycobacterium tuberculosis infection.Front Immunol. 2024 Aug 27;15:1422700. doi: 10.3389/fimmu.2024.1422700. eCollection 2024. Front Immunol. 2024. PMID: 39257584 Free PMC article.
-
Study of CD27 and CCR4 Markers on Specific CD4+ T-Cells as Immune Tools for Active and Latent Tuberculosis Management.Front Immunol. 2019 Jan 9;9:3094. doi: 10.3389/fimmu.2018.03094. eCollection 2018. Front Immunol. 2019. PMID: 30687314 Free PMC article.
-
Polyfunctional T-cells and effector memory phenotype are associated with active TB in HIV-infected patients.J Infect. 2014 Dec;69(6):533-45. doi: 10.1016/j.jinf.2014.06.009. Epub 2014 Jun 26. J Infect. 2014. PMID: 24975174
-
[Evolution of IGRA researches].Kekkaku. 2008 Sep;83(9):641-52. Kekkaku. 2008. PMID: 18979999 Review. Japanese.
-
Cell Differentiation Degree as a Factor Determining the Role for Different T-Helper Populations in Tuberculosis Protection.Front Immunol. 2019 May 8;10:972. doi: 10.3389/fimmu.2019.00972. eCollection 2019. Front Immunol. 2019. PMID: 31134070 Free PMC article. Review.
Cited by
-
HBHA induces IL-10 from CD4+ T cells in patients with active tuberculosis but IFN-γ and IL-17 from individuals with Mycobacterium tuberculosis infection.Front Immunol. 2024 Aug 27;15:1422700. doi: 10.3389/fimmu.2024.1422700. eCollection 2024. Front Immunol. 2024. PMID: 39257584 Free PMC article.
-
Immunogenicity and efficacy of an oral live-attenuated vaccine for bovine Johne's disease.Front Immunol. 2024 Jan 12;14:1307621. doi: 10.3389/fimmu.2023.1307621. eCollection 2023. Front Immunol. 2024. PMID: 38283338 Free PMC article.
-
Biological properties and diverse cytokine profiles followed by in vitro and in vivo infections with LSDV strain isolated in first outbreaks in Vietnam.Vet Res Commun. 2023 Dec;47(4):2005-2016. doi: 10.1007/s11259-023-10158-2. Epub 2023 Jun 29. Vet Res Commun. 2023. PMID: 37382734
-
Multimodally profiling memory T cells from a tuberculosis cohort identifies cell state associations with demographics, environment and disease.Nat Immunol. 2021 Jun;22(6):781-793. doi: 10.1038/s41590-021-00933-1. Epub 2021 May 24. Nat Immunol. 2021. PMID: 34031617 Free PMC article.
-
Epidemiological and Cytokine Profile of Patients with Pulmonary and Extrapulmonary Tuberculosis in a Population of the Brazilian Amazon.Microorganisms. 2022 Oct 20;10(10):2075. doi: 10.3390/microorganisms10102075. Microorganisms. 2022. PMID: 36296351 Free PMC article.
References
Publication types
MeSH terms
Substances
Grants and funding
LinkOut - more resources
Full Text Sources
Medical
Research Materials