. 2018 Sep 19:9:2131.
doi: 10.3389/fimmu.2018.02131. eCollection 2018.

Intrinsic Programming of Alveolar Macrophages for Protective Antifungal Innate Immunity Against Pneumocystis Infection

Affiliations

Intrinsic Programming of Alveolar Macrophages for Protective Antifungal Innate Immunity Against Pneumocystis Infection

Samir P Bhagwat et al. Front Immunol. .

Abstract

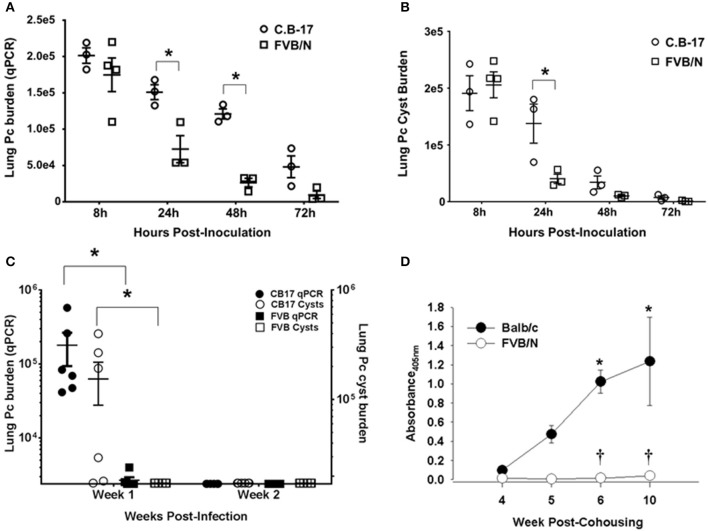
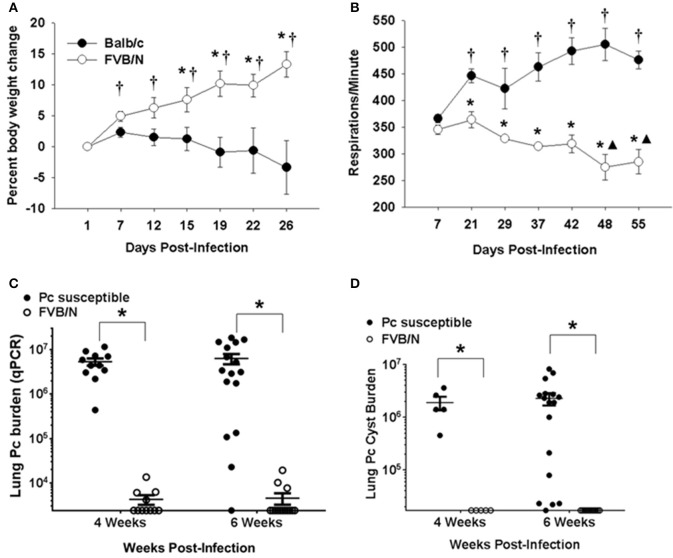
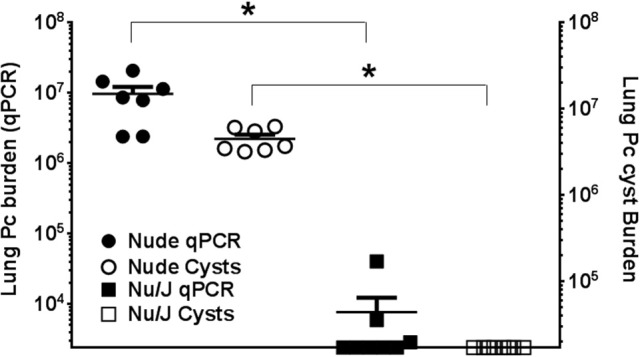
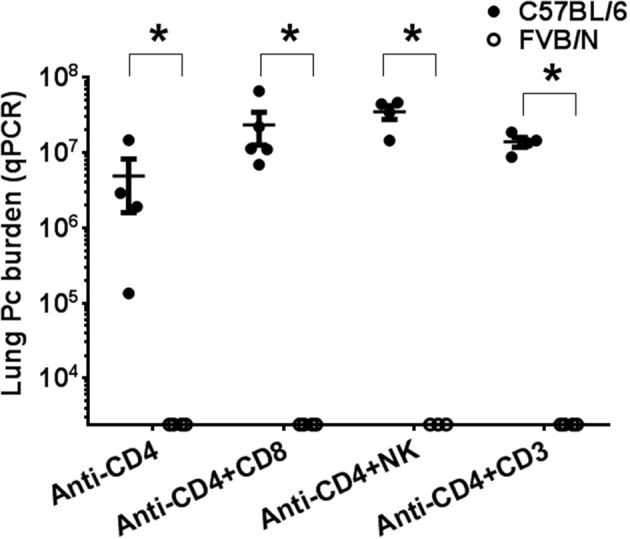
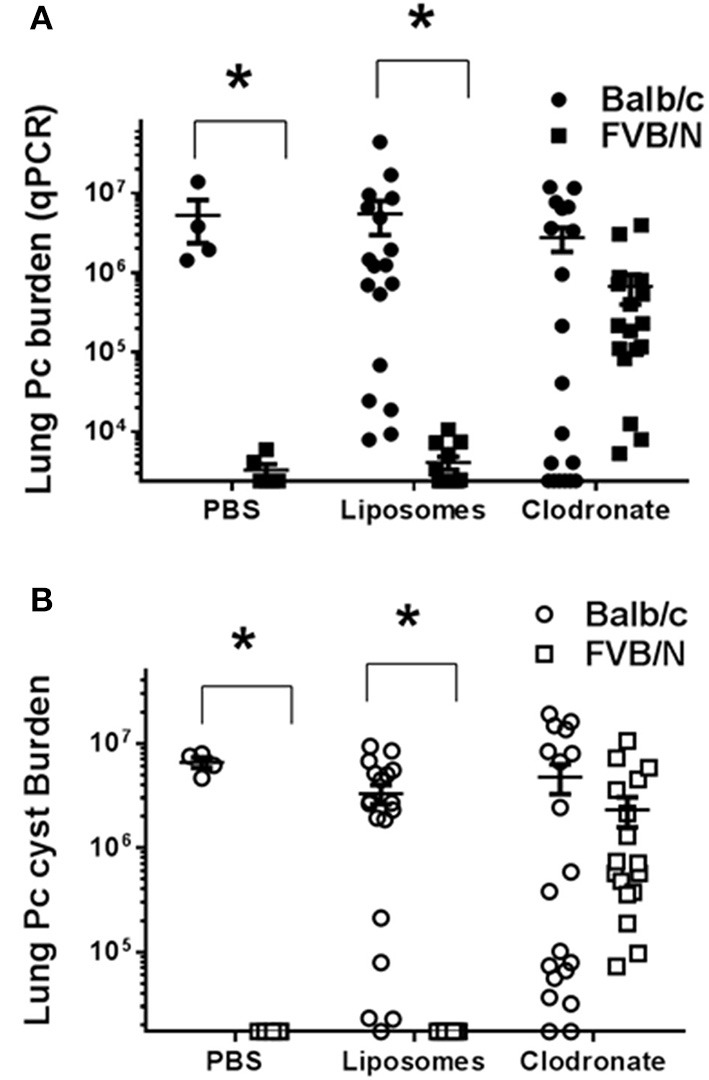
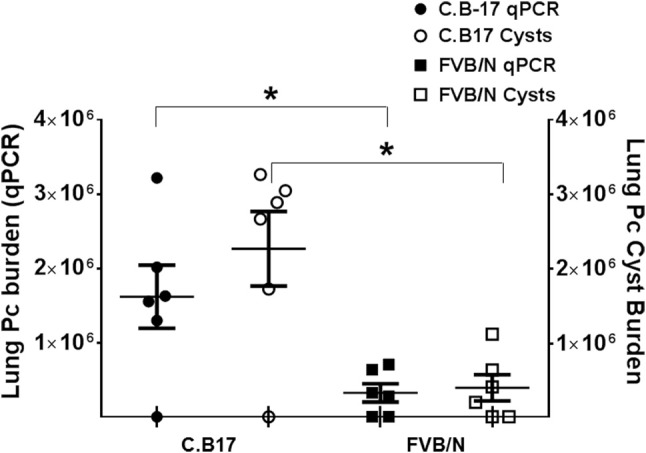
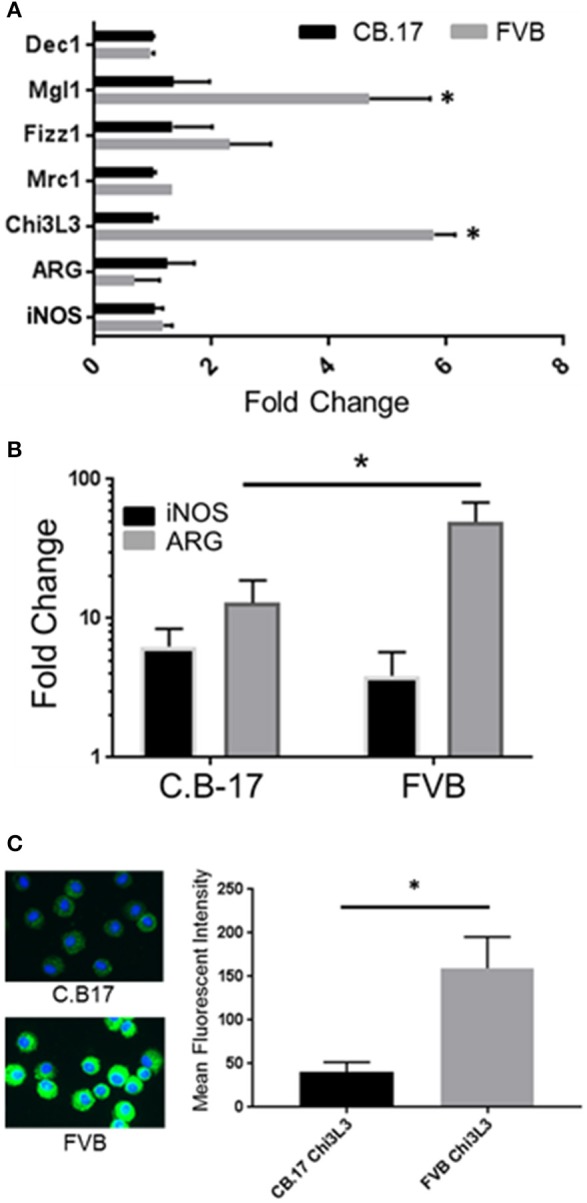
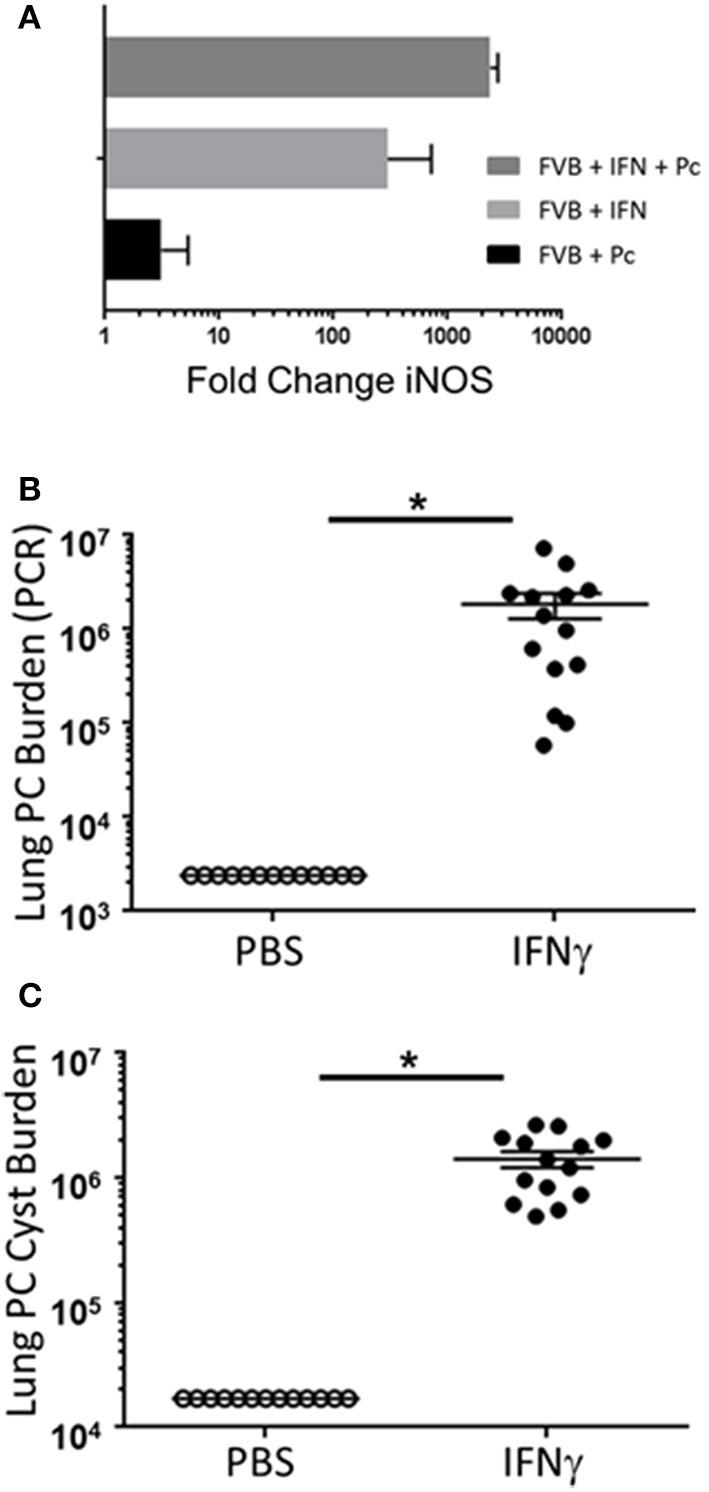
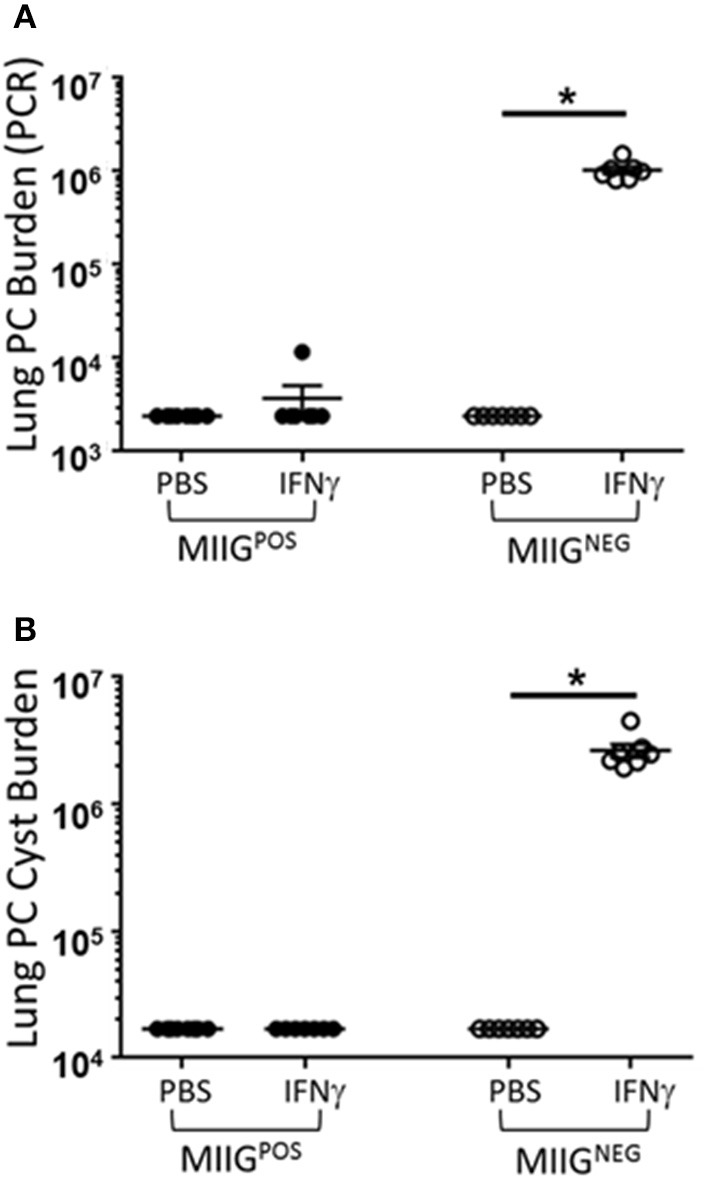
Invasive fungal infections, including Pneumocystis Pneumonia (PcP), remain frequent life-threatening conditions of patients with adaptive immune defects. While innate immunity helps control pathogen growth early during infection, it is typically not sufficient for complete protection against Pneumocystis and other human fungal pathogens. Alveolar macrophages (AM) possess pattern recognition molecules capable of recognizing antigenic and structural determinants of Pneumocystis. However, this pathogen effectively evades innate immunity to infect both immunocompetent and immunosuppressed hosts, albeit with differing outcomes. During our studies of mouse models of PcP, the FVB/N strain was identified as unique because of its ability to mount a protective innate immune response against Pneumocystis infection. In contrast to other immunocompetent strains, which become transiently infected prior to the onset of adaptive immunity, FVB/N mice rapidly eradicated Pneumocystis before an adaptive immune response was triggered. Furthermore, FVB/N mice remained highly resistant to infection even in the absence of functional T cells. The effector mechanism of innate protection required the action of functional alveolar macrophages, and the adoptive transfer of resistant FVB/N AMs, but not susceptible CB.17 AMs, conferred protection to immunodeficient mice. Macrophage IFNγ receptor signaling was not required for innate resistance, and FVB/N macrophages were found to display markers of alternative activation. IFNγ reprogrammed resistant FVB/N macrophages to a permissive M1 biased phenotype through a mechanism that required direct activation of the macrophage IFNγR. These results demonstrate that appropriately programmed macrophages provide protective innate immunity against this opportunistic fungal pathogen, and suggest that modulating macrophage function may represent a feasible therapeutic strategy to enhance antifungal host defense. The identification of resistant and susceptible macrophages provides a novel platform to study not only the mechanisms of macrophage-mediated antifungal defense, but also the mechanisms by which Pneumocystis evades innate immunity.

Keywords: alveolar macrophage; fungal pathogens; innate immunity; mouse models; pneumocystis.


Figures

Figure 1
Figure 1
Rapid innate Pneumocystis clearance kinetics in FVB mice. Pc burden in the lungs of intra-tracheally infected mice was determined by quantitative real time PCR of the Pc kexin gene or Pc cyst counts in GMS stained lung homogenates. (A,B) Pc kexin copies and cyst count data, respectively, over a range of 8 to 72 h post-inoculation. The symbols represent data values for individual mice, and the horizontal lines and error bars show the mean ± 1 SEM. *p < 0.05 as compared to C.B-17 at that time point. (C) The Pc burden in C.B-17 and FVB mice at 1 and 2 weeks post-inoculation is shown, with the symbol key given on the graphs. The symbols represent data values for individual mice, and the horizontal lines and error bars show the mean ± 1 standard error measurement (SEM) for each group (n = 6 per group). Statistically significant differences are designated as *p < 0.05 as compared to C.B-17. (D) Anti-Pc ELISA antibody titers from the sera of experimental mice co-housed with infected SCID mice expressed as absorbance at 405 nm. Data are mean ± 1 SEM (n ≥ 4 mice at each time point). *p < 0.05 compared to Balb/c at week 4 or p < 0.05 compared to Balb/c at a particular time point.
Figure 2
Figure 2
Innate protection against PcP in CD4-depleted FVB mice. Pc susceptible (Balb/c or C.B-17) and FVB mice were CD4 depleted and infected with Pc. (A) Percent body weight loss for experimental mice is plotted against the days post-infection. Each data point is the mean ± 1 SEM for a given mouse strain at the designated time (n = 6 mice per group at each time). Significant values are p < 0.05 compared to either the *mean weight change of the Balb/c group on that particular day or the mean weight change of the FVB group on day 1 post infection. (B) Changes in the respiratory rates (respirations per minute) are plotted against the days post-infection. Each data point is the mean ± 1 SEM for a given mouse strain at a designated time (n = 4 for Balb/c and n = 3 for FVB). Significant values are p < 0.05 compared to either the mean respiratory rate of Balb/c group on day 7, the mean respiratory rate of FVB group on day 7, or *the mean respiratory rate of Balb/c group on that particular day. (C,D) Pc lung burden as determined by quantitation of Pneumocystis kexin gene copies (C) or by Pc cyst counts (D) in experimental mice at 4 or 6 weeks post-infection. The symbols show data values for individual mice, and horizontal lines and error bars show the mean ± 1 SEM for each group (n ≥ 11 for qPCR data and n ≥ 5 for cyst data). Significant values are *p < 0.05 for FVB mice compared to the Pc-susceptible group.
Figure 3
Figure 3
Comparison of Pc burden in nude mouse strains. Lung Pc burden in infected nude mouse strains 6 weeks after infection, as determined by qPCR of the Pc kexin gene (shaded symbols) or Pc cyst counts (open symbols) as determined by GMS stain. Symbols represent data values for individual mice. Horizontal lines and error bars represent mean ± 1 SEM for each mouse group (n ≥ 7). Balb/c nude: circles; Nu/J: squares. *p < 0.05 compared to the Balb/c nude mouse group.
Figure 4
Figure 4
Comparison of Pneumocystis infection in mice depleted of immune cell subsets. CD4-depleted C57BL/6 (shaded circles) and FVB (open circles) mice treated with either anti-CD8, anti-NK1.1, or anti-CD3 antibodies were intra-tracheally inoculated with Pc organisms. Pc lung burden at 6 weeks post-infection was determined by qPCR of the Pc kexin gene. The symbols show data values for individual mice, and horizontal lines and error bars are mean ± 1 SEM for each group (n = 3–5). Statistically significant values are *p < 0.05 compared to the C57BL/6 group receiving the same treatment.
Figure 5
Figure 5
Comparison of Pneumocystis infection in mice depleted of alveolar macrophages. Lung Pc burden was determined by quantitative real time PCR of the Pc-specific kexin gene (A) or cyst counts as determined by GMS staining (B). Balb/c (circles) or FVB/n mice (squares) were intra-tracheally instilled with either PBS, PBS-liposomes, or alveolar macrophage-depleting clodronate-liposomes, and then infected with Pneumocystis. Results shown are pooled from three independent experiments (see Table 1 for the results of each individual experiment). The symbols in the figure give values for individual mice in each group (n = 4–13 mice per group). Horizontal lines and error bars show the mean ± 1 SEM for the different groups, with statistical significance indicated as *p < 0.05 for FVB/n mice compared to Balb/c mice for a given treatment.
Figure 6
Figure 6
Pc burden in RAG2 mice reconstituted with alveolar macrophages from C.B17 or FVB mice. Freshly isolated AMs from either C.B17 or FVB mice were intra-tracheally instilled into RAG2 mice that had been depleted of endogenous AMs with clodronate. The RAG2 mice were then infected and Pc lung burdens were determined after 4 weeks by quantitative real time PCR of Pc-specific kexin gene (filled symbols) or by Pc cyst counts (clear symbols). The symbols represent data for individual mice, and horizontal lines and error bars show the mean ± 1 SEM of the different groups (n = 6). *p < 0.05 for FVB AM recipient mice compared to C.B17 AM recipient mice.
Figure 7
Figure 7
Susceptibility of hybrid mice generated by crossing resistant and susceptible mice. CD4-depleted mice of designated strains were infected and lung Pc burden at 5 weeks post-infection was determined by qPCR of the Pc kexin gene (filled circles and left axis) or Pc cysts counts by GMS stain (open circles and right axis). To generate crosses, either male C.B-17 mice were bred with female FVB mice (C.B-17 × FVB), or male FVB mice were bred with female C.B-17 mice (FVBN × C.B-17). All hybrid mice were resistant to Pneumocystis infection. The symbols show data values for individual mice, and the horizontal lines and error bars show mean ± 1 SEM for the different groups (n ≥ 8). *p < 0.05 compared to qPCR mean of susceptible strain; p < 0.05, compared to the cyst count mean of the susceptible strain.
Figure 8
Figure 8
FVB alveolar macrophages display markers of M2 bias. Alveolar macrophages were obtained from FVB or C.B-17 mice by bronchoalveolar lavage. Total RNA was isolated from unstimulated AMs (A) or AMs stimulated for 6 h with freshly isolated Pneumocystis (B). Reverse transcriptase real-time PCR was used to quantify the relative expression of M1 and M2 associated markers. Greater expression of the M2 marker CHI3L3 in FVB macrophages was confirmed at the protein level by immunofluorescence staining of freshly isolated C.B-17 and FVB AMs (C). The bars represent the mean ± 1 SEM of fold change in gene expression in (A,B) (n = 3–6). The bars represent the mean fluorescent intensity ± 1 SEM in (C) (n > 300 cells). *p < 0.05 for FVB AMs compared to C.B17 AMs.
Figure 9
Figure 9
The Th1 cytokine IFNγ reprograms resistant FVB mice to a susceptible phenotype. Alveolar macrophages from FVB mice were cultured with IFNγ, Pc, or both for 6 h. Total RNA was isolated and reverse transcriptase real-time PCR was used to quantify the relative expression of the M1 marker iNOS (A). The bars represent the fold change in gene expression compared to control untreated FVB alveolar macrophages (n = 6). CD4-depleted FVB mice were administered 2 μg of recombinant IFNγ or PBS vehicle via tracheal instillation on days −3 and −1 prior to infection with 5e5 mouse Pneumocystis organisms, and then every 3 days thereafter for the duration of the study. Lung Pc burden was measured at 5 weeks post-infection by qPCR of the Pc kexin gene (B), and by Pc cyst counts of GMS stained lung homogenates (C). Symbols represent data values for individual mice. Horizontal lines and error bars represent mean ± 1 SEM for each mouse group (n ≥ 13 per group). PBS treated mice: open circles; IFNγ treated mice: closed circles. *p < 0.05.
Figure 10
Figure 10
IFNγ directly reprograms resistant FVB macrophages to a Pc susceptible phenotype. FVB WT mice were crossed with C57BL/6 MIIG+/− transgenic mice. MIIG positive and MIIG negative (WT) mice were identified and CD4-depleted. Groups of MIIG positive and MIIG negative mice were administered either 2 μg of recombinant IFNγ or PBS vehicle via tracheal instillation on days −3 and −1 prior to infection with 5e5 mouse Pneumocystis organisms, and then every 3 days thereafter for the duration of the study. Lung Pc burden was measured at 5 weeks post-infection by qPCR of the Pc kexin gene (A), and by Pc cyst counts of GMS stained lung homogenates (B). Symbols represent data values for individual mice. Horizontal lines and error bars represent mean ± 1 SEM for each mouse group (n ≥ 7 per group). MIIG negative mice: open circles; MIIG positive mice: closed circles. *p < 0.05.

Similar articles

Cited by

References

    1. Morris A, Lundgren JD, Masur H, Walzer PD, Hanson DL, Frederick T, et al. . Current epidemiology of Pneumocystis pneumonia. Emerg Infect Dis. (2004) 10:1713–20. 10.3201/eid1010.030985 - DOI - PMC - PubMed
    1. Kaplan JE, Hanson D, Dworkin MS, Frederick T, Bertolli J, Lindegren ML, et al. . Epidemiology of human immunodeficiency virus-associated opportunistic infections in the United States in the era of highly active antiretroviral therapy. Clin Infect Dis. (2000) 30(Suppl. 1):S5–14. 10.1086/313843 - DOI - PubMed
    1. Avino LJ, Naylor SM, Roecker AM. Pneumocystis jirovecii Pneumonia in the Non-HIV-Infected population. Ann Pharmacother. (2016) 50:673–9. 10.1177/1060028016650107 - DOI - PubMed
    1. Morris A, Norris KA. Colonization by Pneumocystis jirovecii and its role in disease. Clin Microbiol Rev. (2012) 25:297–317. 10.1128/CMR.00013-12 - DOI - PMC - PubMed
    1. Vargas SL, Hughes WT, Santolaya ME, Ulloa AV, Ponce CA, Cabrera CE, et al. . Search for primary infection by Pneumocystis carinii in a cohort of normal, healthy infants. Clin Infect Dis. (2001) 32:855–61. 10.1086/319340 - DOI - PubMed

Publication types

MeSH terms