

The genomic basis of cichlid fish adaptation within the deepwater "twilight zone" of Lake Malawi
- PMID: 30283648
- PMCID: PMC6124600
- DOI: 10.1002/evl3.20
The genomic basis of cichlid fish adaptation within the deepwater "twilight zone" of Lake Malawi
Abstract
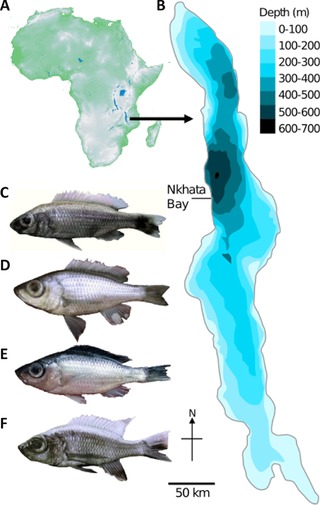
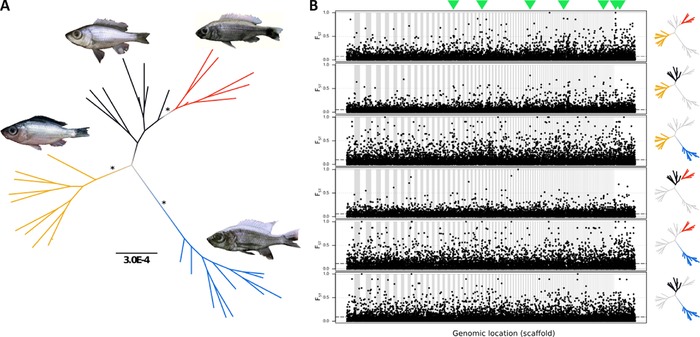
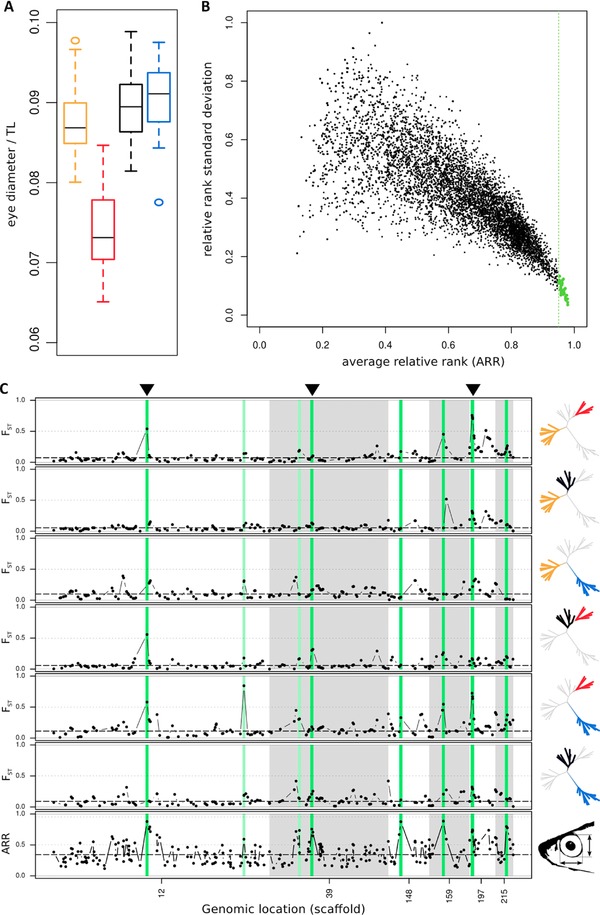
Deepwater environments are characterized by low levels of available light at narrow spectra, great hydrostatic pressure, and low levels of dissolved oxygen-conditions predicted to exert highly specific selection pressures. In Lake Malawi over 800 cichlid species have evolved, and this adaptive radiation extends into the "twilight zone" below 50 m. We use population-level RAD-seq data to investigate whether four endemic deepwater species (Diplotaxodon spp.) have experienced divergent selection within this environment. We identify candidate genes including regulators of photoreceptor function, photopigments, lens morphology, and haemoglobin, many not previously implicated in cichlid adaptive radiations. Colocalization of functionally linked genes suggests coadapted "supergene" complexes. Comparisons of Diplotaxodon to the broader Lake Malawi radiation using genome resequencing data revealed functional substitutions and signatures of positive selection in candidate genes. Our data provide unique insights into genomic adaptation within deepwater habitats, and suggest genome-level specialization for life at depth as an important process in cichlid radiation.
Keywords: Root effect; cichlid; hemoglobin; sensory drive; supergene.
Figures
Similar articles
-
African cichlid fish: a model system in adaptive radiation research.Proc Biol Sci. 2006 Aug 22;273(1597):1987-98. doi: 10.1098/rspb.2006.3539. Proc Biol Sci. 2006. PMID: 16846905 Free PMC article. Review.
-
Genomic signatures of divergent selection and speciation patterns in a 'natural experiment', the young parallel radiations of Nicaraguan crater lake cichlid fishes.Mol Ecol. 2012 Oct;21(19):4770-86. doi: 10.1111/j.1365-294X.2012.05738.x. Epub 2012 Aug 30. Mol Ecol. 2012. PMID: 22934802
-
Ancient hybridization and phenotypic novelty within Lake Malawi's cichlid fish radiation.Mol Biol Evol. 2012 Jan;29(1):195-206. doi: 10.1093/molbev/msr183. Epub 2011 Nov 22. Mol Biol Evol. 2012. PMID: 22114359
-
High levels of interspecific gene flow in an endemic cichlid fish adaptive radiation from an extreme lake environment.Mol Ecol. 2015 Jul;24(13):3421-40. doi: 10.1111/mec.13247. Epub 2015 Jun 19. Mol Ecol. 2015. PMID: 25997156 Free PMC article.
-
The species flocks of East African cichlid fishes: recent advances in molecular phylogenetics and population genetics.Naturwissenschaften. 2004 Jun;91(6):277-90. doi: 10.1007/s00114-004-0528-6. Epub 2004 Apr 20. Naturwissenschaften. 2004. PMID: 15241604 Review.
Cited by
-
Comparative Transcriptomics Reveals Patterns of Adaptive Evolution Associated with Depth and Age Within Marine Rockfishes (Sebastes).J Hered. 2019 May 7;110(3):340-350. doi: 10.1093/jhered/esy070. J Hered. 2019. PMID: 30602025 Free PMC article.
-
Evolution of miRNA-Binding Sites and Regulatory Networks in Cichlids.Mol Biol Evol. 2022 Jul 2;39(7):msac146. doi: 10.1093/molbev/msac146. Mol Biol Evol. 2022. PMID: 35748824 Free PMC article.
-
The Genomic Substrate for Adaptive Radiation: Copy Number Variation across 12 Tribes of African Cichlid Species.Genome Biol Evol. 2019 Oct 1;11(10):2856-2874. doi: 10.1093/gbe/evz185. Genome Biol Evol. 2019. PMID: 31504491 Free PMC article.
-
Contrasting Host-Parasite Population Structure: Morphology and Mitogenomics of a Parasitic Flatworm on Pelagic Deepwater Cichlid Fishes from Lake Tanganyika.Biology (Basel). 2021 Aug 18;10(8):797. doi: 10.3390/biology10080797. Biology (Basel). 2021. PMID: 34440029 Free PMC article.
-
Dynamic Outlier Slicing Allows Broader Exploration of Adaptive Divergence: A Comparison of Individual Genome and Pool-Seq Data Linked to Humic Adaptation in Perch.Mol Ecol. 2025 Jan 23;34(4):e17659. doi: 10.1111/mec.17659. Online ahead of print. Mol Ecol. 2025. PMID: 39846218 Free PMC article.
References
-
- Andersen, O. 2012. Hemoglobin polymorphisms in Atlantic cod—a review of 50 years of study. Mar. Genomics 8:59–65. - PubMed
LinkOut - more resources
Full Text Sources
Miscellaneous
