

Clines on the seashore: The genomic architecture underlying rapid divergence in the face of gene flow
- PMID: 30283683
- PMCID: PMC6121805
- DOI: 10.1002/evl3.74
Clines on the seashore: The genomic architecture underlying rapid divergence in the face of gene flow
Abstract
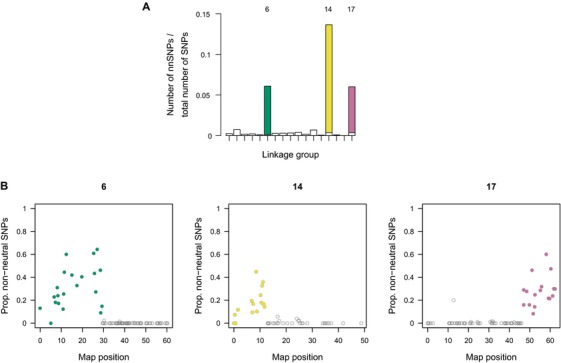
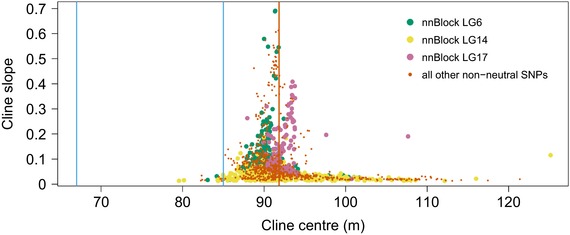
Adaptive divergence and speciation may happen despite opposition by gene flow. Identifying the genomic basis underlying divergence with gene flow is a major task in evolutionary genomics. Most approaches (e.g., outlier scans) focus on genomic regions of high differentiation. However, not all genomic architectures potentially underlying divergence are expected to show extreme differentiation. Here, we develop an approach that combines hybrid zone analysis (i.e., focuses on spatial patterns of allele frequency change) with system-specific simulations to identify loci inconsistent with neutral evolution. We apply this to a genome-wide SNP set from an ideally suited study organism, the intertidal snail Littorina saxatilis, which shows primary divergence between ecotypes associated with different shore habitats. We detect many SNPs with clinal patterns, most of which are consistent with neutrality. Among non-neutral SNPs, most are located within three large putative inversions differentiating ecotypes. Many non-neutral SNPs show relatively low levels of differentiation. We discuss potential reasons for this pattern, including loose linkage to selected variants, polygenic adaptation and a component of balancing selection within populations (which may be expected for inversions). Our work is in line with theory predicting a role for inversions in divergence, and emphasizes that genomic regions contributing to divergence may not always be accessible with methods purely based on allele frequency differences. These conclusions call for approaches that take spatial patterns of allele frequency change into account in other systems.
Keywords: clines; hybrid zones; inversions; local adaptation; molluscs; speciation.
Figures


References
-
- Abbott, R. , Albach D., Ansell S., Arntzen J. W., Baird S. J. E., Bierne N., et al. 2013. Hybridization and speciation. J. Evol. Biol. 26:229–246. - PubMed
-
- Aulchenko, Y. S. , Ripke S., Isaacs A., Duijn V., and M C. 2007. GenABEL: an R library for genome‐wide association analysis. Bioinformatics 23:1294–1296. - PubMed
-
- Barth, J. M. I. , Berg P. R., Jonsson P. R., Bonanomi S., Corell H., Hemmer‐Hansen J., et al. 2017. Genome architecture enables local adaptation of Atlantic cod despite high connectivity. Mol. Ecol. 26:4452–4466. - PubMed
-
- Barton, N. H. , and Gale K. S.. 1993. Genetic analysis of hybrid zones. In: R. G. Harrison, ed. Hybrid zones and the evolutionary process. Oxford Univ. Press, New York.
-
- Barton, N. H. , and Hewitt G. M.. 1985. Analysis of hybrid zones. Annu. Rev. Ecol. Syst. 16:113–148.
Associated data
LinkOut - more resources
Full Text Sources
Other Literature Sources
Molecular Biology Databases
Research Materials
Miscellaneous
