. 2017 Jun 28;1(1):46-57.
doi: 10.1002/jbm4.10009. eCollection 2017 Aug.

The CRH-Transgenic Cushingoid Mouse Is a Model of Glucocorticoid-Induced Osteoporosis

Affiliations

The CRH-Transgenic Cushingoid Mouse Is a Model of Glucocorticoid-Induced Osteoporosis

Jasmine Williams-Dautovich et al. JBMR Plus. .

Abstract

Glucocorticoids (GCs) have unparalleled anti-inflammatory and immunosuppressive properties, which accounts for their widespread prescription and use. Unfortunately, a limitation to GC therapy is a wide range of negative side effects including Cushing's syndrome, a disease characterized by metabolic abnormalities including muscle wasting and osteoporosis. GC-induced osteoporosis occurs in 30% to 50% of patients on GC therapy and thus, represents an important area of study. Herein, we characterize the molecular and physiologic effects of GC-induced osteoporosis using the Cushing's mouse model, the corticotropin releasing hormone (CRH) transgenic mouse (CRH-Tg). The humeri, femurs, and tibias from wild-type (WT) and CRH-Tg male mice, aged 13 to 14 weeks old were subjected to multiple bone tests including, micro-computed tomography (μCT), static and dynamic histomorphometry, strength testing, and gene expression analyses. The CRH-Tg mice had a 38% decrease in cortical bone area, a 35% decrease in cortical thickness, a 16% decrease in trabecular thickness, a sixfold increase in bone adiposity, a 27% reduction in osteoid width, a 75% increase in bone-resorbing osteoclast number/bone surface, a 34% decrease in bone formation rate, and a 40% decrease in bone strength compared to WT mice. At the gene expression level, CRH-Tg bone showed significantly increased osteoclast markers and decreased osteoblast markers, whereas CRH-Tg muscle had increased muscle atrophy gene markers compared to WT mice. Overall, the CRH-Tg mouse model aged to 14 weeks recapitulated many features of osteoporosis in Cushing's syndrome and thus, represents a useful model to study GC-induced osteoporosis and interventions that target the effects of GCs on the skeleton. © 2017 The Authors. JBMR Plus is published by Wiley Periodicals, Inc. on behalf of the American Society for Bone and Mineral Research.

Keywords: BONE HISTOMORPHOMETRY; CORTICOSTEROIDS; CUSHING'S DISEASE; GENETIC ANIMAL MODELS; μCT.


Figures

Figure 1
Figure 1
CRH‐Tg mice display features of Cushing's syndrome such as increased adiposity and lymphoid organ atrophy. WT and CRH‐Tg mice at 13‐14 weeks of age were compared for differences in (A) plasma corticosterone, (B) body weight, (C) liver weight, (D) epididymal WAT weight, (E) overall adiposity in the abdominal cavity, (F) adrenal weight, and (G) spleen weight. Data represent the average ± SE; WT: n = 9 and CRH‐Tg: n = 6. *p < 0.05 WT versus CRH‐Tg using t test with Welch's correction. WAT = white adipose tissue.
Figure 2
Figure 2
Cortical and trabecular bone parameters are altered in CRH‐Tg mice relative to WT mice and CRH‐Tg mice at 13 to 14 weeks of age were compared for differences using μCT of trabecular (AF) and cortical (GM) bone compartments in the femur. (A) Representative image of trabecular bone reconstruction, (B) vBMD of trabecular bone, (C) BV/TV, (D) Tb.Th, (E) Tb.N, and (F) Tb.Sp. (G) Representative image of cortical bone reconstruction, (H) vBMD of cortical bone, (I) B.Ar, (J) Cs.Th, (K) Ct.Th, (L) AP, and (M) ML. Data were obtained from 13‐week‐old to 14‐week‐old male WT (n = 8 for trabecular and n = 9 for cortical parameters) and CRH‐Tg (n = 6) mice and represent the average ± SE. *p < 0.05 WT versus CRH‐Tg using t test with Welch's correction. One WT femur was broken around the area of interest for trabecular analysis and could not be analyzed. One outlier was removed from the WT group for I, J, M. One outlier was removed from CRH‐Tg group for C, D, I, J, K. vBMD = volumetric BMD; BV/TV = % bone volume; Tb.Th = trabecular thickness; Tb.N = trabecular number; Tb.Sp = trabecular separation; B.Ar = bone area; Cs.Th = cross‐sectional thickness; Ct.Th = cortical thickness; AP = anteroposterior diameter; ML = mediolateral diameter.
Figure 3
Figure 3
Adipocytes are significantly increased in the bone of CRH‐Tg mice compared to WT mice. Static histomorphometry of the proximal tibial metaphysis with trichrome staining of 13‐week‐old to 14‐week‐old male WT (n = 9) and CRH‐Tg (n = 6) mice. Measurements are (A) Ad.V/TV, (B) OV/BV, (C) OS/BS, (D) O.Wi, and (E) N.Ob/BS. (F) Representative image of trichrome staining of tibia. Data represent the average ± SE. *p < 0.05 WT versus CRH‐Tg using t test with Welch's correction. Ad.V/TV = adipocyte volume per tissue volume; OV/BV = percent osteoid volume per bone volume; OS/BS = percent of bone surface covered with osteoid; O.Wi = osteoid width; N.Ob/BS = number of osteoblasts per bone surface.
Figure 4
Figure 4
CRH‐Tg mice have an increase in osteoclasts compared to WT mice. Static histomorphometry of the proximal tibial metaphysis of 13‐week‐old to 14‐week‐old male WT (n = 9) and CRH‐Tg (n = 6) mice stained with the osteoclast marker TRAP. Measurements are (A) N.Oc/BS and (B) Oc.S/BS. Representative image from WT and CRH‐Tg mice tibias stained with TRAP (C). Data represent the average ± SE. *p < 0.05 WT versus CRH‐Tg using t test with Welch's correction. N.Oc/BS = number of osteoclasts per bone surface; Oc.S/BS = osteoclast surface per bone surface.
Figure 5
Figure 5
CRH‐Tg mice have reduced bone formation compared to WT mice. Dynamic histomorphometric analysis of proximal tibia from 14‐week old WT and CRH‐Tg mice after dual calcein labeling measuring (A) MS/BS; (B) BFR/BS; and (C) MAR. Data represent average ± SE, n = 10 to 11. *p < 0.05 WT versus CRH‐Tg using t test with Welch's correction. MS/BS = mineralizing surface per bone surface; BFR/BS = bone formation rate per bone surface; MAR = mineral apposition rate.
Figure 6
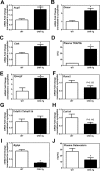
Figure 6
The expression of bone turnover genes is significantly increased and bone forming genes are significantly decreased in CRH‐Tg mice compared to WT mice. qPCR analysis of osteoclast markers: (A) TRAP (Acp5), (B) osteoclast associated receptor (Oscar), and (C) cathepsin K (Ctsk). (D) Plasma TRAP5b measured by ELISA. qPCR analysis of genes important in mesenchymal cell differentiation towards the adipocyte lineage (E) peroxisome proliferator‐activator receptor gamma‐2 (PPARg2), and (F) runt related transcription factor 2 (Runx2); (G) the ratio between receptor activator of nuclear factor kappa‐B ligand (Tnfsf11) and osteoprotegerin (Tnfrsf11b); and osteoblast markers: (H) collagen type 1 alpha 1 (Col1a1) and (I) osteocalcin (Bglap) from humeri of 13‐week‐old to 14‐week‐old male WT and CRH‐Tg mice. (J) Plasma osteocalcin measured by ELISA. All data shown have WT (n = 9) and CRH‐Tg (n = 6) except D, which has n = 5 per group. Data represent the average ± SE. *p < 0.05 WT versus CRH‐Tg using t test with Welch's correction. TRAP = tartrate resistant acid phosphatase.
Figure 7
Figure 7
Muscle atrophy gene expression is significantly increased in CRH‐Tg mice compared to WT mice. qPCR analysis of genes important in increasing muscle breakdown: (A) muscle ring finger 1, Murf (Trim63), (B) muscle atrophy F‐box, Mafbx (Fbxo32), (C) myostatin (Mstn), and (D) forkhead box protein 1 (Foxo1) in gastrocnemius of 13‐week‐old to 14‐week‐old male WT (n = 8) and CRH‐Tg (n = 6) mice. Data represent the average ± SE. *p < 0.05 WT versus CRH‐Tg using t test with Welch's correction.

References

    1. Overman RA, Toliver JC, Yeh JY, Gourlay ML, Deal CL. United States adults meeting 2010 American College of Rheumatology criteria for treatment and prevention of glucocorticoid‐induced osteoporosis. Arthritis Care Res (Hoboken). 2014; 66 (11):1644–52. - PubMed
    1. den Uyl D, Bultink IE, Lems WF. Advances in glucocorticoid‐induced osteoporosis. Curr Rheumatol Rep. 2011; 13 (3):233–40. - PMC - PubMed
    1. Hasselgren P‐O, Alamdari N, Aversa Z, Gonnella P, Smith IJ, Tizio S. Corticosteroids and muscle wasting role of transcription factors, nuclear cofactors, and hyperacetylation. Curr Opin Clin Nutr Metab Care. 2010; 13 (4):423. - PMC - PubMed
    1. Sharma ST, Nieman LK, Feelders RA. Cushing's syndrome: epidemiology and developments in disease management. Clin Epidemiol. 2015; 7:281. - PMC - PubMed
    1. Boehme SA, Gaur A, Crowe PD, et al. Immunosuppressive phenotype of corticotropin‐releasing factor transgenic mice is reversed by adrenalectomy. Cell Immunol. 1997; 176 (2):103–12. - PubMed

LinkOut - more resources