. 2019 Jun;44(6):1437-1445.
doi: 10.1007/s11064-018-2633-5. Epub 2018 Oct 3.

Identification of C-Terminal Binding Protein 1 as a Novel NMDA Receptor Interactor

Affiliations

Identification of C-Terminal Binding Protein 1 as a Novel NMDA Receptor Interactor

Sarah L Cousins et al. Neurochem Res. 2019 Jun.

Abstract

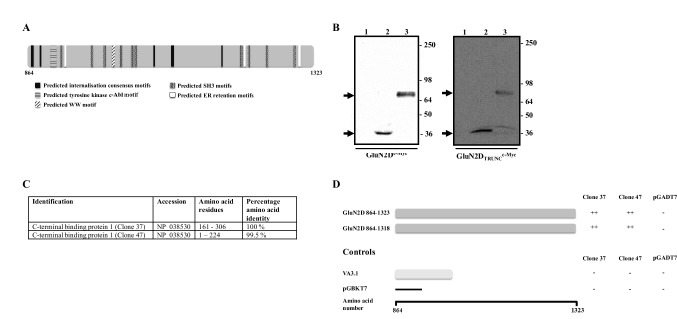
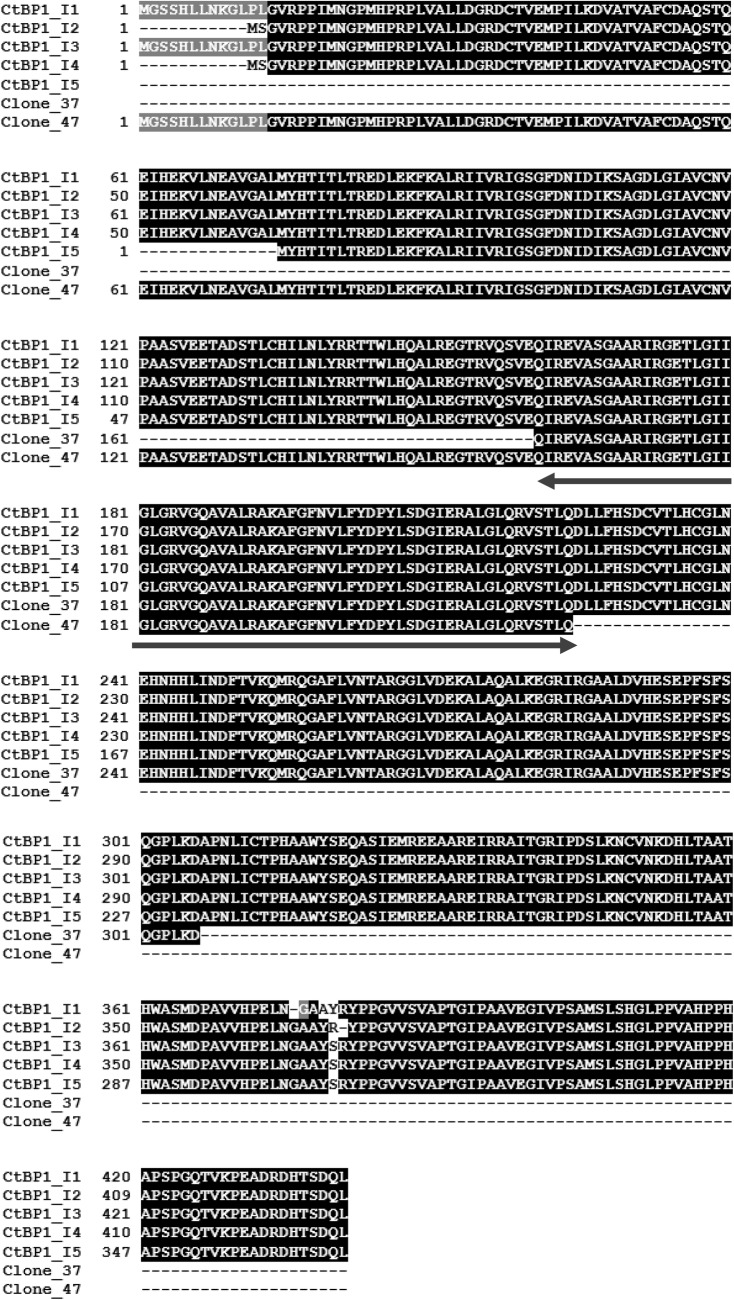
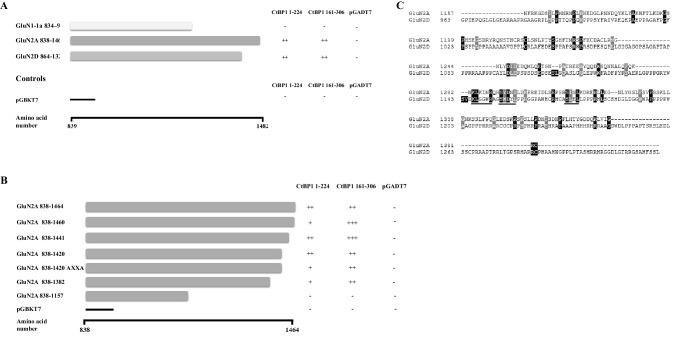
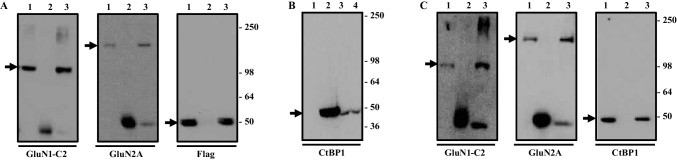
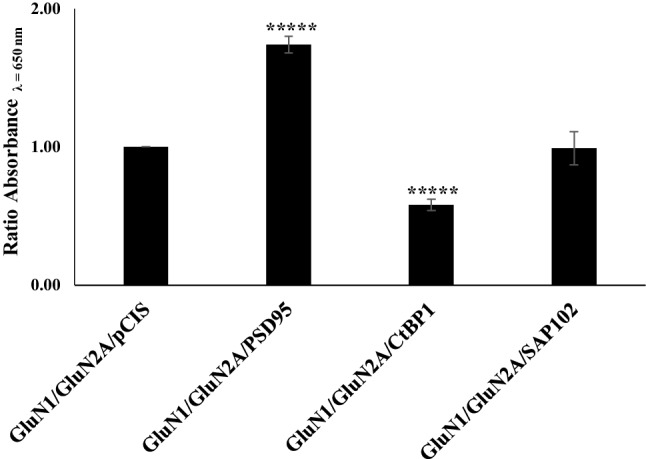
A new N-methyl D aspartate neurotransmitter receptor interacting protein has been identified by yeast two-hybrid screening of a mouse brain cDNA library. C-terminal binding protein 1 (CtBP1) was shown to associate with the intracellular C-terminal regions of the N-methyl D aspartate receptor subunits GluN2A and GluN2D but not with GluN1-1a cytoplasmic C-terminal region. In yeast mating assays using a series of GluN2A C-terminal truncations, it was demonstrated that the CtBP1 binding domain was localized to GluN2A 1157-1382. The GluN2A binding domain was identified to lie within the CtBP1 161-224 region. CtBP1 co-immunoprecipitated with assembled GluN1/GluN2A receptors expressed in mammalian cells and also, in detergent extracts of adult mouse brain. Co-expression of CtBP1 with GluN1/GluN2A resulted in a significant decrease in receptor cell surface expression. The family of C-terminal binding proteins function primarily as transcriptional co-repressors. However, they are also known to modulate intracellular membrane trafficking mechanisms. Thus the results reported herein describe a putative role for CtBP1 in the regulation of cell surface N-methyl D aspartate receptor expression.

Keywords: C-terminal binding protein; Ionotropic glutamate receptor; NMDA receptor; Protein–protein interaction.


Figures

Fig. 1
Fig. 1
A summary of cDNA library screening strategy and results. A Shows the intracellular C-terminal GluNR2D C-terminal domain highlighting putative protein–protein interaction domains. For B single colonies of AH109 yeast cells pre-transformed with pGBKT7GluNR2D 864–1323, pGBKT7GluNR2D 864–1318 or pGBKT7 were used to inoculate 5 ml—Trp selection media cultures which were then grown at 30 °C for 48 h at 250 rpm. Proteins were extracted from the resulting yeast cell pellets and analysed by immunoblotting using anti-c-Myc antibodies. The gel layout is the same for both immunoblots where: lane 1 = untransformed AH109 cells; lane 2 = pGBKT7 transformed AH109 cells and lane 3 = pGBKT7GluNR2D 864–1323 (GluN2Dc-Myc) or pGBKT7GluNR2D 864–1323 (GluN2DTrunc) transformed AH109 cells. Arrows denote the positions of GluNR2D 864–1323 and GluNR2D 864–1318. The immunoblots are representative of n = 3 independent transformations. Molecular weight markers × 103 are shown on the right hand side. C Is a summary of the characteristics of two interacting clones. D A schematic diagram showing the interactions between GluNR2D 864–1323 and GluNR2D 864–1318 and clones 37 and 47
Fig. 2
Fig. 2
An alignment of CtBP1 and NR2D C-terminal domain interacting clones, clone 37 and clone 47. An alignment of the five known isoforms of CtBP1 with putative interacting clones, 37 and 47. The arrow denotes the overlapping region shared by clone 37 and clone 47
Fig. 3
Fig. 3
Identification of the GluN2A amino acid sequence that mediates association with CtBP1 1–224 and C-tBP1 protein 161–306. A and B Y189 S. cerevisiae yeast cells transformed with C-terminal bait constructs, pGBKT7GluN1-1a 834–938, pGBKT7GluNR2A, pGBKT7GluNR2D 864–1323 or truncations, as shown of GluNR2A C-terminal bait constructs as shown and AH109 S. cerevisiae cells transformed with pGADT7CtBP1 1–224 or pGADT7CtBP1 161–306 were mated and grown on -Leu/-Trp/-His/-Ade agar plates, and the number of diploid colonies counted after 7 days of incubation at 30 °C all as described under “Experimental Procedures”. The figures depict the bait and fish constructs and the resulting diploid colonies.. The number of diploid colonies was semi-quantified by the number of colonies thus +++ = 500 +; ++ = 250–499; + = 1–241 and − = 0 colonies. C A schematic diagram highlighting possible protein–protein interaction motifs shared between GluNR2A and GluNR2D
Fig. 4
Fig. 4
CtBP1 co-immunoprecipitates with GluN2A expressed in HEK 293 cells and from native brain tissue. A and B HEK 293 cells were either co-transfected with GluN1-1a/GluN2A/CtBP1FLAG clones or pCIS or the CtBP1FLAG clones alone, cells cultured for 48 h, 100,000×g detergent extracts (A) or cell homogenates (B) were prepared and immunoprecipitations (A) or immunoblotting (B) carried out all as described in “Experimental Procedures”. Immunoprecipitations were carried out using with anti-GluN1 C2 or non-immune Ig antibodies and immunoblots were probed with anti-GluN1 C2, anti-GluNR2A (1381–1394) and anti-FLAG antibodies as shown. The results are representative of n = 3 independent transfections. B Immunoblots of transfected cell homogenates were probed with anti-CtBP antibodies. C Immunoprecipitations from 100,000×g detergent extracts of whole rat brain were carried out using anti-GluN1 C2 or non-immune Ig antibodies and immunoblots were probed with the antibodies as shown in the abscissa. The immunoblots are representative of n = 3 independent immunoprecipitations. For A and B the gel layout is the same where lane 1 = input; lane 2 = non-immune Ig pellet; lane 3 = anti = GluR1 C2 immune pellet. For C, lane 1 = HEK 293 cells transfected with pCIS; lanes 2–4, homogenates of HEK 293 cells transfected with the CtBP1FLAG clone where lane 2 = µg protein; lane 3 = µg protein and lane 4 = µg protein Molecular weight markers × 103 are shown on the right hand side
Fig. 5
Fig. 5
Co-expression of CtBP1 with GluN1/GluN2A results in decreased cell surface expression. HEK 293 cells were co-transfected with either GluNR1-C2 + GluN2A + either CtBP1, PSD-95 or SAP102 clones and cell surface expressed NMDA receptors measured by ELISA assay using either anti-NR2A 44–58 Cys affinity-purified antibodies. The results are expressed as the ratio of absorbance in the presence to the absence of respective PSD-95, SAP102 or CtBP. The results are the mean ± SEM of triplicate samples from n = 7 independent transfections experiments. *****p < 0.0001; ****p < 0.005

References

    1. Paoletti P, Bellone C, Zhou Q. NMDA receptor subunit diversity: impact on receptor properties, synaptic plasticity and disease. Nat Rev Neurosci. 2013;14(6):383–400. doi: 10.1038/nrn3504. - DOI - PubMed
    1. Hansen KB, Yi F, Perszyk RE, Menniti FS, Traynelis SF. NMDA receptors in the central nervous system. Methods Mol Biol. 2017;1677:1–80. doi: 10.1007/978-1-4939-7321-7_1. - DOI - PMC - PubMed
    1. Wyllie DJ, Livesey MR, Hardingham GE. Influence of GluN2 subunit identity on NMDA receptor function. Neuropharmacology. 2013;74:4–17. doi: 10.1016/j.neuropharm.2013.01.016. - DOI - PMC - PubMed
    1. Frank RA, Grant S,G. Supramolecular organization of NMDA receptors and the postsynaptic density. Curr Opin Neurobiol. 2017;45:139–147. doi: 10.1016/j.conb.2017.05.019. - DOI - PMC - PubMed
    1. Cousins SL, Papadakis M, Rutter AR, Stephenson FA. Differential interaction of NMDA receptor subtypes with the PSD-95 family of MAGUK proteins. J Neurochem. 2008;104:901–913. doi: 10.1111/j.1471-4159.2007.05067.x. - DOI - PubMed

LinkOut - more resources