. 2018 Dec;596(24):6263-6287.
doi: 10.1113/JP276424. Epub 2018 Nov 10.

Presynaptic loss of dynamin-related protein 1 impairs synaptic vesicle release and recycling at the mouse calyx of Held

Affiliations

Presynaptic loss of dynamin-related protein 1 impairs synaptic vesicle release and recycling at the mouse calyx of Held

Mahendra Singh et al. J Physiol. 2018 Dec.

Abstract

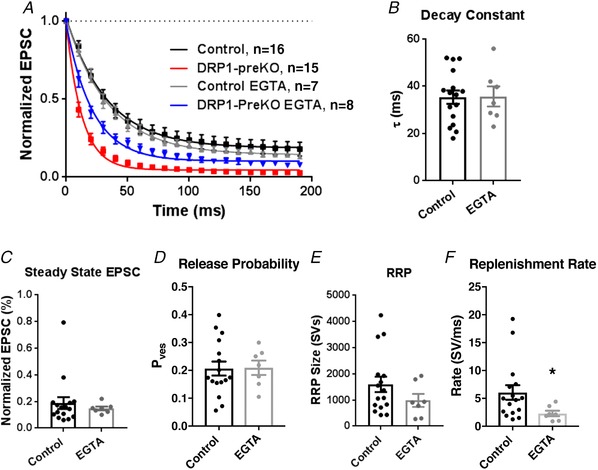
Key points: This study characterizes the mechanisms underlying defects in synaptic transmission when dynamin-related protein 1 (DRP1) is genetically eliminated. Viral-mediated knockout of DRP1 from the presynaptic terminal at the mouse calyx of Held increased initial release probability, reduced the size of the synaptic vesicle recycling pool and impaired synaptic vesicle recycling. Transmission defects could be partially restored by increasing the intracellular calcium buffering capacity with EGTA-AM, implying close coupling of Ca2+ channels to synaptic vesicles was compromised. Acute restoration of ATP to physiological levels in the presynaptic terminal did not reverse the synaptic defects. Loss of DRP1 impairs mitochondrial morphology in the presynaptic terminal, which in turn seems to arrest synaptic maturation.

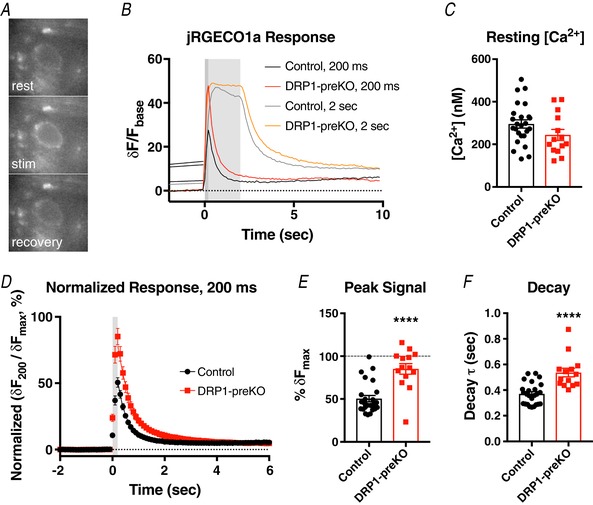
Abstract: Impaired mitochondrial biogenesis and function is implicated in many neurodegenerative diseases, and likely affects synaptic neurotransmission prior to cellular loss. Dynamin-related protein 1 (DRP1) is essential for mitochondrial fission and is disrupted in neurodegenerative disease. In this study, we used the mouse calyx of Held synapse as a model to investigate the impact of presynaptic DRP1 loss on synaptic vesicle (SV) recycling and sustained neurotransmission. In vivo viral expression of Cre recombinase in ventral cochlear neurons of floxed-DRP1 mice generated a presynaptic-specific DRP1 knockout (DRP1-preKO), where the innervated postsynaptic cell was unperturbed. Confocal reconstruction of the calyx terminal suggested SV clusters and mitochondrial content were disrupted, and presynaptic terminal volume was decreased. Using postsynaptic voltage-clamp recordings, we found that DRP1-preKO synapses had larger evoked responses at low frequency stimulation. DRP1-preKO synapses also had profoundly altered short-term plasticity, due to defects in SV recycling. Readily releasable pool size, estimated with high-frequency trains, was dramatically reduced in DRP1-preKO synapses, suggesting an important role for DRP1 in maintenance of release-competent SVs at the presynaptic terminal. Presynaptic Ca2+ accumulation in the terminal was also enhanced in DRP1-preKO synapses. Synaptic transmission defects could be partially rescued with EGTA-AM, indicating close coupling of Ca2+ channels to SV distance normally found in mature terminals may be compromised by DRP1-preKO. Using paired recordings of the presynaptic and postsynaptic compartments, recycling defects could not be reversed by acute dialysis of ATP into the calyx terminals. Taken together, our results implicate a requirement for mitochondrial fission to coordinate postnatal synapse maturation.

Keywords: Adenosine Triphosphate; Animals; DNM1L protein, human; Mice; Mitochondrial Dynamics; Mitochondrial Proteins; Presynaptic Terminals; Synaptic Transmission.


Figures

Figure 1
Figure 1. Viral‐mediated targeted elimination of DRP1
A, capillary‐based protein detection (ProteinSimple Wes) of primary neuronal cultures from DRP1fl/fl mice infected with AAV‐Cre, showing loss of DRP1 protein at different time points after transduction. B, quantification of DRP1 expression normalized to β‐actin (filled bars, left axis) and GFP expression (open bars, right axis) as a function of time. Control is non‐infected (NI) cultures. * P < 0.05 for DRP1 expression, and # P < 0.05 for GFP expression, relative to control. C–E, viral‐mediated acute targeted elimination of DRP1 in vivo. C, example confocal image of infected and uninfected neurons in the ventral cochlear nucleus (VCN) from P18 DRP1fl/fl mouse, stained with anti‐DRP1 (red). Infected cells are identified by GFP reporter expression from AAV‐Cre (green). Right panel is merged image. Cytosolic DRP1 expression is seen in uninfected cell somata. DRP1 signal surrounding postsynaptic bushy cell soma is due to glial expression, and/or the presynaptic endbulb of Held, another axosomatic calyceal synapse onto the bushy cell. AAV‐Cre‐positive GFP‐expressing neurons (*) show near complete loss of DRP1 signal in the cell soma, and displacement from enlarged mitochondria. D, contralateral calyx of Held terminals were identified and isolated from background by vGluT1 staining (magenta) in confocal image stacks. Transduced terminals are marked by GFP reporter (green). DRP1 signal intensity in a GFP‐expressing terminal (white arrowhead) was reduced relative to non‐GFP‐expressing terminals (blue arrowheads) in the same image stack. Scale bar: 20 μm. E, summary of DRP1 signal intensity. DRP1 signal intensity was measured in the volumes described by presynaptic vGluT1 expression in image stacks containing both infected and uninfected terminals in the same field of view and normalized to the mean DRP1 signal intensity in uninfected terminals. Infected terminals show ∼40% reduction in DRP1 expression at P18.
Figure 2
Figure 2. Mitochondrial morphology and cell health of VCN bushy cells and calyx terminals
A, mitochondria were stained with anti‐cytochrome c (magenta), a marker for mitochondrial integrity and morphology, and 3D confocal image stacks were generated containing neurons in the VCN. Left, WT mouse injected with Cre‐AAV‐GFP shows good infectivity in VCN, and normal reticular mitochondrial morphology. Right, AAV‐Cre‐GFP‐expressing cells in the VCN of a DRP1fl/fl mouse show large swollen and rounded mitochondria at the cell soma due to elimination of DRP1. Insets are enlargement of boxed regions, with signal excised based on a GFP mask. B, summary data of mitochondrial content as percentage of cell volume shows mitochondrial occupancy is slightly reduced in targeted DRP1 knockout. n indicates number of image fields analysed. C, action potential recorded from control (black) and DRP1‐KO (red) globular bushy cells (GBCs) at anterior ventral cochlear nucleus (aVCN), due to brief (1 ms) depolarization via current injection. D, summary plot of the somatic resting membrane potential (RMP) of control and DRP1‐KO GBCs. E, example 3D projection of confocal images of control (WT × Cre‐AAV‐GFP) and DRP1‐preKO (DRP1fl/fl × Cre‐AAV‐GFP) calyx of Held presynaptic terminals, excised using GFP reporter signal from AAV transduction. Tissue was stained with anti‐COX1 (green) and anti‐vGluT1 (magenta). F, summary data measuring calyceal terminal volume described by GFP signal. G, summary data measuring distribution of vGluT1 signal within the calyx, expressed as percentage occupancy of presynaptic terminal volume. H, summary data of estimated volume of COX1 particles suggest increased mitochondrial size in DRP1‐preKO terminals. I, total mitochondrial fraction, measured as percentage occupancy of calyceal terminal volume, is increased in DRP1‐preKO terminals.
Figure 3
Figure 3. Excitatory transmission is larger and slower in DRP1‐preKO
A, representative traces from 0.1 Hz stimulation at the calyx of Held in 2 mM Ca2+ ACSF, showing DRP1‐preKO increased postsynaptic evoked responses to single nerve stimulation. Note delayed onset of EPSC in DRP1‐preKO synapse. B, summary of EPSC amplitude. A significant increase in EPSCs is observed in DRP1‐preKO synapses. C, calcium sensitivity of transmission was probed by recording EPSCs at different external bath [Ca2+]. Response amplitudes were normalized to 2 mM Ca2+ conditions. Calcium sensitivity was not affected by DRP1‐preKO. D, example traces of stimulation in 100 μM Cd, to elicit uniquantal responses (black trace), in tandem with synaptic failures (grey traces), at the calyx of Held. E, histogram of evoked responses showing distribution of response amplitude. F, summary plot of median quantal event amplitude, showing quantal size is not altered in DRP1‐preKO synapses. G, example EPSC recorded waveform, illustrating the different temporal components of transmission: conduction delay (CD), synaptic delay (SD) and transmission delay (TD = CD + SD). H and I, summary data for conduction delay and synaptic delay, respectively.
Figure 4
Figure 4. Short‐term depression is greatly enhanced by DRP1‐preKO
A, representative traces showing responses to a 100 Hz stimulus train in control (black) and DRP1‐preKO calyces (red). B, summary data of short‐term depression curves, normalized to the first EPSC amplitude, in control (black) and DRP1‐preKO synapses (red). DRP1‐preKO depresses much faster than the control and has a smaller steady‐state response. C, depression curves were fitted with a single exponential decay and were significantly faster in DRP1‐preKO synapses. D, summary plot of steady‐state response, calculated as average of the last 5 EPSC amplitudes in a train of stimuli, and normalized to the first EPSC in the train. Steady‐state response is significantly reduced in DRP1‐preKO synapses. E, paired‐pulse ratio (PPR) is significantly reduced in DRP1‐preKO synapses. F, summary semi‐log plot of PPR for interstimulus intervals between 10 ms and 1 s. PPR is significantly depressed by DRP1‐preKO at all frequencies tested. G, summary semi‐log plot showing steady‐state current from last 5 responses in a 20‐pulse train for frequencies between 100 and 1 Hz (interstimulus interval 10–1000 ms).
Figure 5
Figure 5. DRP1‐preKO reduced RRP size and RRP replenishment, and increased initial release probability, estimated by multiple methods
A, representative cumulative EPSC plot (SMN plot), used to estimate RRP replenishment rate. Maximal replenishment rate (slope of linear fit) was estimated per cell. B, summary data of RRP refilling rate. Refilling was significantly reduced in DRP1‐preKO terminals. C, representative EQ plots. EQ plot was used to estimate RRP size, as x‐intercept of linear fit to initial portion of the plot. D, summary of RRP estimates, per cell, expressed in SV. RRP size was significantly reduced in DRP1‐preKO terminals. E, summary of release probability (P ves) estimate as fraction of the RRP released by the first stimulus shows a prodigious increase in DRP1‐preKO terminals. F, Wesseling–Lo model was alternatively used to estimate RRP size, replenishment rate and P ves. In these experiments, longer trains of 60 pulses at 100 Hz were used. Shown is a representation of Wesseling–Lo plot, outlining detection of the RRP (shaded area) and replenishment of SVs via unitary refilling rate (red line). G, summary data of estimated RRP size. H, summary of estimated release probability. I, summary of estimated unitary refilling rate.
Figure 6
Figure 6. Readily releasable pool recovery following RRP depletion is slowed by DRP1‐preKO
A, recovery from depression protocol. The synapse was challenged with a depleting train of 100 Hz × 20 stimuli, followed at variable intervals (10 ms to 12.10 s) by a second test train of the same duration and length. Current integral of each train was measured, after subtracting stimulus artifacts. RRP recovery is measured as RRP2/RRP1, for each recovery time point. Greater than 30 s was allowed between each pair of trains to permit full recovery. B, summary RRP recovery curves for control and DRP1‐preKO. RRP recovery time course could be adequately fit by a single exponential (dotted lines) and was measured per cell. C, summary plot of recovery rate constant. DRP1‐preKO terminals show a significant decrease in recovery rate after RRP depletion.
Figure 7
Figure 7. Cytosolic Ca2+ accumulation is enhanced in DRP1‐preKO terminals
The genetically encoded Ca2+ sensor jRGECO1a was used to monitor free cytosolic Ca2+ in the calyx terminal, in response to high frequency stimulation for two different train lengths (100 Hz, 200 ms and 2 s duration). A, example images of jRGECO1a fluorescence at rest (top), during the stimulation train (middle), and 4 s after stimulation ended (bottom). B, example traces from two cells showing jRGECO1a response to 200 ms and 2 s trains. Note that DRP1‐preKO results in substantially larger 200 ms response, while 2 s response is similar to control. C, resting intraterminal free [Ca2+] was estimated using maximum fluorescence change from baseline, by the method of Maravall (2000; see Methods), and was not different between conditions. D, fluorescence change during a 200 ms train was normalized against maximum change during the longer 2 s train, per cell (δF 200F max), and corrected for signal drift (compare to panel B). E, peak fluorescence change in response to 200 ms train was significantly larger in DRP1‐preKO terminals. F, time constant of fluorescence signal decay to baseline (τ) was measured per cell, and was significantly slower in DRP1‐preKO terminals.
Figure 8
Figure 8. Increasing slow presynaptic terminal Ca2+ buffering via incubation in EGTA‐AM partially rescues DRP1‐preKO phenotype
A, summary data of short‐term depression curves, normalized to the first EPSC amplitude, in control (black), control+EGTA (grey), DRP1‐preKO animals (red) and DRP1‐preKO+EGTA (blue). B–F, Summary plots showing that EGTA treatment slows decay constant (B), increases steady state EPSC (C), and reduces vesicle release probability (D). Notably, RRP size (E) and RRP replenishment rate (F) did not revert to control levels with EGTA treatment.
Figure 9
Figure 9. EGTA does not affect release probability at control synapses
A, summary data of short‐term depression curves, normalized to the first EPSC amplitude, in control (black), control EGTA (grey), DRP1‐preKO animals (red) and DRP1‐preKO EGTA (blue). B–E, summary plots show that EGTA treatment does not alter decay constant (B), steady state EPSC (C), vesicle release probability (D), or RRP size (E). F, EGTA‐AM incubation reduced maximal replenishment rate in control animals.
Figure 10
Figure 10. Paired pre‐ and postsynaptic recordings from the calyx of Held
Presynaptic whole cell voltage recordings were paired with postsynaptic whole cell voltage clamp recordings from control and DRP1‐preKO synapses. A, example traces, showing the first five stimuli and responses in a 100 Hz train within 2 min after establishing the presynaptic recording. Presynaptic action potentials were initiated by a 1 ms current injection (top trace) so that presynaptic APs were generated near the end of the current injection step (middle traces) and resulted in AMPAergic EPSCs (bottom traces). Recordings were performed in 1 mM kynurenic acid, to reduce receptor desensitization. B, summary data of EPSC responses during 100 Hz depression trains (n = 6–10 cells per condition and time point). C, postsynaptic responses during 100 Hz train, normalized to the first EPSC. D, resting presynaptic membrane potential taken at various time points after establishing presynaptic whole cell recording configuration. E, summary plot of peak (maximum) AP voltage of the first stimulus in a train, taken at various time points during the recording. F, summary data illustrating the time course of the falling phase of the first AP waveform in the train at various time points during the recording.
Figure 11
Figure 11. Paired pre‐ and postsynaptic voltage clamp recordings from the calyx of Held
Both pre‐ and postsynaptic compartments were voltage‐clamped, to assay coupling between Ca2+ influx and exocytosis. A, Ca2+ influx was stimulated by 1 ms step depolarization to 0 mV, from holding potential of −80 mV (STIM, top trace). Leak‐subtracted (P/5) Ca2+ currents were recorded (Pre (I Ca), middle trace), along with the resulting postsynaptic response (Post (EPSC), bottom trace. Example recordings of the first five responses in a 100 Hz train (1 ms × 100 hz, 20 pulses) from control (black), and DRP‐preKO (red) are shown. B, scatter plot of Ca2+ current integral versus EPSC integral for the first stimulus in a train at 1–2 min after presynaptic break‐in, and at 10–12 min after break‐in, for control and DRP1‐preKO. C, transmission index, calculated as the integral of EPSC/I Ca, for successive time points during the recording. DRP1 showed similar index values to control. D, transmission indices (EPSC/I Ca) summarized for the 100 Hz train suggests that DRP1 have reduced excitation–secretion coupling.

Similar articles

Cited by

References

    1. Abraham NM, Egger V, Shimshek DR, Renden R, Fukunaga I, Sprengel R, Seeburg PH, Klugmann M, Margrie TW, Schaefer AT & Kuner T (2010). Synaptic inhibition in the olfactory bulb accelerates odor discrimination in mice. Neuron 65, 399–411. - PMC - PubMed
    1. Alnaes E & Rahamimoff R (1975). On the role of mitochondria in transmitter release from motor nerve terminals. J Physiol 248, 285–306. - PMC - PubMed
    1. Awatramani GB, Price GD & Trussell LO (2005). Modulation of transmitter release by presynaptic resting potential and background calcium levels. Neuron 48, 109–121. - PubMed
    1. Benard G, Bellance N, Jose C, Melser S, Nouette‐Gaulain K & Rossignol R (2010). Multi‐site control and regulation of mitochondrial energy production. Biochim Biophys Acta 1797, 698–709. - PubMed
    1. Berthet A, Margolis EB, Zhang J, Hsieh I, Zhang J, Hnasko TS, Ahmad J, Edwards RH, Sesaki H, Huang EJ & Nakamura K (2014). Loss of mitochondrial fission depletes axonal mitochondria in midbrain dopamine neurons. J Neurosci 34, 14304–14317. - PMC - PubMed

Publication types

LinkOut - more resources