. 2018 Dec;18(23):e1800208.
doi: 10.1002/pmic.201800208. Epub 2018 Oct 23.

Critical Role for Saccharomyces cerevisiae Asc1p in Translational Initiation at Elevated Temperatures

Affiliations

Critical Role for Saccharomyces cerevisiae Asc1p in Translational Initiation at Elevated Temperatures

Vincent R Gerbasi et al. Proteomics. 2018 Dec.

Abstract

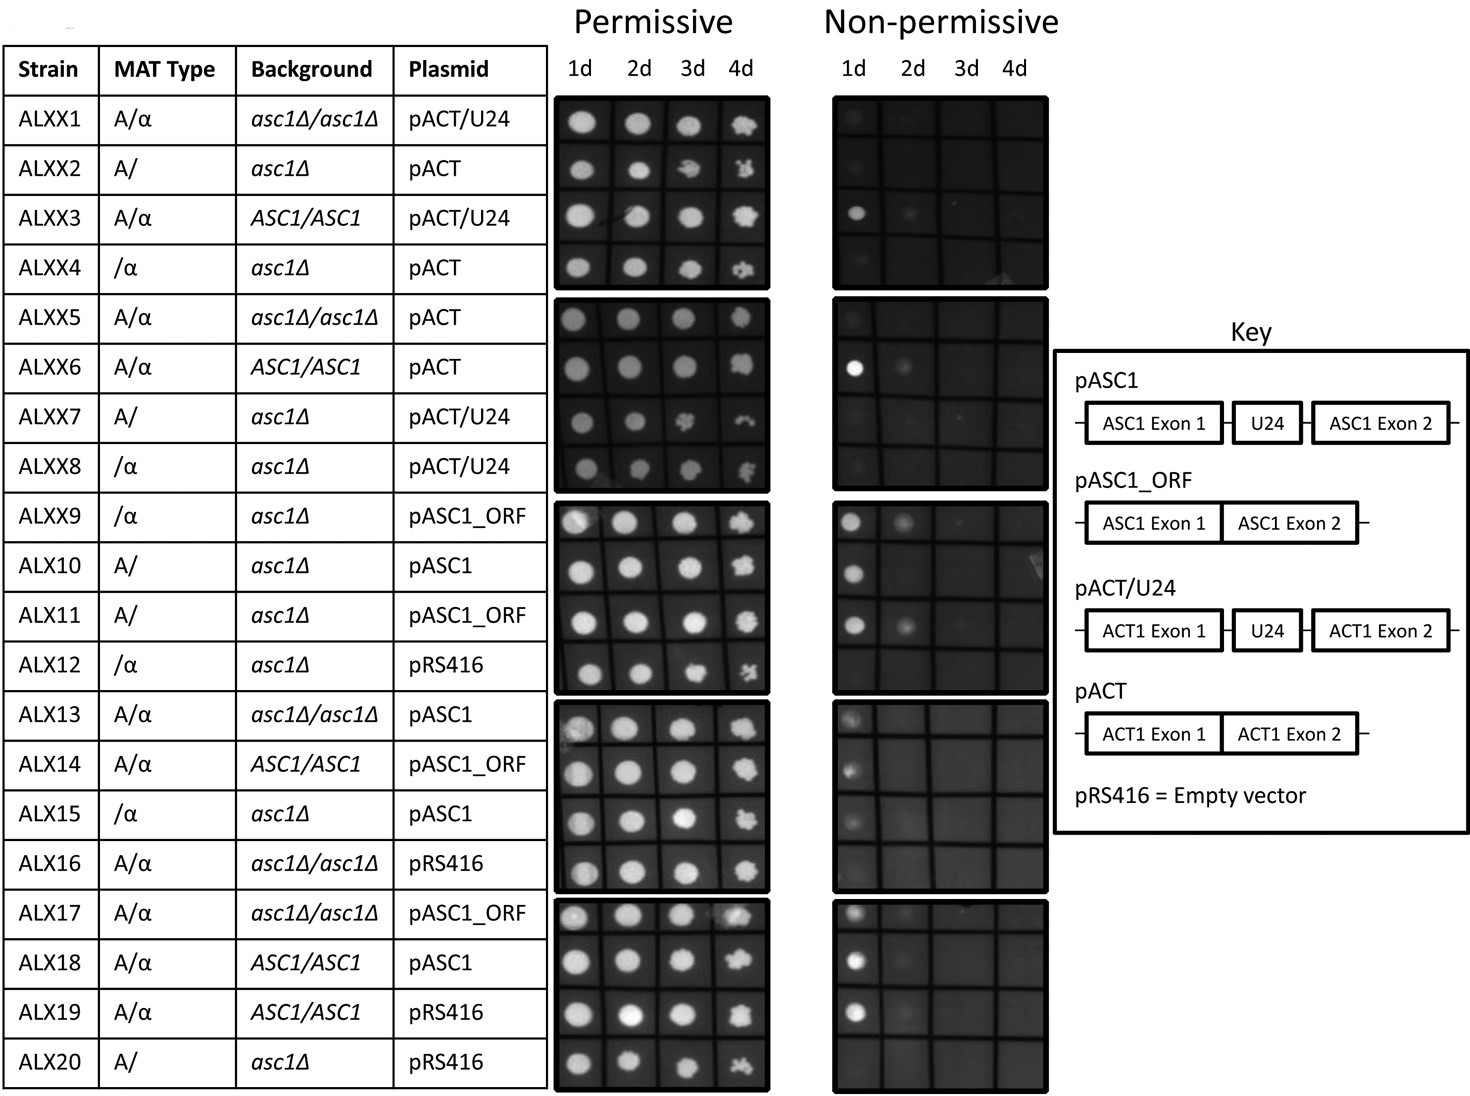
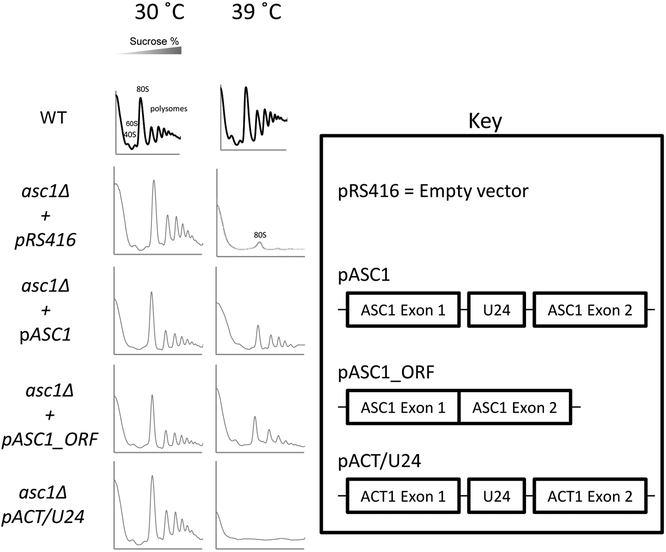
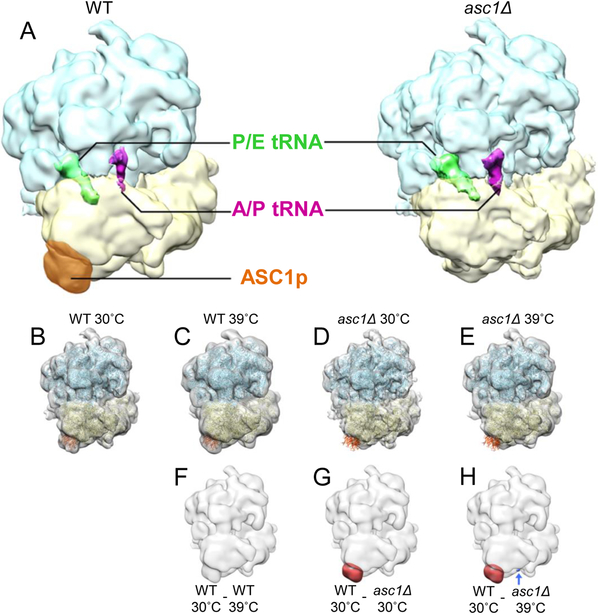
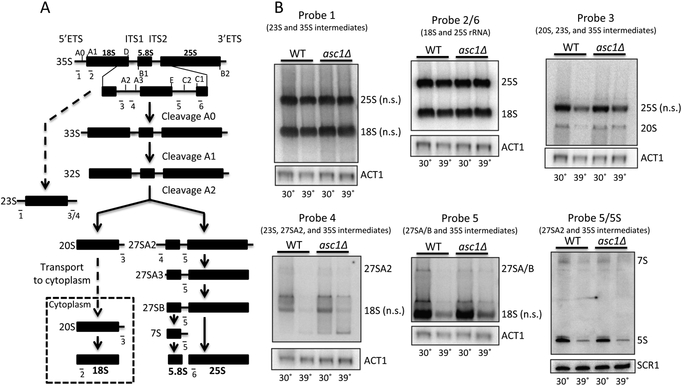
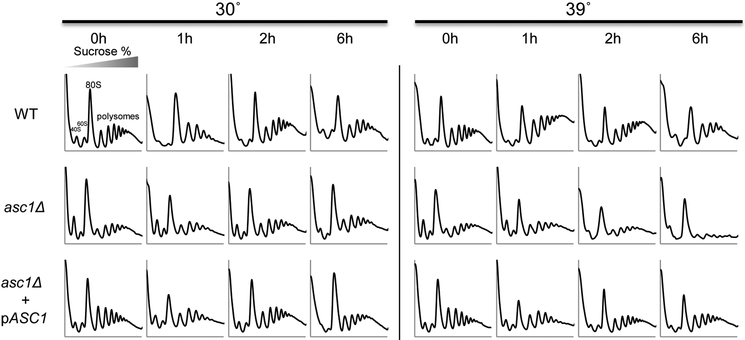
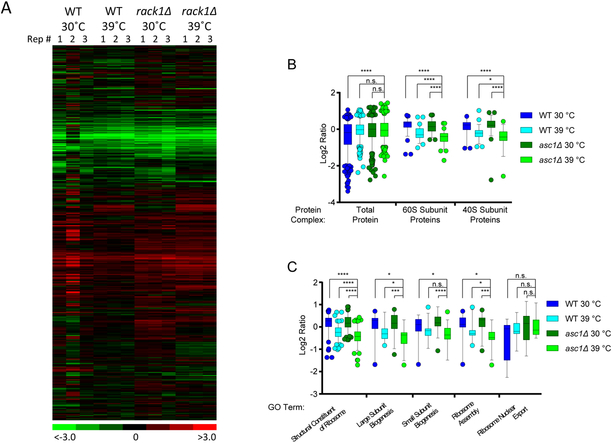
The eukaryotic ribosomal protein RACK1/Asc1p is localized to the mRNA exit channel of the 40S subunit but lacks a defined role in mRNA translation. Saccharomyces cerevisiae deficient in ASC1 exhibit temperature-sensitive growth. Using this null mutant, potential roles for Asc1p in translation and ribosome biogenesis are evaluated. At the restrictive temperature the asc1Δ null mutant has reduced polyribosomes. To test the role of Asc1p in ribosome stability, cryo-EM is used to examine the structure of 80S ribosomes in an asc1Δ yeast deletion mutant at both the permissive and nonpermissive temperatures. CryoEM indicates that loss of Asc1p does not severely disrupt formation of this complex structure. No defect is found in rRNA processing in the asc1Δ null mutant. A proteomic approach is applied to survey the effect of Asc1p loss on the global translation of yeast proteins. At the nonpermissive temperature, the asc1Δ mutant has reduced levels of ribosomal proteins and other factors critical for translation. Collectively, these results are consistent with recent observations suggesting that Asc1p is important for ribosome occupancy of short mRNAs. The results show the Asc1 ribosomal protein is critical in translation during heat stress.

Keywords: ASC1; initiation; ribosome; translation; yeast.


Conflict of interest statement

Conflict of Interest Statement: The authors declare no conflicts of interest.

Figures

Figure 1.
Figure 1.
The Asc1p coding region is necessary for growth at NPT. Yeast strains were serially diluted at 1:10 on SC media and grown at the permissive temperature (30˚C) or the NPT (42˚C) for 72 h. Labels on the left show the genetics and plasmids transformed into each yeast strain. A key to the right shows the structure of the expressed ASC1 components in the respective plasmid constructs.
Figure 2.
Figure 2.
The Asc1p coding region is necessary for 80S and polyribosomes at NPT. Strains were grown in SC media at 30˚C or 39˚C for 18 h and ribosome dissociation was then blocked with cyclohexamide. Gradients were loaded with 1 mg of total protein from cleared lysate and profiles read at an absorbance of 254 nm. Diagrams to the right show the expressed ASC1 components in the respective plasmid constructs.
Figure 3.
Figure 3.
Ribosomes assembled in asc1Δ yeast at NPT are structurally intact. (A) Cryo-EM maps of 80S ribosomes with P/E-site and A/P-site tRNAs. Left: WT strain AL035, 12.8Å from 7089 particles; Right: asc1Δ mutant strain AL116, 10.4Å from 10,723 particles. Resolution determined at FSC = 0.143 under gold standard regime. Blue: large 60S subunit; yellow: small 40S subunit; green: P/E-site tRNA; magenta: A/P-site tRNA; orange: Asc1p. Note that tRNAs appear thinned because of nonstoichiometric occupancy. (B-E) the S. cerevisiae structure (PDB ID: 3U5B, 3U5C, 3U5D, and 3U5E) used as reference was rigid body fitted into density maps in UCSF Chimera [20]: (B) WT strain AL035 at 30˚C, 14.5Å, from 3,656 particles; (C) WT strain AL035 at 39˚C, 16.0Å, from 3,433 particles; (D) asc1Δ null strain AL116 at 30˚C, 11.2Å, from 7,916 particles; (E) asc1Δ null strain AL116 at 39˚C, 15.5Å, from 3,807 particles. Resolution determined at FSC = 0.143 under gold standard regime. Yellow ribbon: small 40S subunit; blue ribbon: large 60S subunit; orange ribbon: X-ray structure of Asc1p. The four density maps were compared after filtering to the same resolution, 16.0Å. (F-H) Comparisons between map (B) and (C-E), shown in difference maps in the lower panel: (F) (WT 30˚C) – (WT 39˚C), (G) (WT 30˚C) – (asc1Δ 30˚C), and (H) (WT 30˚C) – (asc1Δ 39˚C) respectively shown at the threshold of ±5x standard deviations of each difference map. In (F-H) the density map of WT at 30˚C is shown in light gray as a viewing aid. Red mass: positive difference; blue mass: negative difference. The blue arrow (bottom, H) indicates a minor difference in mass observed in the asc1Δ yeast ribosomes at 39˚C.
Figure 4.
Figure 4.
asc1Δ at NPT carries out normal rRNA processing. (A) Diagram of rRNA processing steps and location of probes used for the analysis. Adapted from Dong et al [26]. (B) Northern blot detection of various rRNA products and intermediates. WT Strain YSB194 and asc1Δ null strain AL116 were grown at 30˚C and then shifted to 39˚C for 1h in SC media before RNA was harvested. The same membrane was iteratively probed with probes 1, 3, 4, and 5; ACT1 RNA served as a loading control. For probe 5/5S, SCR1 was used as a loading control. (n.s.): non-specific binding.
Figure 5.
Figure 5.
Polyribosomes decrease over time in asc1Δ at NPT. WT strain AL035, asc1Δ strain AL116, and asc1Δ + pASC1 strain AL156 were grown at 30˚C overnight in SC media to mid log phase then diluted 1:10 in fresh SC at 30˚C or 39˚C. Samples were taken at 0, 1, 2, and 6 h and ribosome dissociation then blocked with cycloheximide. Gradients were loaded with 1 mg of total protein from cleared lysate and profiles read at an absorbance of 254 nm. Results are representative of at least 2 replicates. The WT 30˚C, 0 h profile includes labels for common features of polyribosome profiles.
Figure 6.
Figure 6.
Ribosomal proteins are decreased in asc1Δ at NPT. (A) Hierarchical clustering of log2 fold change protein expression values compared to yeast WCE common control as derived from normalized iTRAQ reporter ion intensities. Fold change values for each replicate condition were compared with the average intensity values of the WCE common control included in each set of experiments. (B,C) Box plot diagrams of various protein groups using average log2 ratio protein expression values from A. Ratios for each condition were determined by dividing the reporter signal by the average reporter signal across all channels. Individual data points are shown for the top and bottom 5% of the data. Results of t-test comparisons are shown. ****: p < 0.0001, ***: p < 0.001, **: p < 0.01, *: p < 0.05, n.s.: p > 0.05. (B) All reproducibly detected proteins and the subset of those proteins belonging to the large and small ribosomal subunits. (C) Box plot diagram of log2 ratios as in B of quantified proteins belonging to various GO terms.

Similar articles

Cited by

References

    1. Chantrel Y, Gaisne M, Lions C, Verdiere J, Genetics 1998, 148, 559. - PMC - PubMed
    1. Coyle SM, Gilbert WV, Doudna JA, Mol Cell Biol 2009, 29, 1626. - PMC - PubMed
    1. Gerbasi VR, Weaver CM, Hill S, Friedman DB, Link AJ, Mol Cell Biol 2004, 24, 8276. - PMC - PubMed
    1. Link AJ, Eng J, Schieltz DM, Carmack E, Mize GJ, Morris DR, Garvik BM, Yates JR 3rd, Nat Biotechnol 1999, 17, 676. - PubMed
    1. Sengupta J, Nilsson J, Gursky R, Spahn CM, Nissen P, Frank J, Nat Struct Mol Biol 2004, 11, 957. - PubMed

Publication types

MeSH terms

Substances

LinkOut - more resources