

Dynamics of Quaternary Structure Transitions in R-State Carbonmonoxyhemoglobin Unveiled in Time-Resolved X-ray Scattering Patterns Following a Temperature Jump
- PMID: 30285440
- PMCID: PMC6580858
- DOI: 10.1021/acs.jpcb.8b07414
Dynamics of Quaternary Structure Transitions in R-State Carbonmonoxyhemoglobin Unveiled in Time-Resolved X-ray Scattering Patterns Following a Temperature Jump
Abstract
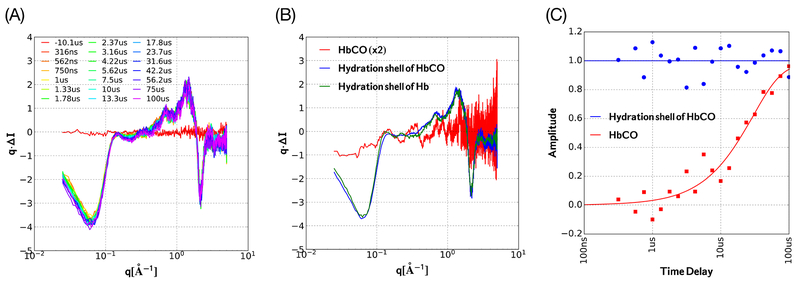
It is well-known that tetrameric hemoglobin binds ligands cooperatively by undergoing a ligand-induced T → R quaternary structure transition, a structure-function relationship that has long served as a model system for understanding allostery in proteins. However, kinetic studies of the reverse, R → T quaternary structure transition following photolysis of carbonmonoxyhemoglobin (HbCO) reveal complex behavior that may be better explained by the presence of two different R quaternary structures coexisting in thermal equilibrium. Indeed, we report here time-resolved small- and wide-angle X-ray scattering (SAXS/WAXS) patterns of HbCO following a temperature jump that not only provide unambiguous evidence for more than one R state, but also unveil the time scale for interconversion between them. Since the time scale for the photolysis-induced R → T transition is likely different for different R-states, this structural heterogeneity must be accounted for to properly explain the kinetic heterogeneity observed in time-resolved spectroscopic studies following photolysis of HbCO.
Conflict of interest statement
Notes
The authors declare no competing financial interest.
Figures
Similar articles
-
WAXS studies of the structural diversity of hemoglobin in solution.J Mol Biol. 2011 May 20;408(5):909-21. doi: 10.1016/j.jmb.2011.02.062. Epub 2011 Mar 21. J Mol Biol. 2011. PMID: 21420976 Free PMC article.
-
Time-resolved optical spectroscopy and structural dynamics following photodissociation of carbonmonoxyhemoglobin.Biophys Chem. 1988 Feb;29(1-2):63-76. doi: 10.1016/0301-4622(88)87025-x. Biophys Chem. 1988. PMID: 3282562 Review.
-
Hemoglobin allostery: resonance Raman spectroscopy of kinetic intermediates.Science. 1995 Sep 29;269(5232):1843-8. doi: 10.1126/science.7569921. Science. 1995. PMID: 7569921
-
Quaternary structure dependence of kinetic hole burning and conformational substates interconversion in hemoglobin.Biochemistry. 2003 Apr 22;42(15):4499-505. doi: 10.1021/bi0272555. Biochemistry. 2003. PMID: 12693946
-
Hybrid Methods for Modeling Protein Structures Using Molecular Dynamics Simulations and Small-Angle X-Ray Scattering Data.Adv Exp Med Biol. 2018;1105:237-258. doi: 10.1007/978-981-13-2200-6_15. Adv Exp Med Biol. 2018. PMID: 30617833 Review.
Cited by
-
Biophysical Approaches for the Characterization of Protein-Metabolite Interactions.Methods Mol Biol. 2023;2554:199-229. doi: 10.1007/978-1-0716-2624-5_13. Methods Mol Biol. 2023. PMID: 36178628 Review.
-
Toward time-resolved laser T-jump/X-ray probe spectroscopy in aqueous solutions.Struct Dyn. 2019 Dec 11;6(6):064303. doi: 10.1063/1.5129626. eCollection 2019 Nov. Struct Dyn. 2019. PMID: 31832487 Free PMC article.
-
Carbon Monoxide Signaling: Examining Its Engagement with Various Molecular Targets in the Context of Binding Affinity, Concentration, and Biologic Response.Pharmacol Rev. 2022 Jul;74(3):823-873. doi: 10.1124/pharmrev.121.000564. Pharmacol Rev. 2022. PMID: 35738683 Free PMC article. Review.
-
Identifying protein conformational states in the Protein Data Bank: Toward unlocking the potential of integrative dynamics studies.Struct Dyn. 2024 May 17;11(3):034701. doi: 10.1063/4.0000251. eCollection 2024 May. Struct Dyn. 2024. PMID: 38774441 Free PMC article.
-
Time-resolved X-ray solution scattering unveils the events leading to hemoglobin heme capture by staphylococcal IsdB.Nat Commun. 2025 Feb 17;16(1):1361. doi: 10.1038/s41467-024-54949-w. Nat Commun. 2025. PMID: 39962089 Free PMC article.
References
-
- Perutz MF Stereochemistry of Cooperative Effects in Haemoglobin. Nature 1970, 228, 726–739. - PubMed
-
- Monod J; Wyman J; Changeux JP On the Nature of Allosteric Transitions: A Plausible Model. J. Mol. Biol 1965, 12, 88–118. - PubMed
-
- Koshland DE Jr.; Nemethy G; Filmer D Comparison of Experimental Binding Data and Theoretical Models in Proteins Containing Subunits. Biochemistry 1966, 5, 365–385. - PubMed
-
- Szabo A; Karplus M A Mathematical Model for Structure-Function Relations in Hemoglobin. J. Mol. Biol 1972, 72, 163–197. - PubMed
-
- Yonetani T; Park SI; Tsuneshige A; Imai K; Kanaori K Global Allostery Model of Hemoglobin. Modulation of O2 Affinity, Cooperativity, and Bohr Effect by Heterotropic Allosteric Effectors. J. Biol. Chem 2002, 277, 34508–34520. - PubMed
Publication types
MeSH terms
Substances
Grants and funding
LinkOut - more resources
Full Text Sources
