. 2018 Oct 3;16(1):110.
doi: 10.1186/s12915-018-0573-9.

UBN1/2 of HIRA complex is responsible for recognition and deposition of H3.3 at cis-regulatory elements of genes in mouse ES cells

Affiliations

UBN1/2 of HIRA complex is responsible for recognition and deposition of H3.3 at cis-regulatory elements of genes in mouse ES cells

Chaoyang Xiong et al. BMC Biol. .

Abstract

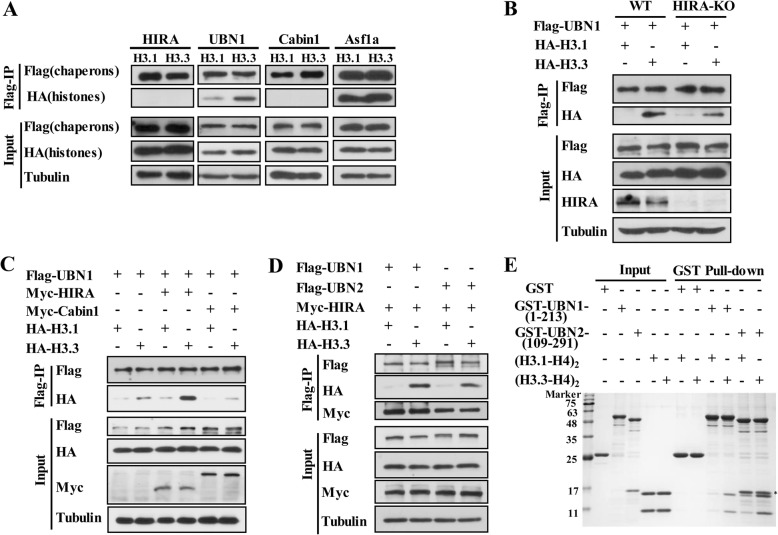
Background: H3.3 is an ancient and conserved H3 variant and plays essential roles in transcriptional regulation. HIRA complex, which is composed of HIRA, UBN1 or UBN2, and Cabin1, is a H3.3 specific chaperone complex. However, it still remains largely uncharacterized how HIRA complex specifically recognizes and deposits H3.3 to the chromatin, such as promoters and enhancers.

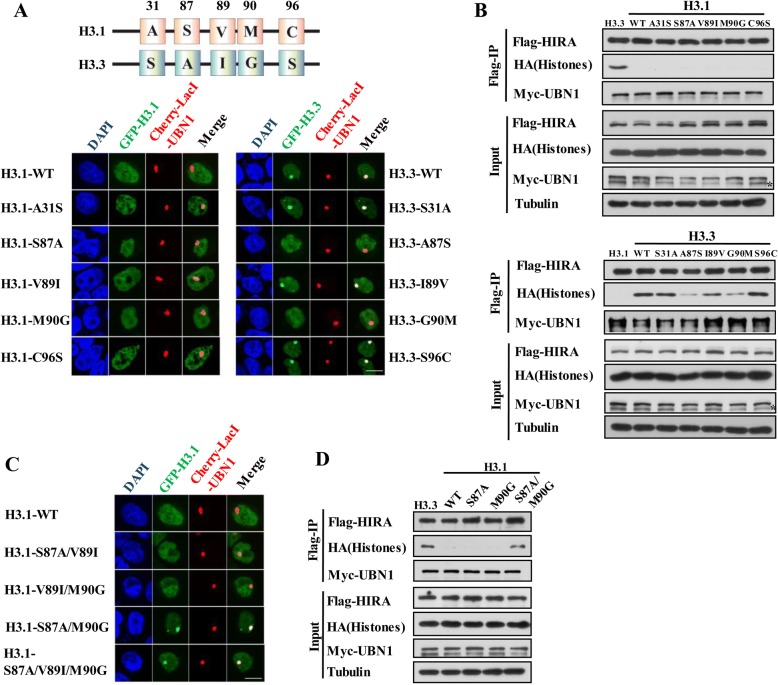
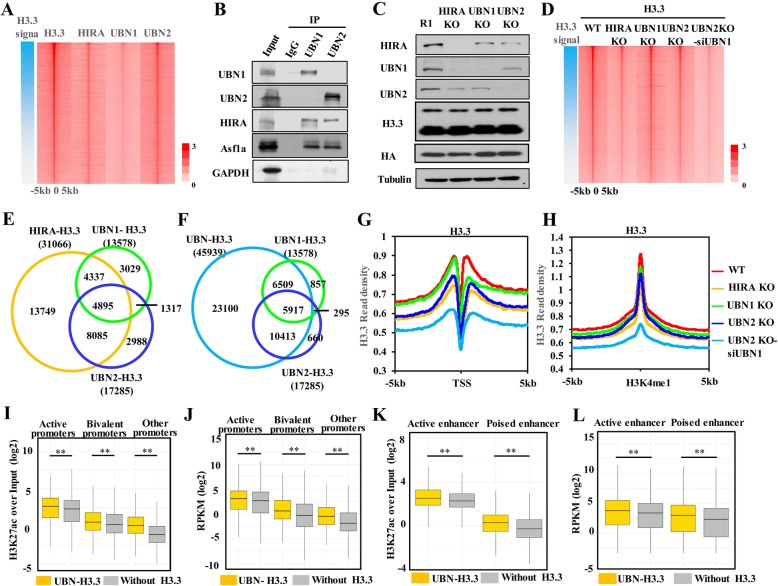
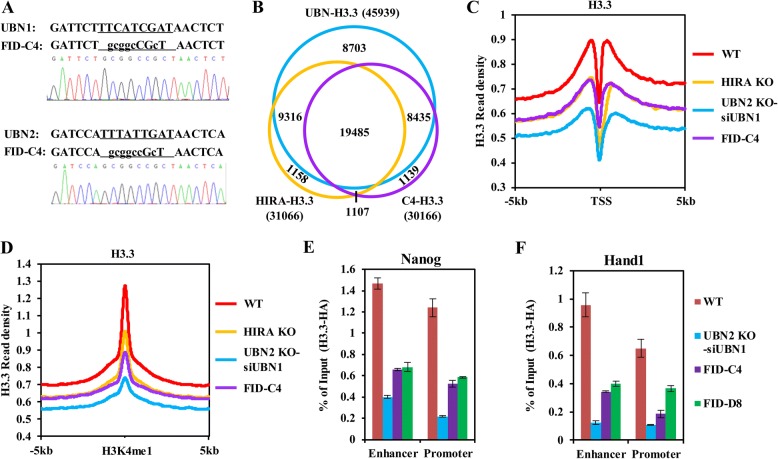
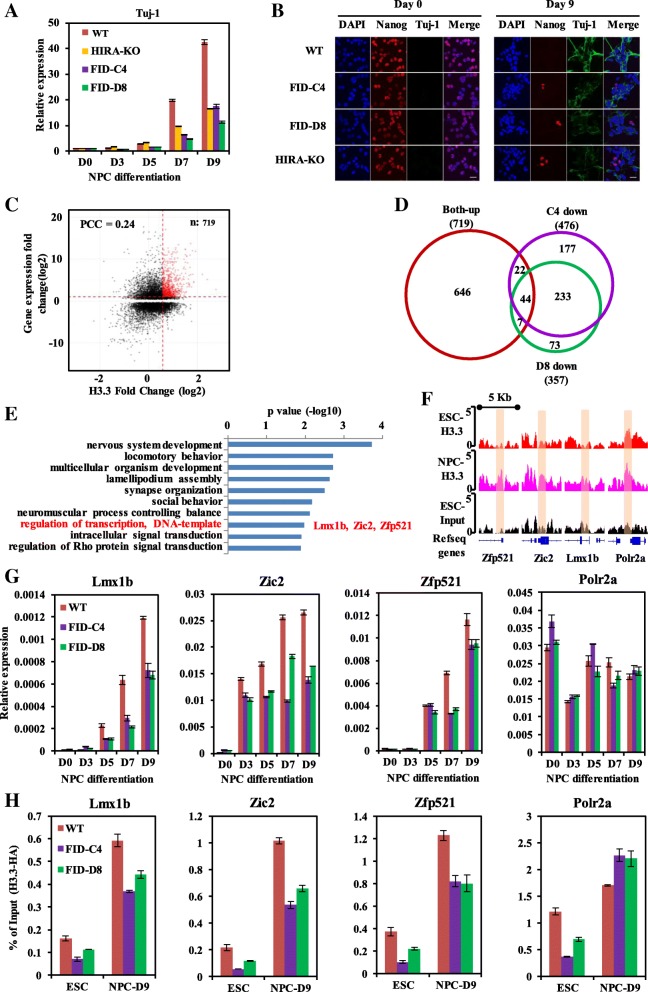
Results: In this study, we demonstrate that the UBN1 or UBN2 subunit is mainly responsible for specific recognition and direct binding of H3.3 by the HIRA complex. While the HIRA subunit can enhance the binding affinity of UBN1 toward H3.3, Cabin1 subunit cannot. We also demonstrate that both Ala87 and Gly90 residues of H3.3 are required and sufficient for the specific recognition and binding by UBN1. ChIP-seq studies reveal that two independent HIRA complexes (UBN1-HIRA and UBN2-HIRA) can cooperatively deposit H3.3 to cis-regulatory regions, including active promoters and active enhancers in mouse embryonic stem (mES) cells. Importantly, disruption of histone chaperone activities of UBN1 and UBN2 by FID/AAA mutation results in the defect of H3.3 deposition at promoters of developmental genes involved in neural differentiation, and subsequently causes the failure of activation of these genes during neural differentiation of mES cells.

Conclusion: Together, our results provide novel insights into the mechanism by which the HIRA complex specifically recognizes and deposits H3.3 at promoters and enhancers of developmental genes, which plays a critical role in neural differentiation of mES cells.

Keywords: Enhancer; HIRA complex; Histone variant H3.3; UBN1; UBN2.


Conflict of interest statement

Ethics approval and consent to participate

Not applicable.

Consent for publication

Not applicable.

Competing interests

The authors declare that they have no competing interests.

Publisher’s Note

Springer Nature remains neutral with regard to jurisdictional claims in published maps and institutional affiliations.

Figures

Fig. 1
Fig. 1
UBN1 and UBN2 are responsible for the specific recognition and direct binding of H3.3. a UBN1 specifically recognizes H3.3. Interaction between HIRA, UBN1, Cabin1, Asf1a, and H3.1, H3.3 is analyzed by Western blot analysis of anti-Flag immunoprecipitates. b HIRA is dispensable for the interaction between UBN1 and H3.3. The interaction between UBN1 and H3.3 is analyzed by immunoprecipitation in wild type (WT) or HIRA knockout (HIRA KO) HEK293T cells as illustrated. c HIRA enhances the interaction between UBN1 and H3.3. The effect of HIRA and Cabin1 on the interaction between UBN1 and H3.3 is analyzed by Western blot analysis of anti-Flag immunoprecipitates. d Both UBN1 and UBN2 specifically interact with H3.3. Interaction between UBN1, UBN2, and H3.1, H3.3 in the presence of HIRA is analyzed by Western blot analysis of anti-Flag immunoprecipitates. e The direct interaction between UBN1 (aa1-213), UBN2 (aa109-291), and (H3.1-H4)2, (H3.3-H4)2 tetramers is analyzed by GST pull-down followed by Coomassie staining. Input corresponds to 10% proteins. * indicates nonspecific band in GST-UBN2-(aa109-291) sample
Fig. 2
Fig. 2
UBN1 mediates the interaction between HIRA subunit and histone variant H3.3. a UBN1 mediates the specific interaction between HIRA and H3.3. Interaction between HIRA subunit and H3.3 is analyzed by LacO-LacI targeting system in A03_1 or A03_1/Flag-UBN1 cell lines. A green focus indicates the interaction between the histones with chaperones. Scale bar, 10 μm. b Interaction between HIRA subunit and H3.3 is analyzed in the presence of UBN1 or Cabin1 by Western blot analysis of anti-Flag immunoprecipitates. c Both WD repeat domain and B domain of HIRA are involved in the interaction with H3.3. Top panel, schematic presentation of full length and truncation mutants of human HIRA; bottom panel, interaction between truncation mutants of HIRA subunit and H3.3 is analyzed in A03_1/Flag-UBN1 cell line. Statistic results are shown in Additional file 1: Figure S2D. Scale bar, 10 μm. d The effect of UBN1 (aa1-213) on the interaction between HIRA (aa1-481) and H3.3 is analyzed by GST pull-down followed by Coomassie staining. Input corresponds to 10% proteins. e The interaction between HIRA subunit and H3.3 is independent of Asf1a. The effect of Asf1a on the interaction between HIRA subunit and H3.3 is analyzed by Western blot analysis of anti-Flag immunoprecipitates. * indicates Myc-UBN1; ** indicates Myc-Asf1a
Fig. 3
Fig. 3
Residues Ala87 and Gly90 of H3.3 are important for recognition and binding of H3.3 by HIRA complex. a, b Both Ala87 and Gly90 of H3.3 are required for binding UBN1. Top panel, schematic diagram shows the different amino acid residues between H3.1 and H3.3; Bottom panel, interaction between UBN1 subunit and H3.1 or H3.3 mutants is analyzed by LacO-LacI targeting system (a) or Western blot of anti-Flag immunoprecipitates (b). Statistic results are shown in Additional file 1: Figure S3C. Scale bar, 10 μm. (c, d) Ala87 and Gly90 of H3.3 are sufficient to confer the specificity toward UBN1. Interaction between UBN1 subunit and H3.1 mutants is analyzed by LacO-LacI targeting system (c) and Western blot of anti-Flag immunoprecipitates (d). Statistic results are shown in Additional file 1: Figure S3D, Scale bar, 10 μm
Fig. 4
Fig. 4
UBN1 and UBN2 cooperatively deposit H3.3 at cis-regulatory elements in mESC. a Heat map shows that H3.3, HIRA, UBN1, and UBN2 are well co-localized at H3.3 peaks. H3.3 peaks overlapping with UBN1 or UBN2 are sorted descendingly according to the reads density of H3.3. Read density of H3.3, UBN1, UBN2, and HIRA are counted around 5 kb of H3.3 peak center. b UBN1 and UBN2 do not interact with each other. The endogenous interaction between UBN1 and UBN2 is analyzed by Western blot analysis of anti-UBN1 and anti-UBN2 immunoprecipitates. c Western blot shows the proteins levels of HIRA, UBN1, UBN2, and H3.3 in HIRA KO, UBN1 KO, and UBN2 KO cell lines. H3.3 antibody recognizes both 3XFlag-HA knock-in H3.3 and none tagged H3.3. HA antibody recognizes 3XFlag-HA knock-in H3.3. d Heat map shows H3.3 reads density in WT, HIRA KO, UBN1 KO, UBN2 KO, and UBN2 KO-siUBN1 cells. e Venn diagram shows the overlapping among HIRA-H3.3, UBN1-H3.3, and UBN2-H3.3. f Venn diagram shows the overlapping among UBN-H3.3, UBN1-H3.3, and UBN2-H3.3. g, h UBN1 and UBN2 are required for H3.3 deposition at promoters and enhancers. Meta-analysis of dynamic changes of H3.3 deposition at promoters (g) and enhancers (h) after HIRA, UBN1, or UBN2 knockout and double depletion. Reads were normalized to 10 million in each data set. i, j UBN-H3.3 marks more active promoters. Boxplots show the H3K27ac level (I) or gene expression (j) of UBN-H3.3 marked promoters. **: p < 0.01. (k, l) UBN-H3.3 marks more active enhancers. Boxplots show H3K27ac level (K) of UBN-H3.3 marked enhancers and expression level of the regulated genes (l). **: p < 0.01
Fig. 5
Fig. 5
Phe/Ile/Asp amino acid residues of UBN1 and UBN2 are involved in the binding and deposition of H3.3. a Sanger sequencing of PCR product shows that Phe/Ile/Asp of both UBN1 and UBN2 were mutated to Alanine in FID-C4 cell line. b Venn diagram shows the overlapping among C4-H3.3, UBN-H3.3, and HIRA-H3.3. c, d Phe/Ile/Asp amino acids of UBN1/2 were important for the deposition of H3.3. Meta-analysis shows that alternation of the deposition of H3.3 at both promoters (c) and enhancers (d) in mES cells with FID/AAA mutation of UBN1 and UBN2. Reads were normalized to 10 million in each data set. (e, f) ChIP-qPCR analysis of H3.3 at enhancers and promoters of active (Nanog) (e) and bivalent (Hand1) (f) genes. The qPCR value was normalized to 1% input of each sample. Standard deviation was derived from three replicates
Fig. 6
Fig. 6
UBN1- and UBN2-mediated H3.3 deposition is involved in neuron progenitor cell differentiation. a RT-qPCR of Tuj-1 in WT and FID/AAA-mutated mES cells during NPC differentiation. The expression level of Tuj1 was normalized to GAPDH and day 0. b Immunofluorescence shows expression of Nanog and Tuj-1 in WT and FID/AAA-mutated cells during NPC differentiation. Scale bar, 20 μm. c Dot plot shows the relationship between the dynamics of H3.3 at promoter regions and gene expression during NPC differentiation. H3.3 read density was counted within promoters (TSS ± 500 bp) to calculate fold change from ES cell to NPC by HOMER. The Red dots represent the genes with upregulated expression and increased H3.3 signal at promoters. The thresholds for H3.3 fold change and gene expression are 1.5 and 2 respectively. PCC, Pearson’s correlation coefficient. d Venn diagram shows the relationship between the “both-up” genes and downregulated genes in NPCs derived from FID/AAA-mutated mES cells. e The top 10 enriched biological function terms from GO analysis of the 44 genes by DAVID. Lmx1b, Zic2, and Zfp521 are the enriched genes related to “regulation of transcription, DNA-templated”. A full list of significantly enriched terms is in Additional file 1: Figure S6E. f Genome tracks show H3.3 deposition at promoters of Zfp152, Zic2, Lmx1b, and Polr2a during NPC differentiation of WT mES cells. g RT-qPCR of gene expression of Zfp152, Zic2, Lmx1b, and Polr2a during NPC differentiation of WT and FID/AAA-mutated mES cells. The gene expression levels were normalized to GAPDH. Standard deviations were derived from three replicates. h ChIP-qPCR of H3.3 deposition at the promoters of Zfp152, Zic2, Lmx1b, and Polr2a during NPC differentiation in WT and FID/AAA-mutated cells. The qPCR value was normalized to 1% input of each sample. Standard deviation was derived from three replicates

Similar articles

Cited by

References

    1. Zhu P, Li G. Structural insights of nucleosome and the 30-nm chromatin fiber. Curr Opin Struct Biol. 2016;36:106–115. doi: 10.1016/j.sbi.2016.01.013. - DOI - PubMed
    1. Kornberg RD. Chromatin structure: a repeating unit of histones and DNA. Science. 1974;184:868–871. doi: 10.1126/science.184.4139.868. - DOI - PubMed
    1. Luger K, Mader AW, Richmond RK, Sargent DF, Richmond TJ. Crystal structure of the nucleosome core particle at 2.8 Å resolution. Nature. 1997;389:251–260. doi: 10.1038/38444. - DOI - PubMed
    1. Maze I, Noh KM, Soshnev AA, Allis CD. Every amino acid matters: essential contributions of histone variants to mammalian development and disease. Nat Rev Genet. 2014;15:259–271. doi: 10.1038/nrg3673. - DOI - PMC - PubMed
    1. Elsasser SJ, D'Arcy S. Towards a mechanism for histone chaperones. Biochim Biophys Acta. 1819;2013:211–221. - PMC - PubMed

Publication types

MeSH terms