

MiRNA expression profiles in healthy OSAHS and OSAHS with arterial hypertension: potential diagnostic and early warning markers
- PMID: 30285853
- PMCID: PMC6167890
- DOI: 10.1186/s12931-018-0894-9
MiRNA expression profiles in healthy OSAHS and OSAHS with arterial hypertension: potential diagnostic and early warning markers
Abstract
Background: Obstructive sleep apnea-hypopnea syndrome (OSAHS) is prone to being complicated with various cardiovascular, cerebrovascular and metabolic conditions. OSAHS, due to its multifactorial nature, entails individualized and comprehensive treatment. So far, no well-established diagnostic criteria for the disease are available. In recent years, miRNA has been shown to be a sensitive biomarker suggestive of the progression and prognosis of many diseases. In this study, we examined some serum miRNAs in healthy OSAHS (OSAHS patients without complication) and OSAHS with arterial hypertension, with an attempt to understand the potential effects on the disease, improve the diagnosis of OSAHS and find OSAHS-related diagnostic markers.
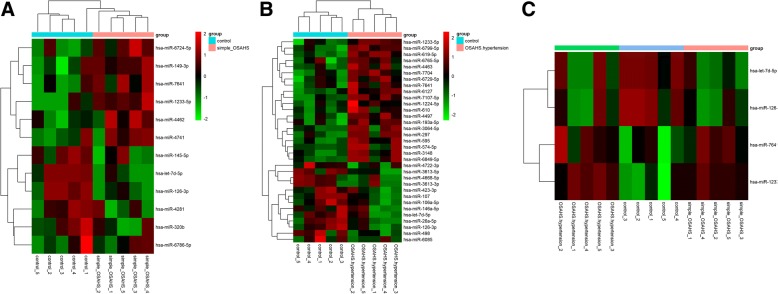
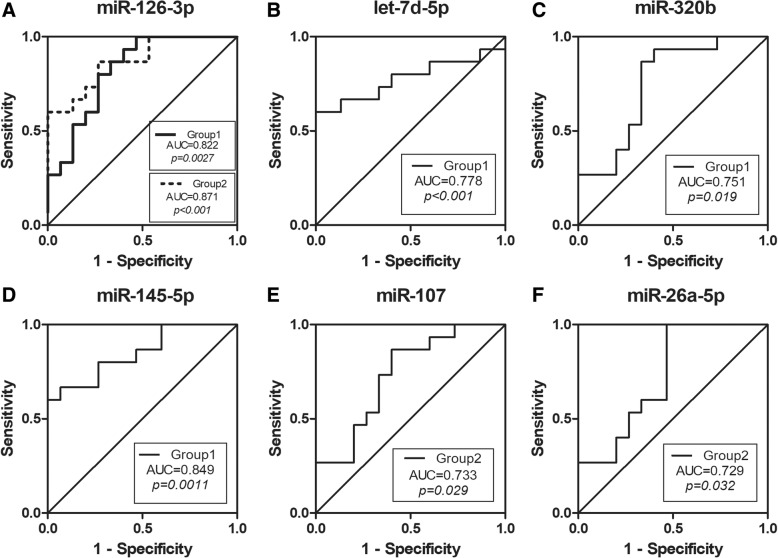
Methods: Against various diagnostic criteria, participants were divided into three groups: healthy OSAHS, OSAHS with arterial hypertension and healthy controls. Their serum miRNA profiles were assessed by microarray technology, and then differentially expressed miRNAs were verified by quantitative real-time PCR (qRT-PCR). The receiver operating characteristic (ROC) curves of miRNAs were constructed and the areas under the curve (AUC) were calculated. Meanwhile, the miRNAs were subjected to logistic regression analysis. The target genes were bioinformatically assessed, their functions and signaling pathways further determined and eventually an miRNA-gene network was established.
Results: Analysis with the miRNA array exhibited that, compared with the control group, 12 differentially expressed miRNAs were found in healthy OSAHS, and 33 were found in OSAHS with arterial hypertension. The expression of miR-126-3p, let-7d-5p, miR-7641 and miR-1233-5p, miR-320b, miR-145-5p, miR-107, miR-26a-5p were validated by using qRT-PCR. Bioinformatics analysis predicted that the potential target genes of these miRNAs might be involved in metabolism, and the regulation of endothelial cells and nervous system. Moreover, the ROC analysis showed that the using miR-145-5p and let-7d-5p in combination can identify the healthy OSAHS, presence of miR-126-3p, miR-26a-5p and miR-107 was well indicative of OSAHS with arterial hypertension.
Conclusions: A cluster of dysregulation miRNAs have been found to be involved in the development of OSAHS patients. Moreover, these miRNAs might be used to be potential diagnostic and early warning markers.
Keywords: Complications; Diagnostic; Marks; OSAHS; miRNAs.
Conflict of interest statement
Ethics approval and consent to participate
This study was approved by the Ethics Committee of the Union Hospital of Tongji Medical College, Huazhong University of Science and Technology, Wuhan, China (2015-S1001), and written informed consent was obtained from all participants.
Consent for publication
Not applicable.
Competing interests
The authors declare that they have no competing interests.
Publisher’s Note
Springer Nature remains neutral with regard to jurisdictional claims in published maps and institutional affiliations.
Figures


References
-
- The Report of an American Academy of Sleep Medicine Task Force. Sleep-related breathing disorders in adults: recommendations for syndrome definition and measurement techniques in clinical research. Sleep. 1999;22(5):667–89. - PubMed
MeSH terms
Substances
Grants and funding
LinkOut - more resources
Full Text Sources
Medical
Molecular Biology Databases
