. 2018 Oct 4;14(10):e1006484.
doi: 10.1371/journal.pcbi.1006484. eCollection 2018 Oct.

Prediction of gene regulatory enhancers across species reveals evolutionarily conserved sequence properties

Affiliations

Prediction of gene regulatory enhancers across species reveals evolutionarily conserved sequence properties

Ling Chen et al. PLoS Comput Biol. .

Abstract

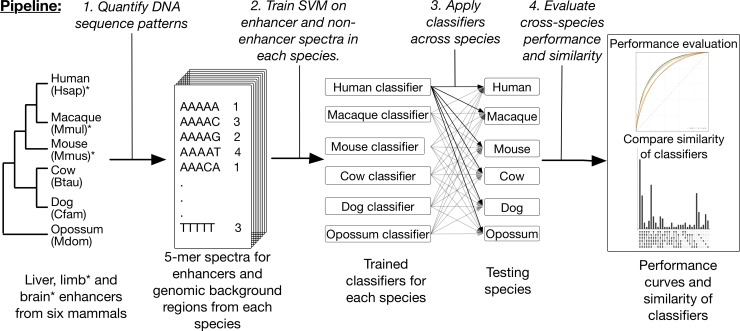
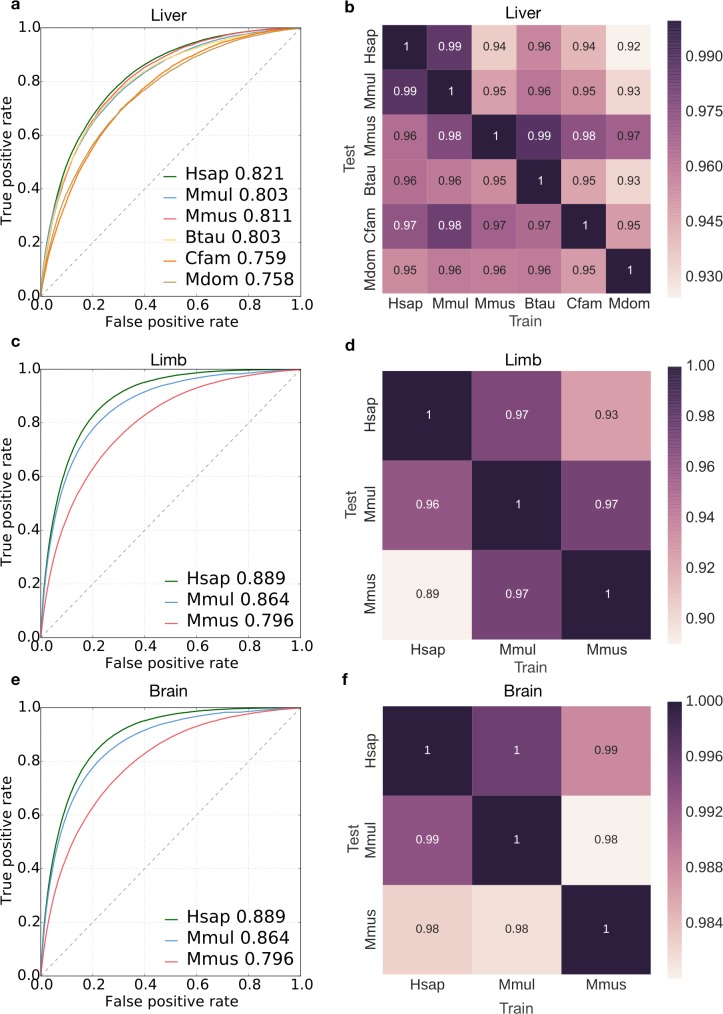
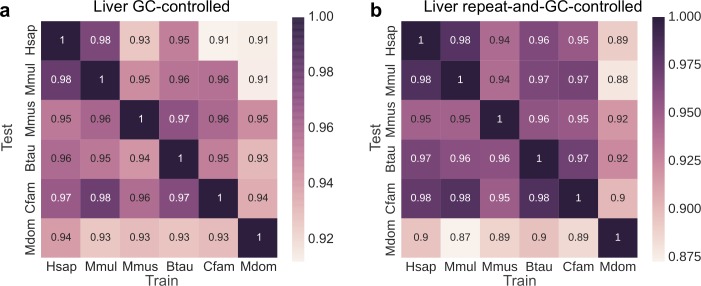
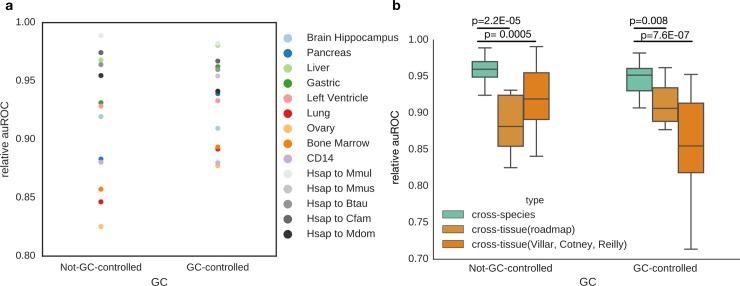
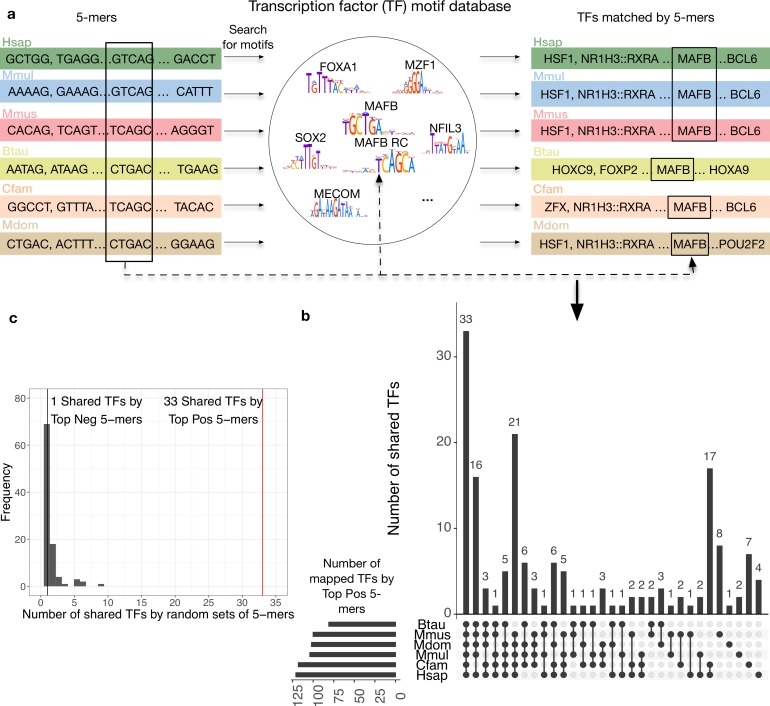
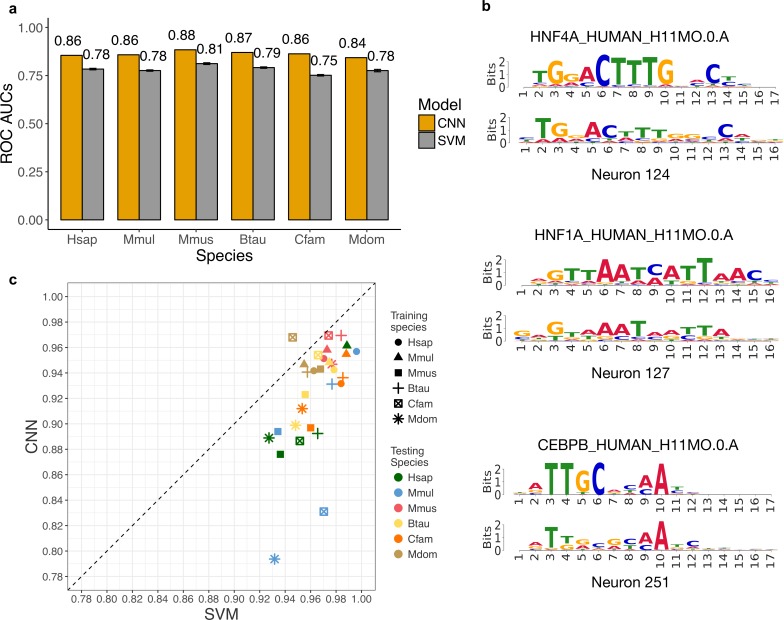
Genomic regions with gene regulatory enhancer activity turnover rapidly across mammals. In contrast, gene expression patterns and transcription factor binding preferences are largely conserved between mammalian species. Based on this conservation, we hypothesized that enhancers active in different mammals would exhibit conserved sequence patterns in spite of their different genomic locations. To investigate this hypothesis, we evaluated the extent to which sequence patterns that are predictive of enhancers in one species are predictive of enhancers in other mammalian species by training and testing two types of machine learning models. We trained support vector machine (SVM) and convolutional neural network (CNN) classifiers to distinguish enhancers defined by histone marks from the genomic background based on DNA sequence patterns in human, macaque, mouse, dog, cow, and opossum. The classifiers accurately identified many adult liver, developing limb, and developing brain enhancers, and the CNNs outperformed the SVMs. Furthermore, classifiers trained in one species and tested in another performed nearly as well as classifiers trained and tested on the same species. We observed similar cross-species conservation when applying the models to human and mouse enhancers validated in transgenic assays. This indicates that many short sequence patterns predictive of enhancers are largely conserved. The sequence patterns most predictive of enhancers in each species matched the binding motifs for a common set of TFs enriched for expression in relevant tissues, supporting the biological relevance of the learned features. Thus, despite the rapid change of active enhancer locations between mammals, cross-species enhancer prediction is often possible. Our results suggest that short sequence patterns encoding enhancer activity have been maintained across more than 180 million years of mammalian evolution.


Conflict of interest statement

The authors have declared that no competing interests exist.

Figures

Fig 1
Fig 1. Overview of the framework for evaluating DNA patterns predictive of enhancer activity across diverse mammals.
Starting with liver, limb and brain enhancers and genomic background regions from six mammals, the first step of the pipeline quantified each of these genomic regions by their 5-mer spectrum—the frequency of occurrence of all possible length five DNA sequence patterns. Using the spectra as features, we trained a spectrum kernel support vector machine (SVM) to distinguish enhancers from non-enhancers in each species and evaluated their performance with ten-fold cross validation. Then, we applied classifiers trained on one species to predict enhancer activity in all other species. Finally, we evaluated the performance of cross-species prediction compared to within species prediction and quantified the similarity of different species’ classifiers by the sharing of TF motifs among the most predictive 5-mers. Limb and brain enhancer data were only available for human, macaque, and mouse.
Fig 2
Fig 2. Performance of DNA sequence-based enhancer identification in diverse mammals.
(a) ROC curves for classification of liver enhancers vs. the genomic background in six diverse mammals: human (Hsap), macaque (Mmul), mouse (Mmus), cow (Btau), dog (Cfam), and opossum (Mdom). (b) ROC curves for classification of developing limb enhancers in human, macaque, and mouse. (c) ROC curves for classification of developing brain enhancers in human, macaque, and mouse. Area under the curve (AUC) values are given after the species name. Ten-fold cross validation was used to generate all ROC and PR curves (S1a, b, c Fig).
Fig 3
Fig 3. Human-trained enhancer classifiers accurately predicted liver, limb and brain enhancers in diverse mammals.
(a) ROC curves of the performance of the human liver enhancer classifier applied to the human (Hsap), macaque (Mmul), mouse (Mmus), cow (Btau), dog (Cfam) and opossum (Mdom) datasets. Area under the curve (auROC) values are given after the species name. (b) Heat map showing the relative auROC of liver enhancer classifiers applied across species compared to the performance of classifiers trained and evaluated on the same species (Fig 2A). The classifiers were trained on the species listed on the x-axis and tested on species on the y-axis. (c) ROC curves showing the performance of the human limb enhancer classifier on human, macaque and mouse. (d) Heat map showing the relative auROC of limb enhancer classifiers applied across species compared to the performance of classifiers trained and evaluated on the same species (Fig 2B). (e) ROC curves showing the performance of the human brain enhancer classifier on human, macaque and mouse. (f) Heat map showing the relative auROC of brain enhancer classifiers applied across species compared to the performance of classifiers trained and evaluated on the same species (Fig 2C). The raw auROC and auPR values for all comparisons are given in S4, S6 and S7 Figs.
Fig 4
Fig 4. Enhancer sequence properties remain conserved across diverse mammals after controlling for both GC-content and repetitive elements.
The heat maps give the cross-species relative auROCs for SVM classifiers trained on 5-mer spectra to identify enhancers in the species along the x-axis, and then used to predict enhancers in the species on the y-axis. The “negative” training regions from the genomic background were matched to the enhancers’: (a) GC-content, and (b) GC-content and proportion overlap with repetitive elements.
Fig 5
Fig 5. Enhancer classifiers generalize more accurately across the same tissue in different species than across different tissues in the same species.
(a) The human-trained liver classifier obtains better performance when applied to liver enhancers from other species (gray dots) than when applied to enhancers from other human tissues. This also holds for GC-controlled analyses, with the exception of predicting enhancers active in the gastric mucosa. (b) In the not-GC-controlled analysis, the cross-species performance (average relative auROC = 96.2%) is significantly better than the cross-tissue (roadmap) performance (88.4%, Mann Whitney U test, P = 0.00005) and the cross-tissue (Villar, Cotney, Reilly) performance (92.0%, Mann Whitney U test, P = 2.2E-05). This also holds true for the GC-controlled analysis. The cross-species performance (average relative auROC = 94.6%) is significantly better than the cross-tissue (roadmap) performance (91.2%, Mann Whitney U test, P = 0.008) and the cross-tissue (Villar, Cotney, Reilly) performance (85.8%, Mann Whitney U test, P = 7.6E-07).
Fig 6
Fig 6. The DNA sequence patterns most predictive of liver activity across species matched a common set of transcription factors.
(a) Transcription factor analysis workflow. For each species enhancer classifier, we found TF motifs matched by the top 5% positively weighted 5-mers. Note that different 5-mers (marked with black box on the left) can match the same motif, e.g., MAFB and its reverse complement (RC). The overlap of matched TFs were then compared across each species’ classifier. (b) 33 of the TF motifs matched by the top 5% positive 5-mers from each GC-controlled liver classifier are shared in all species. The total number of TFs matched by top 5-mers in each species was: 121 (human), 104 (macaque), 100 (mouse), 81 (cow), 118 (dog), 102 (opossum). Similar results were observed for the non-GC-controlled classifier (S20 Fig). (c) The number of TFs matched by all species based on 5-mers in top positive, top negative, and 100 random sets of 5% of all possible 5-mers. The 33 TF motifs shared among the high-weight set for each species is thus significantly more than expected.
Fig 7
Fig 7. CNNs identify enhancers more accurately than 5-mer spectrum SVM models, but generalize less well across species.
(a) The auROCs of CNN models are substantially better than the 5-mer SVM model in each species. The error bars give the standard error of ten-fold cross-validation for the SVM models. (b) Neurons in the first layer of the CNN learned the motifs of important liver TFs, including HNF4A, HNF1A, and CEBPB. (c) The relative auROCs of the CNN models applied across species are consistently lower than for the 5-mer SVMs applied across the same species. This suggests that the CNN models do not generalize as well across species as the SVM models.

References

    1. Shlyueva D, Stampfel G, Stark A. Transcriptional enhancers: from properties to genome-wide predictions. Nat Rev Genet. Nature Publishing Group; 2014;15: 272–286. 10.1038/nrg3682 - DOI - PubMed
    1. Consortium RE, Kundaje A, Meuleman W, Ernst J, Bilenky M, Yen A, et al. Integrative analysis of 111 reference human epigenomes. Nature. 2015;518: 317–330. 10.1038/nature14248 - DOI - PMC - PubMed
    1. Maurano MT, Humbert R, Rynes E, Thurman RE, Haugen E, Wang H, et al. Systematic Localization of Common Disease-Associated Variation in Regulatory DNA. Science (80-). 2012;337: 1190–1195. 10.1126/science.1222794 - DOI - PMC - PubMed
    1. Corradin O, Scacheri PC. Enhancer variants: evaluating functions in common disease. Genome Med. 2014;6: 85 10.1186/s13073-014-0085-3 - DOI - PMC - PubMed
    1. Brazel AJ, Vernimmen D. The complexity of epigenetic diseases. Journal of Pathology. 2016. pp. 333–344. 10.1002/path.4647 - DOI - PMC - PubMed

Publication types