Inter- and intra-host sequence diversity reveal the emergence of viral variants during an overwintering epidemic caused by dengue virus serotype 2 in southern Taiwan
- PMID: 30286095
- PMCID: PMC6191158
- DOI: 10.1371/journal.pntd.0006827
Inter- and intra-host sequence diversity reveal the emergence of viral variants during an overwintering epidemic caused by dengue virus serotype 2 in southern Taiwan
Abstract
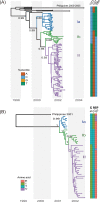
Purifying selection during dengue viral infection has been suggested as the driving force of viral evolution and the higher complexity of the intra-host quasi-species is thought to offer an adaptive advantage for arboviruses as they cycle between arthropod and vertebrate hosts. However, very few studies have been performed to investigate the viral genetic changes within (intra-host) and between (inter-host) humans in a spatio-temporal scale. Viruses of different serotypes from various countries imported to Taiwan cause annual outbreaks. During 2001-2003, two consecutive outbreaks were caused by dengue virus serotype 2 (DENV-2) and resulted in a larger-scale epidemic with more severe dengue cases in the following year. Phylogenetic analyses showed that the viruses from both events were similar and related to the 2001 DENV-2 isolate from the Philippines. We comprehensively analyzed viral sequences from representative dengue patients and identified three consensus genetic variants, group Ia, Ib and II, with different spatio-temporal population dynamics. The phylodynamic analysis suggested group Ib variants, characterized by lower genetic diversity, transmission rate, and intra-host variant numbers, might play the role of maintenance variants. The residential locations among the patients infected by group Ib variants were in the outer rim of case clusters throughout the 2001-2003 period whereas group Ia and II variants were located in the centers of case clusters, suggesting that group Ib viruses might serve as "sheltered overwintering" variants in an undefined ecological niche. Further deep sequencing of the viral envelope (E) gene directly from individual patient serum samples confirmed the emergence of variants belonging to three quasi-species (group Ia, Ib, and II) and the ancestral role of the viral variants in the latter phase of the 2001 outbreak contributed to the later, larger-scale epidemic beginning in 2002. These findings enhanced our understanding of increasing epidemic severity over time in the same epidemic area. It also highlights the importance of combining phylodynamic and deep sequencing analysis as surveillance tools for detecting dynamic changes in viral variants, particularly searching for and monitoring any specific viral subpopulation. Such subpopulations might have selection advantages in both fitness and transmissibility leading to increased epidemic severity.
Conflict of interest statement
The authors have declared that no competing interests exist.
Figures


Similar articles
-
Increasing Clinical Severity during a Dengue Virus Type 3 Cuban Epidemic: Deep Sequencing of Evolving Viral Populations.J Virol. 2016 Apr 14;90(9):4320-4333. doi: 10.1128/JVI.02647-15. Print 2016 May. J Virol. 2016. PMID: 26889031 Free PMC article.
-
Molecular characterization and phylogenetic analysis of dengue viruses imported into Taiwan during 2011-2016.PLoS Negl Trop Dis. 2018 Sep 20;12(9):e0006773. doi: 10.1371/journal.pntd.0006773. eCollection 2018 Sep. PLoS Negl Trop Dis. 2018. PMID: 30235208 Free PMC article.
-
Tracking dengue virus type 1 genetic diversity during lineage replacement in an hyperendemic area in Colombia.PLoS One. 2019 Mar 7;14(3):e0212947. doi: 10.1371/journal.pone.0212947. eCollection 2019. PLoS One. 2019. PMID: 30845200 Free PMC article.
-
Molecular evolution of dengue viruses: contributions of phylogenetics to understanding the history and epidemiology of the preeminent arboviral disease.Infect Genet Evol. 2009 Jul;9(4):523-40. doi: 10.1016/j.meegid.2009.02.003. Epub 2009 Feb 13. Infect Genet Evol. 2009. PMID: 19460319 Free PMC article. Review.
-
Understanding dengue virus evolution to support epidemic surveillance and counter-measure development.Infect Genet Evol. 2018 Aug;62:279-295. doi: 10.1016/j.meegid.2018.04.032. Epub 2018 Apr 25. Infect Genet Evol. 2018. PMID: 29704626 Free PMC article. Review.
Cited by
-
The emergence and successful elimination of SARS-CoV-2 dominant strains with increasing epidemic potential in Taiwan's 2021 outbreak.Heliyon. 2023 Nov 20;9(12):e22436. doi: 10.1016/j.heliyon.2023.e22436. eCollection 2023 Dec. Heliyon. 2023. PMID: 38107297 Free PMC article.
-
Population bottlenecks and founder effects: implications for mosquito-borne arboviral emergence.Nat Rev Microbiol. 2021 Mar;19(3):184-195. doi: 10.1038/s41579-020-00482-8. Epub 2021 Jan 11. Nat Rev Microbiol. 2021. PMID: 33432235 Free PMC article. Review.
-
Application of Next-Generation Sequencing to Reveal How Evolutionary Dynamics of Viral Population Shape Dengue Epidemiology.Front Microbiol. 2020 Jun 19;11:1371. doi: 10.3389/fmicb.2020.01371. eCollection 2020. Front Microbiol. 2020. PMID: 32636827 Free PMC article. Review.
-
Fatal Human Infection with Evidence of Intrahost Variation of Eastern Equine Encephalitis Virus, Alabama, USA, 2019.Emerg Infect Dis. 2021 Jul;27(7):1886-1892. doi: 10.3201/eid2707.210315. Emerg Infect Dis. 2021. PMID: 34152960 Free PMC article.
-
The emergence of NY10: insights into the 2012 West Nile Virus outbreak in the United States.Virus Evol. 2025 May 14;11(1):veaf037. doi: 10.1093/ve/veaf037. eCollection 2025. Virus Evol. 2025. PMID: 40574749 Free PMC article.
References
-
- dengue and severe dengue [Internet]. World Health Organization. 2013. Available from: http://www.who.int/mediacentre/factsheets/fs117/en/.
-
- dengue and severe dengue [Internet]. World Health Organization. 2017. Available from: http://www.who.int/mediacentre/factsheets/fs117/en/.
Publication types
MeSH terms
LinkOut - more resources
Full Text Sources
Medical

