. 2018 Oct 4;13(10):e0203712.
doi: 10.1371/journal.pone.0203712. eCollection 2018.

Perfidious synaptic transmission in the guinea-pig auditory brainstem

Affiliations

Perfidious synaptic transmission in the guinea-pig auditory brainstem

Arkadiusz Stasiak et al. PLoS One. .

Abstract

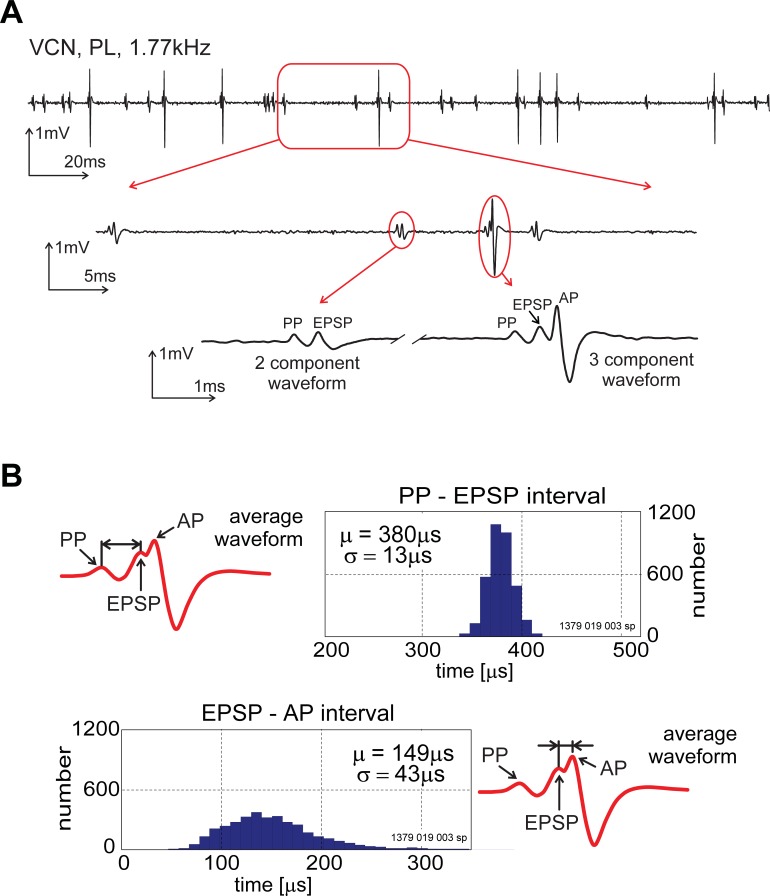
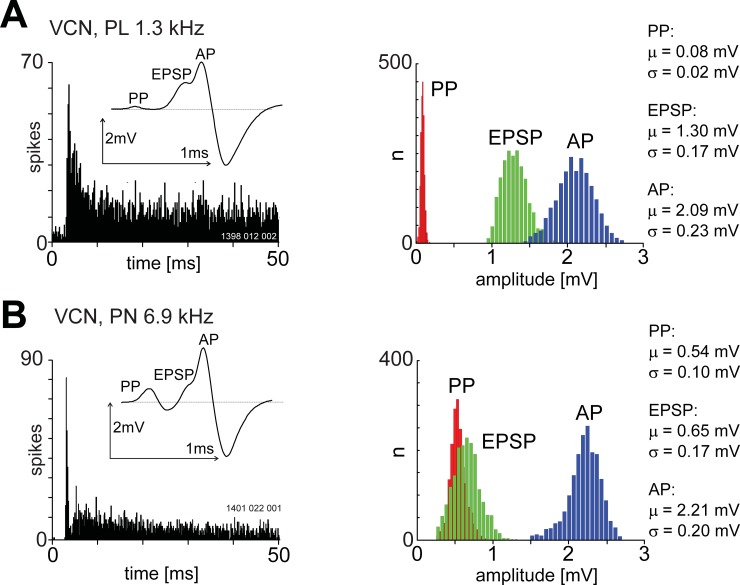
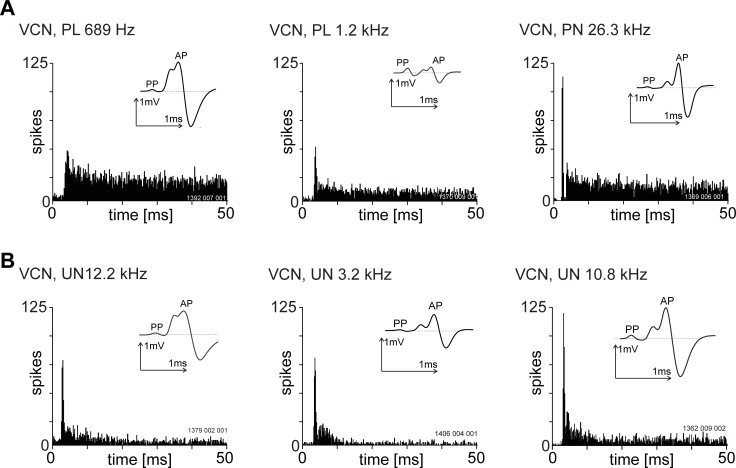
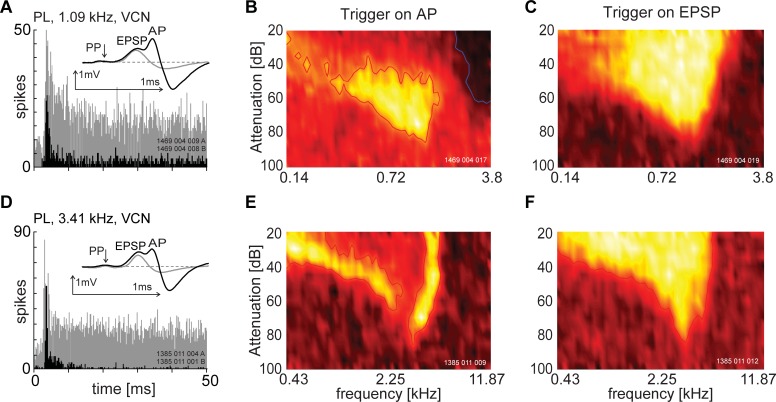
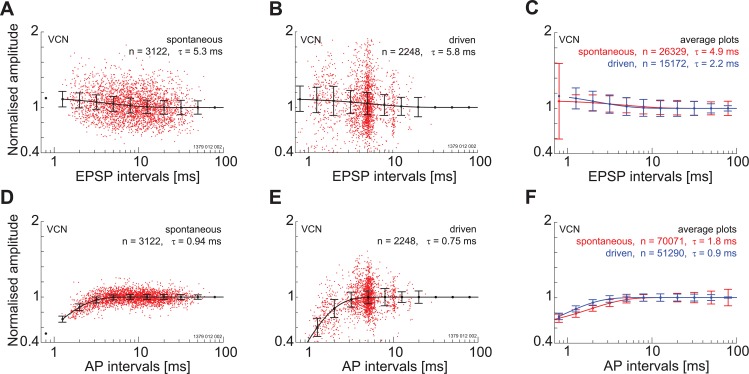
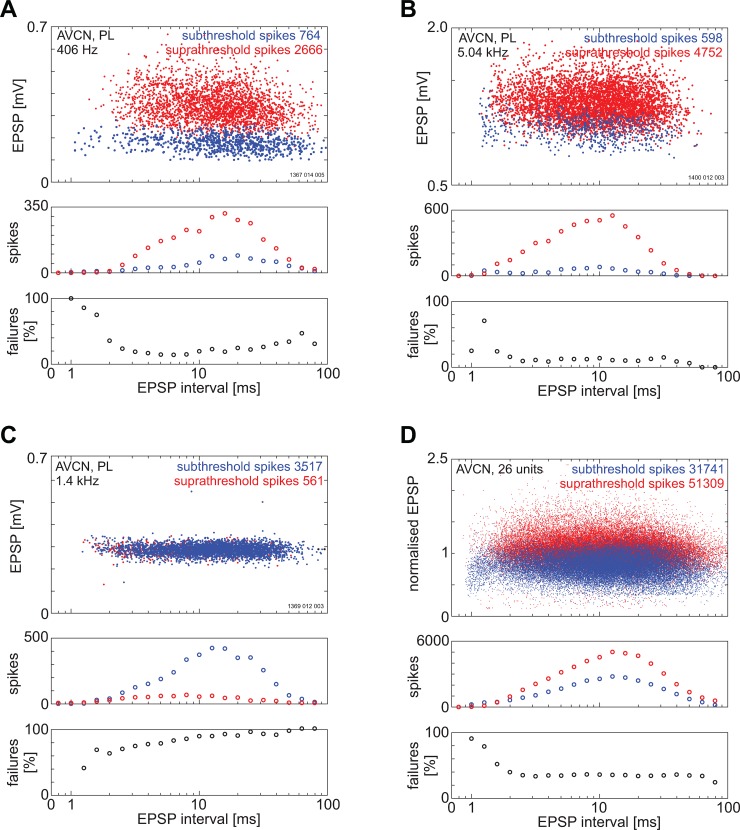
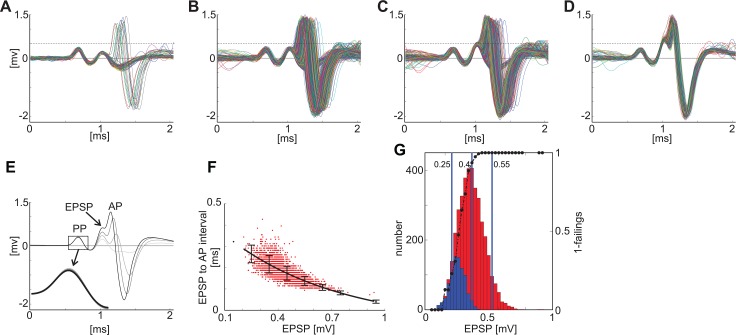
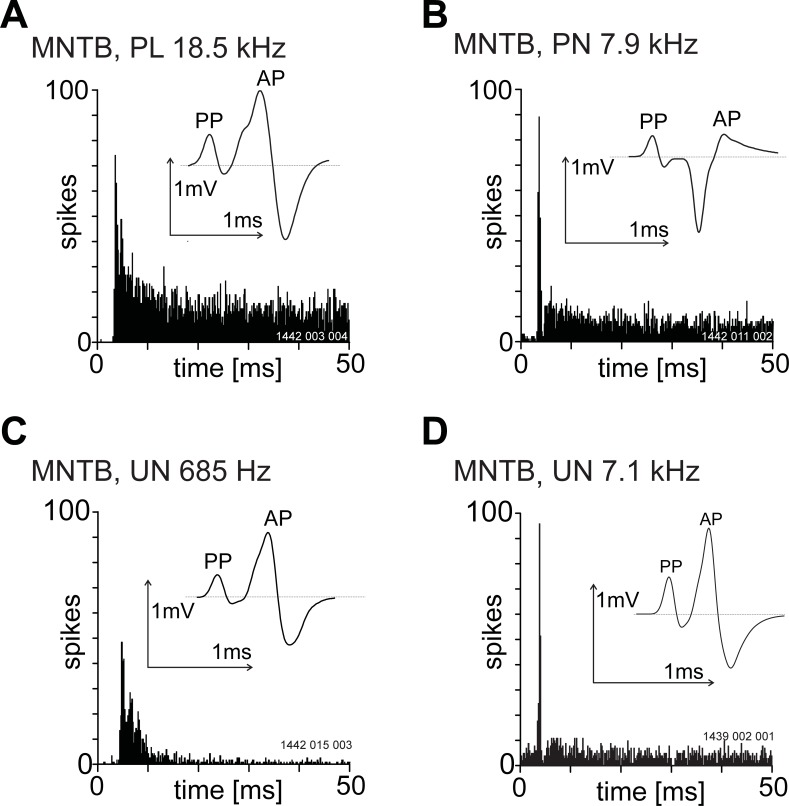
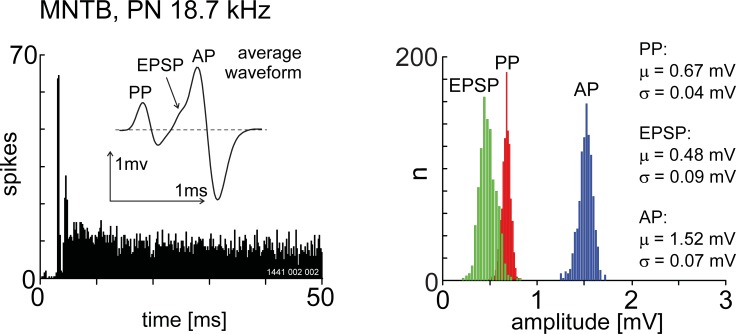
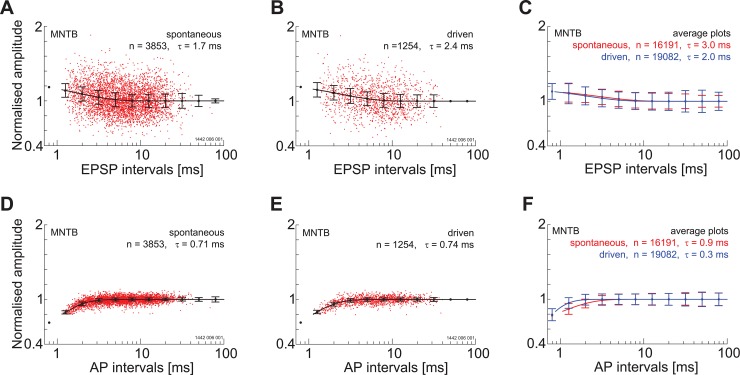
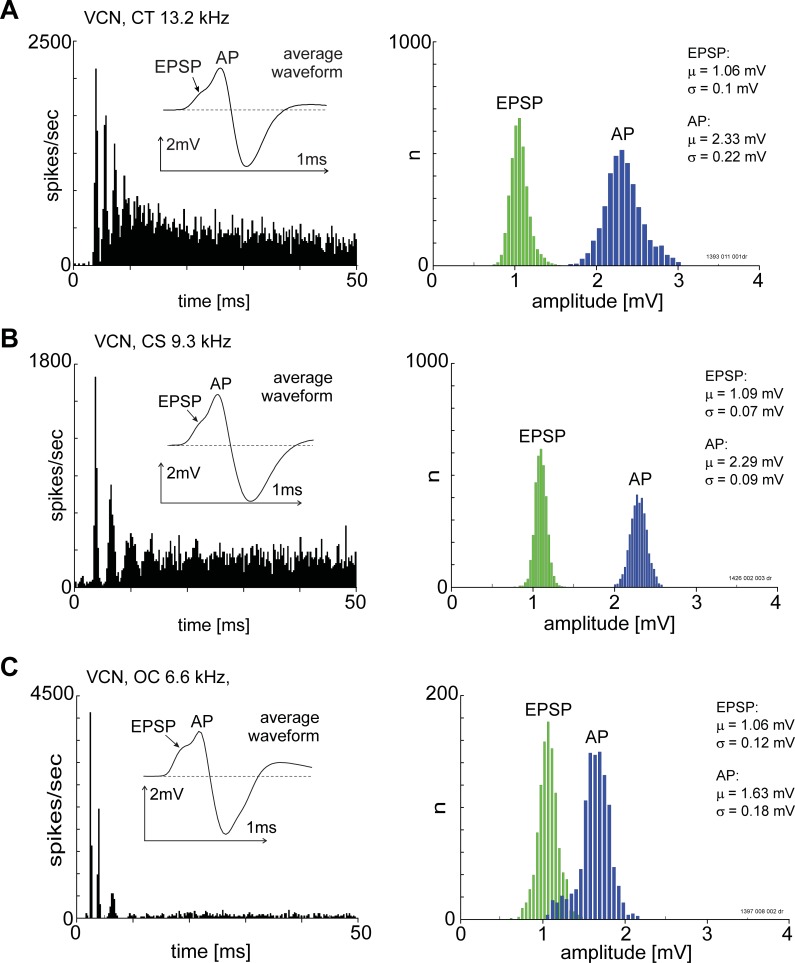
The presence of 'giant' synapses in the auditory brainstem is thought to be a specialization designed to encode temporal information to support perception of pitch, frequency, and sound-source localisation. These 'giant' synapses have been found in the ventral cochlear nucleus, the medial nucleus of the trapezoid body and the ventral nucleus of the lateral lemniscus. An interpretation of these synapses as simple relays has, however, been challenged by the observation in the gerbil that the action potential frequently fails in the ventral cochlear nucleus. Given the prominence of these synapses it is important to establish whether this phenomenon is unique to the gerbil or can be observed in other species. Here we examine the responses of units, thought to be the output of neurons in receipt of 'giant' synaptic endings, in the ventral cochlear nucleus and the medial nucleus of the trapezoid body in the guinea pig. We found that failure of the action-potential component, recorded from cells in the ventral cochlear nucleus, occurred in ~60% of spike waveforms when recording spontaneous activity. In the medial nucleus of the trapezoid body, we did not find evidence for action-potential failure. In the ventral cochlear nucleus action-potential failures transform the receptive field between input and output of bushy cells. Additionally, the action-potential failures result in "non-primary-like" temporal-adaptation patterns. This is important for computational models of the auditory system, which commonly assume the responses of ventral cochlear nucleus bushy cells are very similar to their "primary like" auditory-nerve-fibre inputs.


Conflict of interest statement

The authors have declared that no competing interests exist.

Figures

Fig 1
Fig 1. Complex waveforms recorded from spontaneous activity from a single unit in the ventral cochlear nucleus.
A, The plot shows three different time scales of spontaneous activity from a single unit. The longest timescale (top trace) shows what appear to be two discrete spike waveforms. This is confirmed by examining the same spike trace in two shorter time windows. The largest spikes show the traditional 3 component waveform whereas the smaller spikes have the PP and EPSP components but the AP component is absent. B, The upper plot shows the distribution of intervals between the PP and presumed EPSP components [PP-EPSP interval] for a single unit. The lower plot shows the distribution of intervals, for the same single unit, between the EPSP and AP components [EPSP-AP interval].
Fig 2
Fig 2. Unit thresholds as a function of BF.
PL, primary-like; PN, primary-like with a notch; UN, unusual. Solid symbols indicate unit had an identifiable pre-potential in its averaged spike waveform. Open symbols are non-PP units.
Fig 3
Fig 3. The amplitude distributions for the PP, EPSP and AP components for a primary-like (A) and primary-like with a notch (B) unit recorded from the ventral cochlear nucleus.
The unit BF is shown in the upper left of each PSTH. Bin-width was 0.2 ms and sound level was 20 dB above the BF threshold. The stimulus onset was at zero milliseconds and stimulus duration was 50 ms. Inset in the PSTH shows the 3-component averaged spike waveform. The primary-like unit is characterised by a low amplitude for the PP but a much higher mean amplitude for the EPSP. In contrast the PP and EPSP components are very similar for the primary-like with a notch unit. The amplitudes of the AP component are similar for both units.
Fig 4
Fig 4. Variety of post stimulus time histogram shapes in response to 20 dB, suprathreshold, BF tone bursts from single units recorded from the ventral cochlear nucleus and with a pre-potential.
All histograms were constructed from spike times recorded from the AP component. The unit BF is shown in the upper left of each PSTH. Bin-width was 0.2 ms. Inset in each PSTH is the averaged spike waveform shape. The stimulus onset was at zero milliseconds and stimulus duration was 50 ms. The top row shows three primary-like and primary-like-with-notch units and the bottom row shows three unusual units. Unusual units were arbitrarily identified as those with a steady-state discharge rate (30–40 ms post-stimulus onset time) less than 70 sp/s. The unit BF is indicated above each histogram.
Fig 5
Fig 5. Change in receptive field and temporal adaptation pattern by altering spike discrimination level from the action potential to the excitatory post-synaptic potential.
Upper post-stimulus time histogram is primary-like when triggered from the EPSP (grey). The receptive field was type-I (C). When triggered from the AP there are large areas of few spikes in the receptive field (B) and the PSTH (black) is now dominated by the large onset response. The lower PSTH shape is also primary-like when triggered on the EPSP (grey) and the receptive field is type-I. When triggering off the EPSP the PSTH (black) is dominated by an onset component and the receptive field is dominated by a large area in the middle which is reduced in firing rate. The stimulus onset was at zero milliseconds and stimulus duration was 50 ms. The receptive fields are normalised using a pseudo-colour plot where the lighter areas indicate greater activity and the darker areas less activity. The insets in Figs A and D show the average spike waveforms when triggered off the EPSP (grey) and the AP (black).
Fig 6
Fig 6. Amplitude of post-synaptic potentials depends on recent history in the ventral cochlear nucleus.
Relationship between both EPSP and AP component amplitude as a function of component interval for spontaneous activity (A, D) and driven activity (B,E) for a PL unit; BF = 0.2 kHz. Note that there is no evidence for depression of the EPSP component whereas the amplitude of the AP component decreases at short inter-component intervals. C and F show a population response for the same component intervals. There is a facilitation of the EPSP component amplitude and a depression of the AP component amplitude at the shortest intervals. Vertical lines are standard deviations.
Fig 7
Fig 7. The relationship between EPSP, action potential and EPSP interval in the ventral cochlear nucleus.
Note that EPSP amplitudes were normalised by dividing by the mean amplitude of the three longest binned intervals. Three single units have been selected to illustrate the range of responses (A-C) and a population of units averaged in (D). Red dots indicate the EPSPs that were accompanied by an AP i.e. were suprathreshold; Blue dots represent EPSPs that failed to elicit an AP i.e. subthreshold. In A there is a slight decline in the percentage of failures with increasing EPSP interval. In B there are relative few failures although they are fairly evenly spaced as a function of EPSP interval. In C the failures outnumber the successes and increase with increasing EPSP interval. A summary for 26 units is shown in panel D. The number of failures is greatest at the smallest EPSP intervals and then plateaus around an EPSP interval around 3 ms.
Fig 8
Fig 8. The smaller the EPSP component the more likely the AP component will fail.
The first row (A-D) shows the individual spike waveforms for 4 different amplitude ranges for the EPSP component for a single unit (Unusual unit; BF = 1.15kHz). Dotted lines are for visual guide only. For the lowest amplitude (A) the AP-component occurs only occasionally whereas for the highest amplitude (D) the AP-component never fails. This is summarised in the figure in the second row (E). The EPSP-AP interval decreases with increasing EPSP-amplitude (F). G shows the distribution of EPSP-amplitudes when accompanied by an AP-component (red bars) or not followed by an AP component (i.e. failures–blue bar). The dotted black line is the ratio of failures. At high EPSP- amplitudes the unit doesn’t fail.
Fig 9
Fig 9. The variety of post-stimulus time histogram shapes in response to 20 dB supra-threshold BF tone bursts from single units recorded from the presumed medial nucleus of the trapezoid body.
The unit best-frequency is indicated above each histogram. All histograms were constructed from spike times recorded from the AP-component. Bin-width was 0.2 ms. The stimulus onset was at zero milliseconds and stimulus duration was 50 ms. Inset in each PSTH is the averaged spike waveform shape. Note that in D the pre-potential is larger than the post-synaptic spike. In panel B the AP-component is negative going. UN, unusual.
Fig 10
Fig 10. The amplitude distributions for the PP, EPSP and AP components for a unit presumed to be located in the medial nucleus of the trapezoid body.
The unit BF was 18.7 kHz and was classified as primary-like with a notch based on the shape of the post-stimulus time histogram (A). The stimulus onset was at zero milliseconds and stimulus duration was 50 ms. Note that the PP is, on average, larger than the EPSP-component.
Fig 11
Fig 11. Amplitude of post-synaptic components depends on spike history in the medial nucleus of the trapezoid body.
A. Relationship between EPSP-component amplitude and inter-event interval for spontaneous activity for a single unit (PN; BF = 28.4 kHz). Note the facilitation at short intervals. B. A similar response is found for driven activity. C) The response of the population of single units. D-E) Relationship between the AP amplitude and inter-event interval. For both spontaneous activity and driven activity there is a slight reduction in AP amplitude at the shortest inter-event intervals. F. Population response. For all figures the lengths of the vertical lines represent one standard deviation.
Fig 12
Fig 12. PSTHs, averaged spike waveforms and spike amplitude distributions for three units without a pre-potential or primary-like PSTH shape.
The left-hand column shows spike waveforms (inset) with a discernible EPSP and AP components. The units were classified as transient chopper (top row), sustained chopper (middle row) and onset-chopper (bottom row). Unit BF is indicated at the top of each plot in the left column. The unit best-frequency is indicated above each histogram. All histograms were constructed from spike times recorded from the AP-component. Bin-width was 0.2 ms. The stimulus onset was at zero milliseconds and stimulus duration was 50 ms.

Similar articles

Cited by

References

    1. Borst JGG, Rusu SI. The Calyx of Held Synapse In: Trussell LO, Popper A, Fay RR, editors. Springer Handbook of Auditory Research: Synaptic Mechanisms in the Auditory System. New York: Springer; 2012. p. 95–134.
    1. Manis PB, Xie R, Wang Y, Marrs GS, Spirou GA. The Endbulbs of Held In: Trussell LO, Popper A, Fay RR, editors. Springer Handbook of Auditory Research: Synaptic Mechanisms in the Auditory System. New York: Springer; 2012. p. 61–94.
    1. Sayles M, Heinz MG. Afferent Coding and Efferent Control in the Normal and Impaired Cochlea In: Manley GA, Gummer AW, Popper AN, Fay RR, editors. Springer Handbook of Auditory Research: Understanding the Cochlea. 62 New York: Springer; 2017. p. 215–52.
    1. Joris PX. Entracking as a Brain Stem Code for Pitch: The Butte Hypothesis. Adv Exp Med Biol. 2016;894:347–54. Epub 2016/04/16. 10.1007/978-3-319-25474-6_36 . - DOI - PubMed
    1. Joris PX, Yin TC. A matter of time: internal delays in binaural processing. Trends Neurosci. 2007;30(2):70–8. Epub 2006/12/26. doi: S0166-2236(06)00275-X [pii] 10.1016/j.tins.2006.12.004 . - DOI - PubMed

Publication types