. 2018 Oct 4;13(10):e0204642.
doi: 10.1371/journal.pone.0204642. eCollection 2018.

High tension in sarcomeres hinders myocardial relaxation: A computational study

Affiliations

High tension in sarcomeres hinders myocardial relaxation: A computational study

Lauren J Dupuis et al. PLoS One. .

Abstract

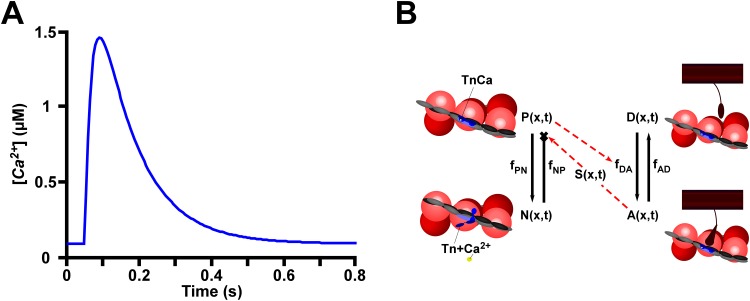
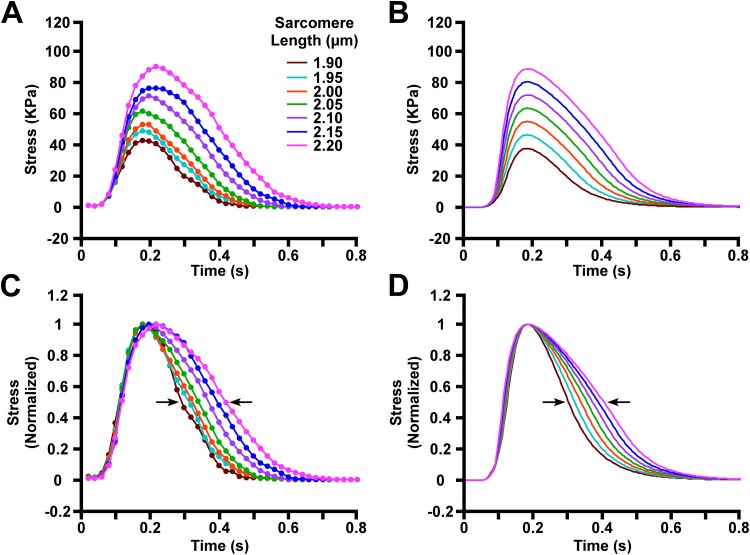
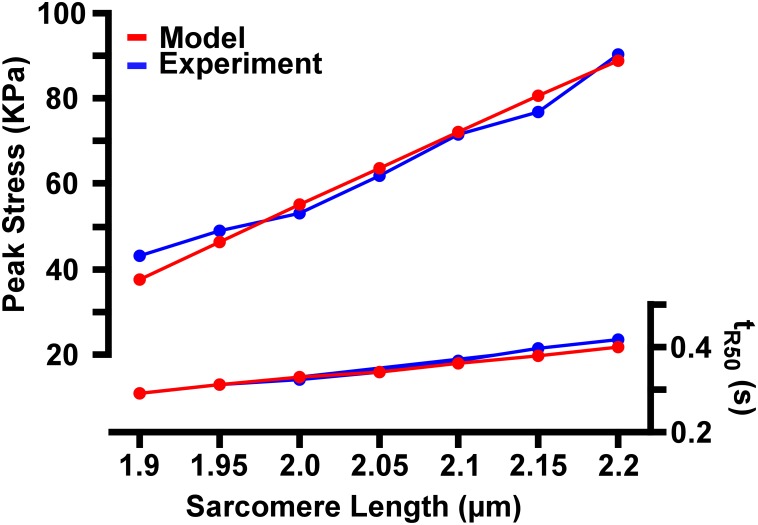
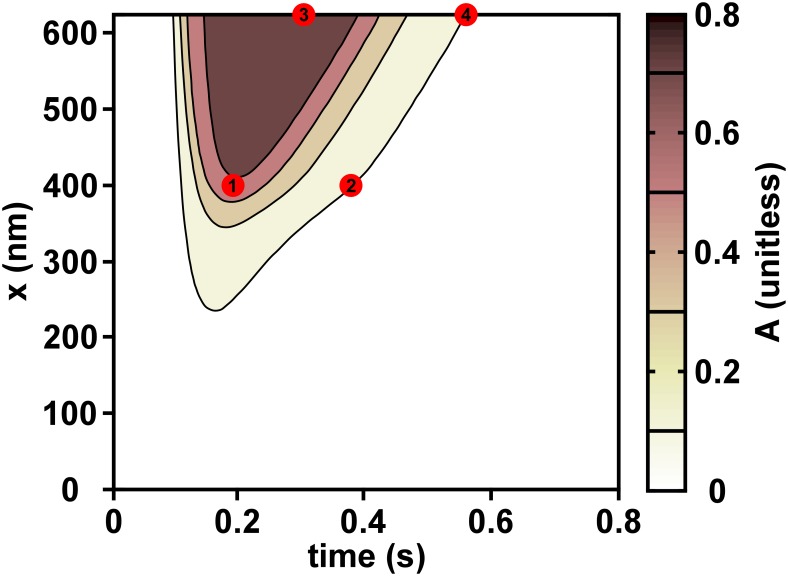
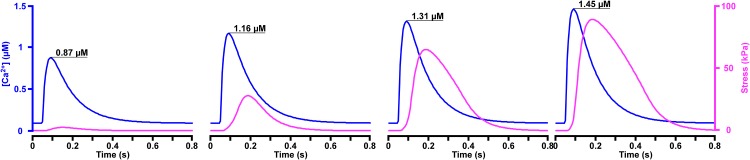
Experiments have shown that the relaxation phase of cardiac sarcomeres during an isometric twitch is prolonged in muscles that reached a higher peak tension. However, the mechanism is not completely understood. We hypothesize that the binding of calcium to troponin is enhanced by the tension in the thin filament, thus contributing to the prolongation of contraction upon higher peak tension generation. To test this hypothesis, we developed a computational model of sarcomere mechanics that incorporates tension-dependence of calcium binding. The model was used to simulate isometric twitch experiments with time dependency in the form of a two-state cross-bridge cycle model and a transient intracellular calcium concentration. In the simulations, peak isometric twitch tension appeared to increase linearly by 51.1 KPa with sarcomere length from 1.9 μm to 2.2 μm. Experiments showed an increase of 47.3 KPa over the same range of sarcomere lengths. The duration of the twitch also increased with both sarcomere length and peak intracellular calcium concentration, likely to be induced by the inherently coupled increase of the peak tension in the thin filament. In the model simulations, the time to 50% relaxation (tR50) increased over the range of sarcomere lengths from 1.9 μm to 2.2 μm by 0.11s, comparable to the increased duration of 0.12s shown in experiments. Model simulated tR50 increased by 0.12s over the range of peak intracellular calcium concentrations from 0.87 μM to 1.45 μM. Our simulation results suggest that the prolongation of contraction at higher tension is a result of the tighter binding of Ca2+ to troponin in areas under higher tension, thus delaying the deactivation of the troponin.


Conflict of interest statement

The authors have declared that no competing interests exist.

Figures

Fig 1
Fig 1. Schematic of the MechChem model.
(A) The displayed calcium transient derived from Rice et al. [10] is used as an input to the model. (B). Activation of the thin filament, moving from the non-permissive state (N(x,t)) to the permissive state (P(x,t)) occurs when calcium binds to the Tn. Myosin heads in the detached, non-force-generating state (D(x,t)) can only enter the bound, force-generating cross-bridge state (A(x,t)) if the XB binding sites are free for binding. Hence, P(x,t) increases the rate of cross-bridge attachment (fDA). A(x,t) determines the cross-bridge force density and hence the tension (S(x,t)) in the thin filament. The tension suppresses the rate of detachment of Ca2+ from Tn (fNP). Solid arrows represent state transition rates while the red dashed arrows indicate effects on state transition rates.
Fig 2
Fig 2. Tension traces of sarcomeres in isometric conditions.
(A) Experimentally measured tension traces at Lsarc ranging from 1.90 to 2.20 μm under isometric conditions. The dots are data points extracted from Figure 2 of Janssen and Hunter 1995 [8]. (B) Model simulated tension traces mimicking the conditions in A are displayed. (C) The experimentally measured tension data in A are each normalized to their own peak tension. The arrows in the figure represent the relaxation to 50% of the maximum stress level after the peak stress. (D) The model-generated tension traces in B are each normalized to their own peak tension.
Fig 3
Fig 3. Comparison of model predicted metrics with experimental results.
The peak tension and the time at which the muscle has relaxed by 50% (tR50) for each Lsarc are compared between the model prediction (red) and the experimental results (blue).
Fig 4
Fig 4. Proportion of force-generating cross-bridges (A) throughout an isometric twitch.
A is displayed for sarcomere with length 2.05 μm under isometric twitch conditions. The probability of formation of a force-generating cross-bridge depends both on time and position (x) along the single overlap region of the thin filament. Markers 1 and 2, located at 400 nm from the mid line, show the peak level of activation of 0.65 and when the activation level reaches 0.10, respectively. Markers 3 and 4, located at 625 nm from the mid line closest to the z-disk, show the peak level of activation 0.77 and the subsequent drop to 0.10, respectively.
Fig 5
Fig 5. Isometric twitch stress with increases in peak [Ca2+].
The input calcium transient (blue curves) increases its peak value from 0.87 μM to 1.45 μM while maintaining time constants of rise and decay. The related isometric twitch stress curves (magenta) are shown for a sarcomere length of 2.2 μm.

Similar articles

Cited by

References

    1. Bers DM. Calcium Fluxes Involved in Control of Cardiac Myocyte Contraction. Circulation Research. 2000;87(4):275–81. 10.1161/01.res.87.4.275 - DOI - PubMed
    1. Dobesh DP, Konhilas JP, de Tombe PP. Cooperative activation in cardiac muscle: impact of sarcomere length. American Journal of Physiology—Heart and Circulatory Physiology. 2002;282(3):H1055–H62. 10.1152/ajpheart.00667.2001 - DOI - PubMed
    1. Kentish JC, ter Keurs HE, Ricciardi L, Bucx JJ, Noble MI. Comparison between the sarcomere length-force relations of intact and skinned trabeculae from rat right ventricle. Influence of calcium concentrations on these relations. Circulation Research. 1986;58(6):755–68. 10.1161/01.res.58.6.755 - DOI - PubMed
    1. Sun Y-B, Lou F, Irving M. Calcium- and myosin-dependent changes in troponin structure during activation of heart muscle. The Journal of Physiology. 2009;587(Pt 1):155–63. 10.1113/jphysiol.2008.164707 - DOI - PMC - PubMed
    1. Dupuis LJ, Lumens J, Arts T, Delhaas T. Mechano-chemical Interactions in Cardiac Sarcomere Contraction: A Computational Modeling Study. PLOS Computational Biology. 2016;12(10):e1005126 10.1371/journal.pcbi.1005126 - DOI - PMC - PubMed

Publication types