. 2018 Oct 4;13(10):e0204935.
doi: 10.1371/journal.pone.0204935. eCollection 2018.

Application of insulin signaling to predict insect growth rate in Maruca vitrata (Lepidoptera: Crambidae)

Affiliations

Application of insulin signaling to predict insect growth rate in Maruca vitrata (Lepidoptera: Crambidae)

Md Abdullah Al Baki et al. PLoS One. .

Abstract

Insect growth is influenced by two major environmental factors: temperature and nutrient. These environmental factors are internally mediated by insulin/insulin-like growth factor signal (IIS) to coordinate tissue or organ growth. Maruca vitrata, a subtropical lepidopteran insect, migrates to different climate regions and feeds on various crops. The objective of this study was to determine molecular tools to predict growth rate of M. vitrata using IIS components. Four genes [insulin receptor (InR), Forkhead Box O (FOXO), Target of Rapamycin (TOR), and serine-threonine protein kinase (Akt)] were used to correlate their expression levels with larval growth rates under different environmental conditions. The functional association of IIS and larval growth was confirmed because RNA interference of these genes significantly decreased larval growth rate and pupal weight. Different rearing temperatures altered expression levels of these four IIS genes and changed their growth rate. Different nutrient conditions also significantly changed larval growth and altered expression levels of IIS components. Different local populations of M. vitrata exhibited significantly different larval growth rates under the same nutrient and temperature conditions along with different expression levels of IIS components. Under a constant temperature (25°C), larval growth rates showed significant correlations with IIS gene expression levels. Subsequent regression formulas of expression levels of four IIS components against larval growth rate were applied to predict growth patterns of M. vitrata larvae reared on different natural hosts and natural local populations reared on the same diet. All four formulas well predicted larval growth rates with some deviations. These results indicate that the IIS expression analysis explains the growth variation at the same temperature due to nutrient and genetic background.


Conflict of interest statement

The authors have declared that no competing interests exist.

Figures
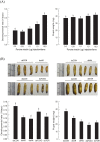
Fig 1
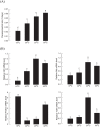
Fig 1. Effect of IIS components on larval growth of M. vitrata.
(A) Stimulating effect of a porcine insulin on larval growth at 25°C rearing temperature. L5D1 (newly molted < 12 h) larvae were injected with different doses of insulin. Each dose was applied to 30 larvae. Developmental rate was calculated by inverse of the elapsed time (days) from injection to pupation. Pupal weight was measured within 8 h after pupation. (B) RNAi effect of IIS components (InR, Akt, FOXO or TOR) on larval growth. RNAi was performed by injecting 1 μg of gene-specific dsRNA to L5D1. A viral gene, CpBV302, was used as control dsRNA (‘dsCON’). Each RNAi treatment used 15 larvae. Different letters above standard deviation bars indicate significant difference among means at Type I error = 0.05 (LSD test).
Fig 2
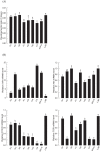
Fig 2. Effect of ambient temperature on larval growth of M. vitrata.
(A) Change in developmental rates at four different temperatures. Newly hatched larvae were reared until pupation with an artificial diet. Developmental rate was calculated by inverse of the total larval period (days). Each temperature treatment used 30 larvae. (B) Change in expression levels of four IIS component genes (InR, Akt, FOXO, and TOR). These four genes’ expression levels in L5D1 larvae reared at different temperatures from L1 were quantified. Each treatment used nine randomly selected larvae. mRNA levels were relatively quantified and compared to mRNA levels in L5D1 reared at 25°C. Actin was used as reference gene for RT-qPCR to normalize target gene’s expression level. Different letters above standard deviation bars indicate significant difference among means at Type I error = 0.05 (LSD test).
Fig 3
Fig 3. Effect of different nutritional diets on larval growth of M. vitrata.
Newly hatched larvae (L1D1) were treated with seven different diets at a constant temperature of 25°C: a standard artificial diet (‘AD’), three adzuki bean diets at different nutritional amounts, and three cowpea diets at different nutritional amounts (S1 Table). (A) Diet effect on larval growth. Developmental rate was calculated by inverse of time period (days) from L1D1 to L5D1 (the first day of fifth instar). Pupal weight was measured within 8 h after pupation. Each diet treatment used 30 larvae. (B) Changes in expression levels of four IIS component genes (InR, Akt, FOXO, and TOR). These four genes’ expression levels in L5D1 of larvae reared with different diets from L1 were quantified. Each treatment used nine randomly selected larvae. mRNA levels were relatively quantified and compared to mRNA level of L5D1 reared with AD diet. Actin was used as reference gene in RT-qPCR to normalize target gene’s expression level. Different letters above standard deviation bars indicate significant difference among means at Type I error = 0.05 (LSD test). (C) Regression between gene expression levels and developmental rates. Dot lines indicate regression lines. Resulting regression equations are shown in Table 1.
Fig 4
Fig 4. Validation of IIS-growth regression model between IIS expression levels and larval developmental rate of M. vitrata.
Practical growth patterns of M. vitrata larvae were obtained by rearing larvae in the laboratory with artificial diet (‘LAB’) and six natural hosts: Vigna unguiculata Jangchae (‘Vu’), Glycine max Daewon (‘Gm-DW’), Glycine max Pungsannamul (‘Gm-PS’), Glycine max Cheongja-3ho (‘Gm-CJ’), Glycine max Socheongja (‘Gm-SC’), and Vigna angularis Hongeon (‘Va’). (A) Effect of host on larval growth. Developmental rate was calculated by inverse of the total larval period (days). Each host treatment used 30 larvae. (B) Change in expression levels of four IIS component genes (InR, Akt, FOXO, and TOR). These four genes’ expression levels in L5D1 of larvae reared on different hosts from L1 were quantified. Each treatment used nine randomly selected larvae. mRNA levels were relatively quantified and compared to mRNA levels in laboratory strain L5D1 reared with artificial diet. Actin was used as reference gene in RT-qPCR to normalize target gene’s expression level. Different letters above standard deviation bars indicate significant difference among means at Type I error = 0.05 (LSD test). (C) T-tests between the expected larval period (L1D1-L5D5) from regressions obtained from IIS gene expression levels and the observed larval period (L1D1-L5D5). Asterisk indicates significant difference between expected and observed values. ‘NS’ represents no significance at Type I error = 0.05.
Fig 5
Fig 5. Genetic distance analysis among 19 local populations of M. vitrata using RAPD.
Hierarchical clustering was performed using band polymorphism obtained from RAPD 8041 primer. These local populations included Myanmar (‘MYA’), China (‘CHINA’), Suwon 2018 (‘SW-N’), Suwon 2017 (‘SW-O’), Ganghwa (‘GH’), Pyungchang (‘PC’), Hoeungsung (‘HS’), Seosan (‘SS’), Ansan (‘AS’), Yeongju (‘YJ’), Paju (‘PJ’), Iksan (‘IS’), Miryang (‘MY’), Taean (‘TA’), Youngwol (‘YW’), Yangpyeong (‘YP’), Inje (‘IJ’), Hongchun (‘HC’), and a laboratory strain (‘LAB’). Local coordinates are 37°5′12.7″N 127°22′28.1″E for AS, 36°53′53.71″N 127°9′47.97″E for CA, 37°48′03.1″N 126°14′03.3″E for GH, 37°46′27″N 128°00′57″E for HC, 37°26′28″N 128°8′46″E for HS, 38°1′25″N 128°17′0″E for IJ, 35°44′29.04″N 129°2′14.28″E for KJ, 35°29′40.22″N 128°44′11.52″E for MY, 37°22′46.722″N 128°21′55.985″E for PC, 37°58′13.52″N 126°56′44.75″E for PJ, 36°45′57.22″N 126°30′11.64″E for SS, 37°15′43″N 126°59′15″E for SW, 36°40′6.47″N 126°18′4.95″E for TA, 37°6′56″N 127°23′11″E for YI, 37°33′16.81″N 127°43′03.19″E for YP, and 37°11′18″N 128°22′20″E for YW.
Fig 6
Fig 6. Effect of different genetic backgrounds on larval growth of M. vitrata.
Growth patterns of M. vitrata larvae were obtained from a laboratory strain reared with artificial diet (‘LAB’) and eight local populations: Gyoungju (‘GJ’), Hongchun (‘HC’), Ansan (‘AS’), Paju (‘PJ’), Youngwol (‘YW’), Hoeungsung (‘HS’), Suwon (‘SW-N’), and Chonan (‘CA’). (A) Variation in larval growth of different local populations under the same rearing conditions at constant temperature 25°C with a standard artificial diet. Developmental rate was calculated by inverse of the total larval period (days). Each local population treatment used 30 larvae. (B) Change in expression levels of four IIS component genes (InR, Akt, FOXO, and TOR). These four genes’ expression levels in L5D1 larvae of eight local populations reared at constant temperature of 25°C and a standard artificial diet from L1 were quantified. Each treatment used nine randomly selected larvae. mRNA levels were relatively quantified and compared to mRNA level in L5D1 larvae reared in the laboratory with artificial diet. Actin was used as reference gene of RT-qPCR to normalize target gene’s expression level. Different letters above standard deviation bars indicate significant difference among means at Type I error = 0.05 (LSD test). (C) T-test between the expected larval period (L1D1-L5D5) from regressions obtained from IIS gene expression levels and the observed larval period (L1D1-L5D5). Asterisk indicates significant difference between expected and observed values. ‘NS’ represents no significance at Type I error = 0.05.

Similar articles

Cited by

References

    1. Nijhout HF. Development and evolution of adaptive polyphenisms. Evol Dev 2003;5:9–18. - PubMed
    1. Koyama T, Mirth CK. Unravelling the diversity of mechanisms through which nutrition regulates body size in insects. Curr Opin Insect Sci 2018;25:1–8. 10.1016/j.cois.2017.11.002 - DOI - PubMed
    1. Riddiford LM, Hiruma K, Zhou X, Nelson CA. Insights into the molecular basis of the hormonal control of molting and metamorphosis from Manduca sexta and Drosophila melanogaster. Insect Biochem Mol Biol 2003;33:1327–1338. - PubMed
    1. Okamoto N, Yamanaka N. Nutrition-dependent control of insect development by insulin-like peptides. Curr Opin Insect Sci 2015;11:21–30. 10.1016/j.cois.2015.08.001 - DOI - PMC - PubMed
    1. Nagasawa H, kataoka H, Isogai A, Tamura S, Suzuki A, Ishizaki H. Amino-terminal amino acid sequence of the silkworm prothoracicotropic hormone: homology with insulin. Science 1984;226:1344–1345. 10.1126/science.226.4680.1344 - DOI - PubMed

Publication types