. 2018 Oct 4;13(10):e0205109.
doi: 10.1371/journal.pone.0205109. eCollection 2018.

Functional analysis of a triplet deletion in the gene encoding the sodium glucose transporter 3, a potential risk factor for ADHD

Affiliations

Functional analysis of a triplet deletion in the gene encoding the sodium glucose transporter 3, a potential risk factor for ADHD

Nadine Schäfer et al. PLoS One. .

Abstract

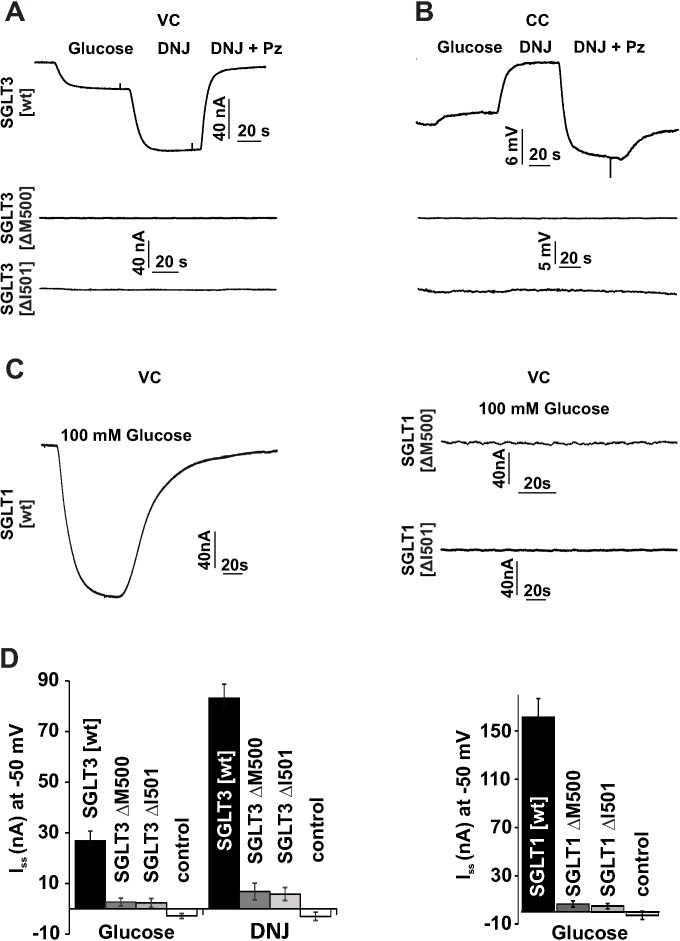
Sodium-glucose transporters (SGLT) belong to the solute carrier 5 family, which is characterized by sodium dependent transport of sugars and other solutes. In contrast, the human SGLT3 (hSGLT3) isoform, encoded by SLC5A4, acts as a glucose sensor that does not transport sugar but induces membrane depolarization by Na+ currents upon ligand binding. Whole-exome sequencing (WES) of several extended pedigrees with high density of attention-deficit/hyperactivity disorder (ADHD) identified a triplet ATG deletion in SLC5A4 leading to a single amino acid loss (ΔM500) in the hSGLT3 protein imperfectly co-segregating with the clinical phenotype of ADHD. Since mutations in homologous domains of hSGLT1 and hSGLT2 were found to affect intestinal and renal function, respectively, we analyzed the functional properties of hSGLT3[wt] and [ΔM500] by voltage clamp and current clamp recordings from cRNA-injected Xenopus laevis oocytes. The cation conductance of hSGLT3[wt] was activated by application of glucose or the specific agonist 1-desoxynojirimycin (DNJ) as revealed by inward currents in the voltage clamp configuration and cell depolarization in the current clamp mode. Almost no currents and changes in membrane potential were observed when glucose or DNJ were applied to hSGLT3[ΔM500]-injected oocytes, demonstrating a loss of function by this amino acid deletion in hSGLT3. To monitor membrane targeting of wt and mutant hSGLT3, fusion constructs with YFP were generated, heterologously expressed in Xenopus laevis oocytes and analyzed for membrane fluorescence by confocal microscopy. In comparison to hSGLT3[wt] the fluorescent signal of mutant [ΔM500] was reduced by 43% indicating that the mutant phenotype might mainly result from inaccurate membrane targeting. As revealed by homology modeling, residue M500 is located in TM11 suggesting that in addition to the core structure (TM1-TM10) of the transporter, the surrounding TMs are equally crucial for transport/sensor function. In conclusion, our findings indicate that the deletion [ΔM500] in hSGLT3 inhibits membrane targeting and thus largely disrupts glucose-induced sodium conductance, which may, in interaction with other ADHD risk-related gene variants, influence the risk for ADHD in deletion carriers.


Conflict of interest statement

The authors have declared that no competing interests exist.

Figures

Fig 1
Fig 1. WES screening identified a mutation in the glucose sensor SGLT3 in ADHD patients.
(A) Pedigree of family P14 with a heterozygous triplet ATG deletion in SLC5A4 leading to a single amino acid loss in SGLT3 (ΔM500), imperfectly co-segregating with the clinical phenotype of ADHD. Shading of squares (male) and circles (female) indicate affected (black) and healthy (white) family members with the SLCLC5A4 genotype carriers indicated below. (B) Representative Sanger sequencing of homozygous (upper panel) and heterozygous (lower panel) genotypes demonstrate a deletion of three nucleotides (c.1498-1500delATG) in heterozygous individuals (asterisk) resulting in a deletion of methionine 500 in the SGLT3 protein. Numbering refers to nucleotides of the open reading frame derived from the healthy (upper panel) and the mutated (lower panel) alleles.
Fig 2
Fig 2. Dependence of SGLT3 currents on external sodium and glucose concentrations.
(A) Two-electrode-voltage clamp recordings (VH = -50 mV) from Xenopus laevis oocytes injected with hSGLT3 display DNJ-induced inward currents that decrease by reduction of the external sodium concentration. Representative current traces from oocytes injected with hSGLT3 or water (control oocytes) are shown. (B) Bar graph quantifies hSGLT3 currents induced by 100mM glucose at different external sodium concentrations (n = 6 ± SD of two independent experiments). (C) Continuous recordings from oocytes expressing hSGLT3 display sodium inward currents that increase in amplitude by elevating the external concentration of D-glucose as indicated (VH = -50 mV; [Na+]e = 30 mM; pH 5). (D) Dose-response curve of hSGLT3 currents activated by different glucose concentrations as recorded in panel C. Data were fitted with Michaelis-Menten equation resulting in a K0.5-value of 6.0±0.9 mM (n = 6 ± SD of two independent experiments).
Fig 3
Fig 3. Loss of function by deletion of M500/I501 in hSGLT3 and hSGLT1.
(A and B) Xenopus laevis oocytes injected with cRNA of hSGLT3[wt], hSGLT3[ΔM500] and hSGLT3[ΔI501] were recorded in the voltage clamp mode (VC, panel A) and in the current clamp mode (CC, panel B). Representative continuous recordings at a holding potential of –50 mV, 30 mM Na+ and pH 5 from oocytes expressing hSGLT3[wt] display sodium currents in response to D-glucose (75 mM) and Deoxynojirimycin (DNJ; 10μM). Currents were blocked by the specific inhibitor Phlorizin (Pz; 240 μM). Current clamp recordings of the same oocyte reveal D-glucose- and DNJ-induced depolarization as well as phlorizin-induced hyperpolarization of the cell. Using identical conditions, no current or voltage responses were observed in oocytes expressing hSGLT3[ΔM500] or hSGLT3[ΔI501]. (C) Oocytes injected with cRNA of hSGLT1[wt], hSGLT1[ΔM500] and hSGLT1[ΔI501] were measured in the absence and presence of 100 mM glucose (pH 5, 30 mM Na+ and a membrane potential of -50 mV). Oocytes expressing hSGLT1[wt] display sodium currents in response to glucose, whereas no responses were observed in oocytes expressing hSGLT1[ΔM500] or hSGLT1[ΔI501]. (D) Left panel: bar graph quantifies current amplitudes in response to either D-glucose (75 mM) or DNJ (10 μM) at -50 mV and 30 mM Na+. As a negative control, results from H2O-injected oocytes are displayed (n = 6 ± SD of two independent experiments). Right panel: bar graph quantifies current amplitudes in response to D-glucose (100 mM) at -50 mV and 30 mM Na+ of hSGLT1[wt], hSGLT1[ΔM500] and hSGLT1[ΔI501] and water controls (n = 6 ± SD of two independent experiments).
Fig 4
Fig 4. Targeting of hSGLT3 and hSGLT1 to the plasma membrane is impaired by deletion of M500 or I501.
(A) Crude membrane fractions of Xenopus laevis oocytes injected with cRNA of wildtype and mutated hSGLTs or H2O (control) were analyzed by western immunoblotting. As revealed by specific hSGLT3 and hSGLT1 antibodies, signals of wildtype and mutant injected oocytes were almost identical with no specific signal in water-injected oocytes. A single protein band present in samples and control (αSGLT1) are due to cross-reactivity of the antibody (compare S3 Fig). Loading of identical amounts of protein was controlled by detection of endogenous actin with the appropriate antibody (one representative experiment out of 2 independent experiments is shown). (B) Representative confocal laser scanning images of Xenopus laevis oocytes injected with YFP-tagged hSGLT constructs are shown. Membrane fluorescences of the mutated hSGLT1 and hSGLT3 are substantially lower as compared to wildtype. (C) Bar graphs show the fluorescence intensity of the mutants hSGLT[ΔM500] or hSGLT[ΔI501] as proportion of the respective wt fluorescence (n = 6 ± SD of two independent experiments, * indicate p < 0.01; ** indicate p < 0.001).
Fig 5
Fig 5. A structural perspective of the ΔM500 deletion found in hSGLT3.
(A and B) Homology model of hSGLT3 that show the localization of mutated residues M500 (orange sphere), E457 (yellow sphere), R503 (pink sphere) and R499 (green sphere) and residues involved in Na+ (blue spheres) and sugar binding (black spheres) from a side (A) and top (B) perspective. Core TM helices 1–10 are shown in transparent silver whereas the surrounding helices are red and loop regions not supported by the model template are shown as silver strings. The modelled hSGLT3 carrier cavity/vestibule is shown in blue as a mesh structure.

Similar articles

Cited by

References

    1. Mueckler M, Thorens B. The SLC2 (GLUT) family of membrane transporters. Mol Aspects Med. 2013;34: 121–138. 10.1016/j.mam.2012.07.001 - DOI - PMC - PubMed
    1. Wright EM. Glucose transport families SLC5 and SlC50. Mol Aspects Med. 2013;34: 182–196. - PubMed
    1. Wright EM, Loo DDF, Hirayama BA. Biology of human sodium glucose transporters. Physiol Rev. 2011;91: 733–794. 10.1152/physrev.00055.2009 - DOI - PubMed
    1. Eskandari S, Wright EM, Kreman M, Starace DM, Zampighi GA. Structural analysis of cloned plasma membrane proteins by freeze-fracture electron microscopy. Proc Natl Acad Sci USA. 1998;95: 11235–11240. - PMC - PubMed
    1. Turk E, Kim O, le Coutre J, Whitelegge JP, Eskandari S, Lam JT, et al. Molecular characterization of Vibrio parhaemolyticus vSGLT: a model for sodium-coupled sugar transport. J Biol Chem. 2000;275: 25711–25716. 10.1074/jbc.M003127200 - DOI - PubMed

Publication types

MeSH terms