. 2018 Nov;178(3):1390-1405.
doi: 10.1104/pp.18.00840. Epub 2018 Oct 4.

SENSITIVE TO SALT1, An Endoplasmic Reticulum-Localized Chaperone, Positively Regulates Salt Resistance

Affiliations

SENSITIVE TO SALT1, An Endoplasmic Reticulum-Localized Chaperone, Positively Regulates Salt Resistance

Peiyan Guan et al. Plant Physiol. 2018 Nov.

Abstract

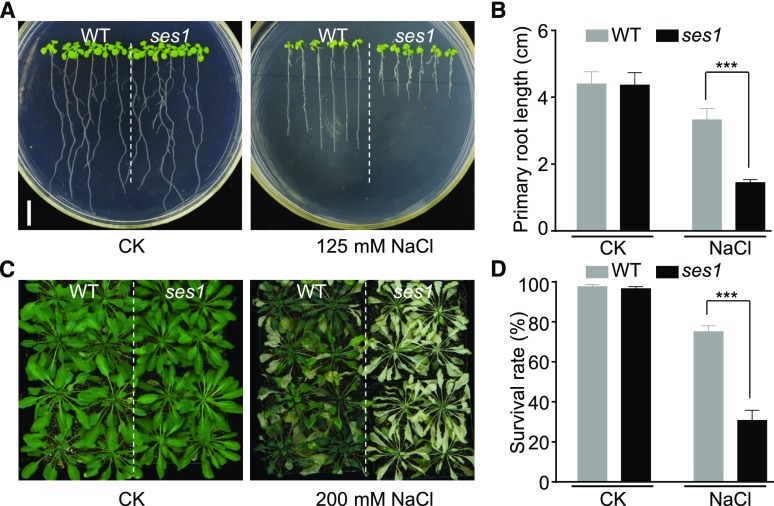
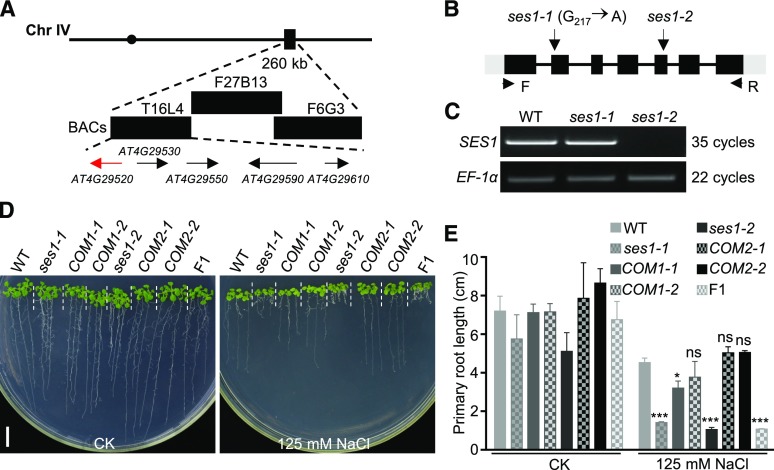
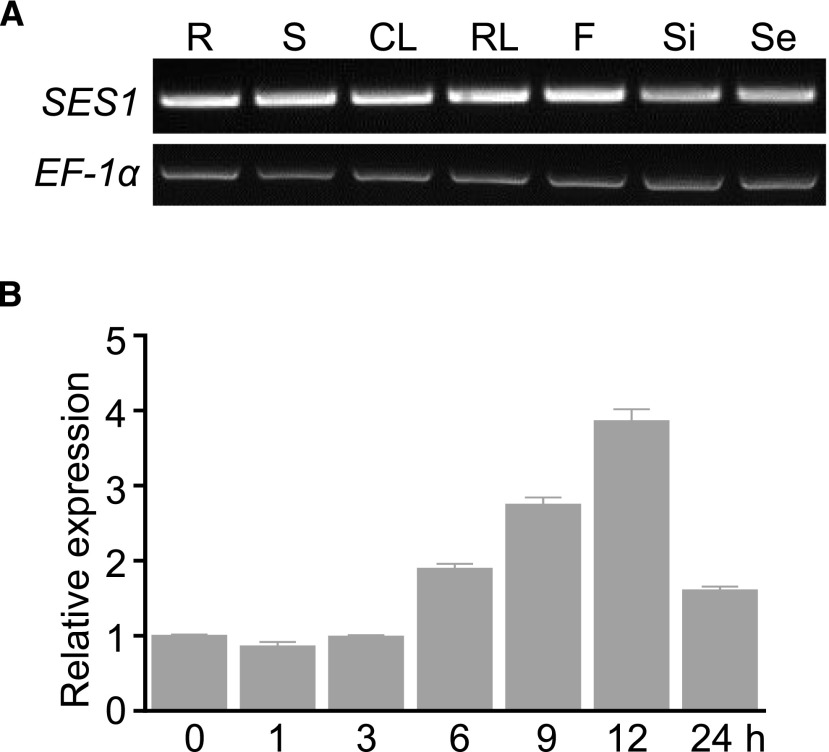
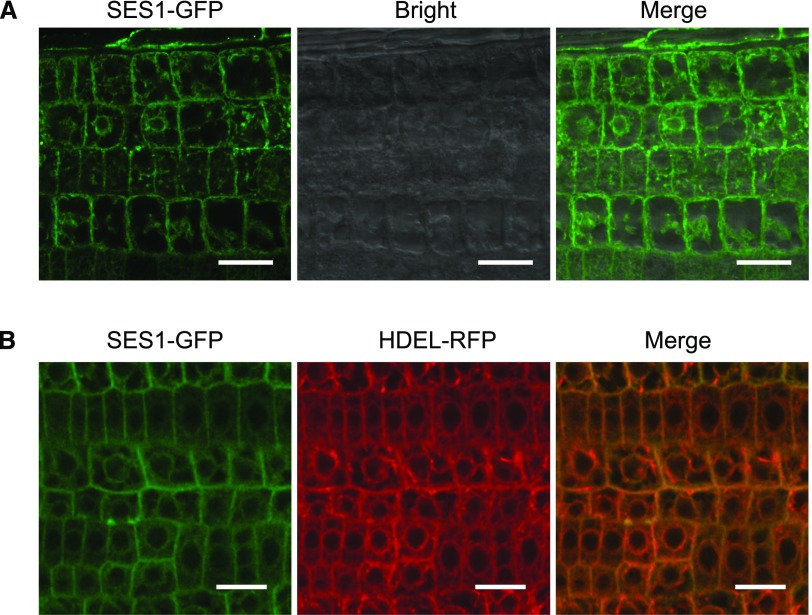
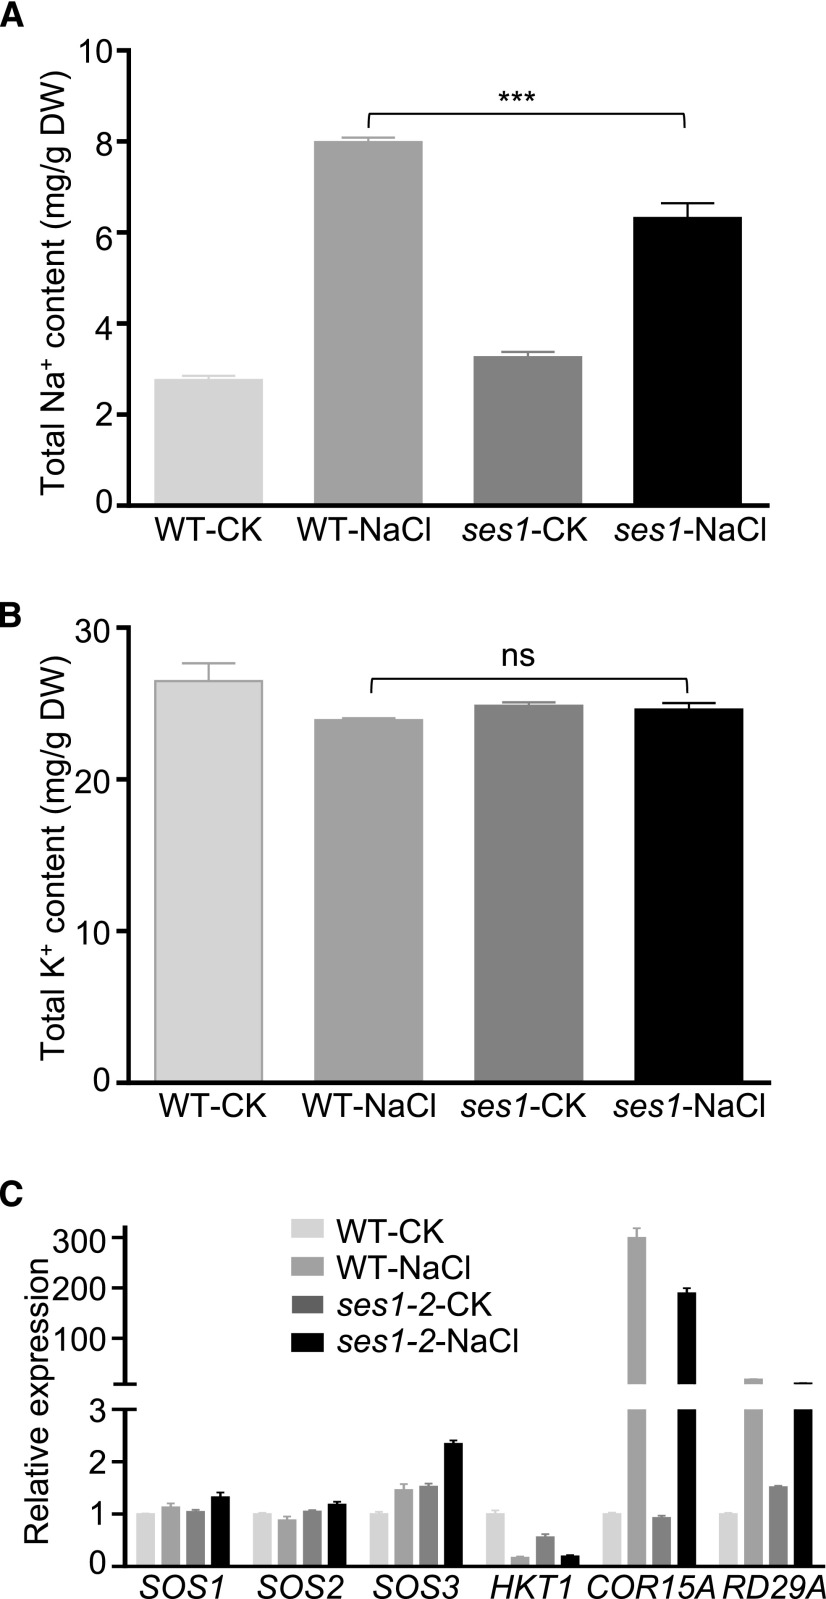
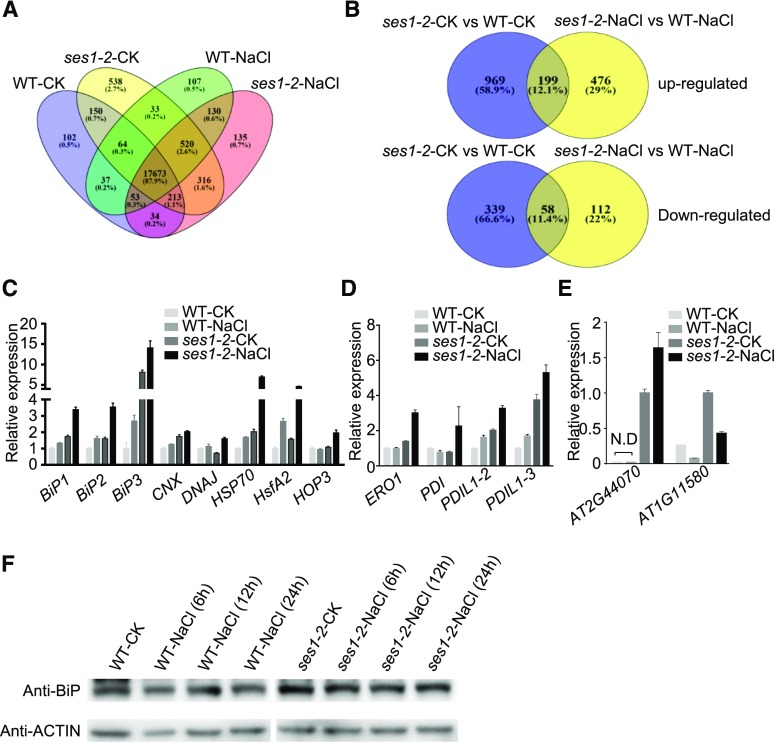
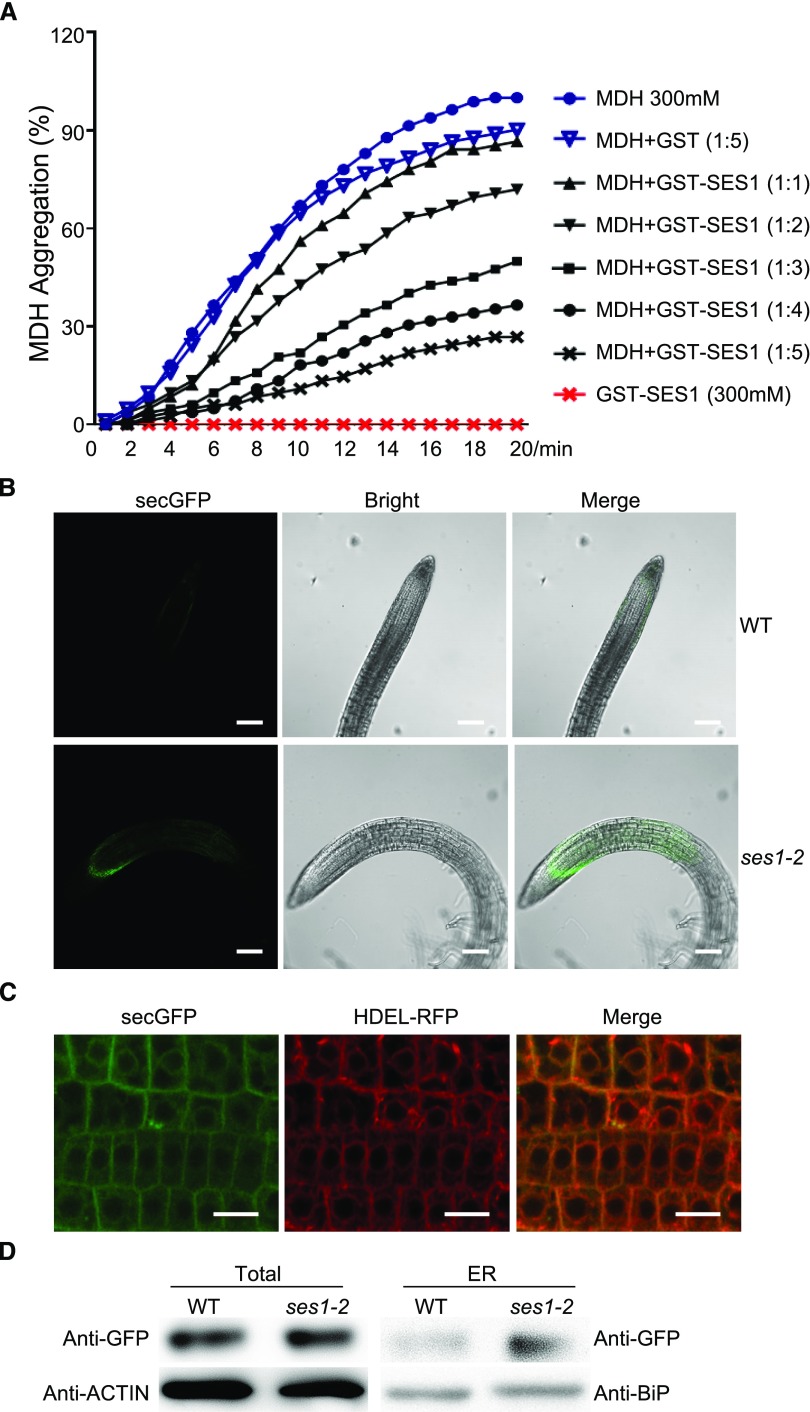
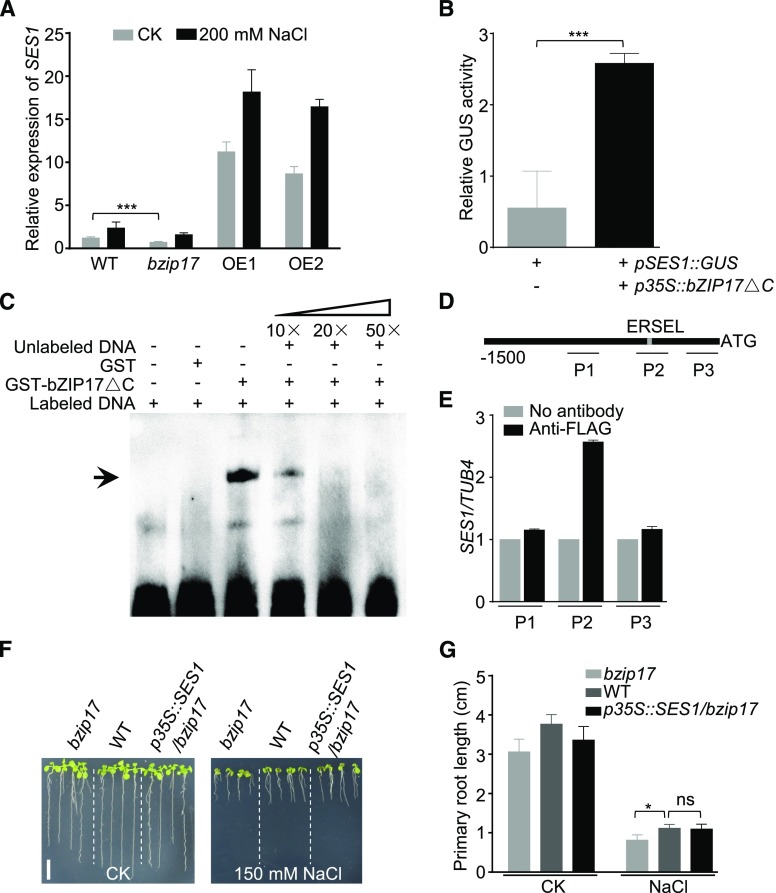
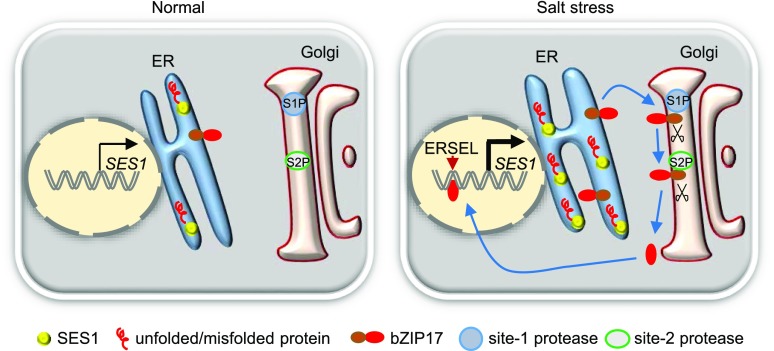
Salt stress seriously affects plant growth and development. Through genetic screening, we identified and characterized an Arabidopsis (Arabidopsis thaliana) sensitive to salt1 (ses1) mutant. SES1 was ubiquitously expressed and induced by salt treatment. The salt-sensitive phenotype of ses1 was due neither to the overaccumulation of Na+ nor to the suppression of salt tolerance-associated genes. SES1 encoded an uncharacterized endoplasmic reticulum (ER)-localized protein. Coinciding with its subcellular distribution, ses1 exhibited overactivation of unfolded protein response genes and was largely influenced by severe ER stress. Biochemical evidence revealed that SES1 functions as an important molecular chaperone to alleviate salt-induced ER stress. Furthermore, the ER stress sensor basic leucine zipper factor17 transactivated SES1 by binding directly to its promoter region. These results provide insights into salt stress responses and ER homeostasis and shed light on the mechanism by which SES1 modulates salt resistance.


Figures

Figure 1.
Figure 1.
The ses1 mutant is sensitive to salt stress. A, Images of wild-type (WT) and ses1 mutant seedlings grown on one-half-strength Murashige and Skoog (1/2 MS) agar plates with or without 125 mm NaCl treatment. Photographs were taken after growing vertically at 22°C for 7 d. Bar = 1 cm. B, Root length of the seedlings in A. Error bars indicate sd (n = 18). ***, P < 0.001 (Student’s t test). C, Images of 3-week-old wild-type and ses1 plants with or without 200 mm NaCl treatment. D, Survival rate of the wild-type and ses1 plants in C. Error bars indicate sd (n = 60). ***, P < 0.001 (Student’s t test).
Figure 2.
Figure 2.
Map-based cloning of SES1. A, Genetic mapping of SES1. Markers used for the genetic mapping are shown on the top, and the predicted genes are shown at the bottom. The arrows indicate the direction of transcription, and the candidate gene for SES1 is shown in red. BAC, Bacterial artificial chromosome. B, Genome structure of SES1. The black boxes, gray boxes, and lines indicate exons, untranslated regions, and introns, respectively. The positions of the ses1 mutant alleles and the PCR primers for RT-PCR are shown. C, RT-PCR analysis of the SES1 transcripts in wild-type (WT), ses1-1, and ses1-2 mutant plants. EF-1α was used as a loading control. D, Phenotypes of ses1-1, ses1-2, complementary lines (COM), and F1 mutants with or without 125 mm NaCl treatment. COM1-1 and COM1-2 are in the ses1-1 background, while COM2-1 and COM2-2 are in the ses1-2 background. Photographs were taken after growing vertically at 22°C for 10 d. Bar = 1 cm. E, Root length of the seedlings in D. Error bars indicate sd (n = 6). ns indicates no significant difference from the wild type. *, P < 0.05 and ***, P < 0.001 (Student’s t test).
Figure 3.
Figure 3.
Expression patterns of SES1. A, SES1 in different tissues detected by RT-PCR (35 cycles). EF-1α was used as a loading control (22 cycles). R, Root; S, stem; CL, cauline leaf; RL, rosette leaf; F, flower; Si, silique; Se, seed. B, Responsiveness of SES1 to NaCl treatment analyzed by RT-qPCR. RNA samples were extracted from 10-d-old seedlings after treatment with 200 mm NaCl for different periods. The data were normalized against the expression of ACTIN7 and UBQ10. The means were calculated from three independent replicates and compared with the no-treatment condition (0 h). Error bars indicate se.
Figure 4.
Figure 4.
SES1 is localized to the ER. A, GFP fluorescence of p35S::SES1-GFP transgenic lines was imaged with a high-resolution laser confocal microscope at 488 nm. Bars = 20 µm. B, GFP and RFP fluorescence of transgenic lines containing SES1-GFP and HDEL-RFP was imaged with a high-resolution laser confocal microscope at 488 and 610 nm, respectively. Bars = 20 µm.
Figure 5.
Figure 5.
Salt sensitivity of ses1 is not due to the overaccumulation of Na+. A, Na+ content in ses1-2 and wild-type (WT) plants with or without 200 mm NaCl treatment for 48 h. Bars indicate means ± sd of three independent measurements. ***, P < 0.001 (Student’s t test). B, K+ content in ses1-2 and wild-type plants with or without 200 mm NaCl treatment for 48 h. Bars indicate means ± sd of three independent measurements. ns indicates no significant difference (P < 0.05, Student’s t test). DW, Dry weight. C, Expression levels of genes involved in salt stress tolerance in ses1-2 and wild-type plants with or without 200 mm NaCl treatment. The data were normalized against ACTIN7 and UBQ10. The means were calculated from three independent replicates and compared with the no-treatment condition of wild-type plants (WT-CK). Error bars indicate se.
Figure 6.
Figure 6.
Altered expression of ER stress-associated genes in ses1-2. A, Venn diagram analysis of genes detected in wild-type (WT) and ses1-2 plants before and after salt treatment. B, Venn diagram analysis of differentially expressed genes in wild-type and ses1-2 plants before and after salt treatment. C, Expression levels of marker genes involved in the UPR pathway. D, Expression levels of marker genes involved in the ERAD pathway. E, Expression levels of marker genes that suppress translation in wild-type and ses1-2 plants before and after salt treatment. The data were normalized against ACTIN7 and UBQ10. The means were calculated from three independent replicates and compared with the no-treatment condition of wild-type (C and D) or ses1-2 (E) plants. Error bars indicate se. N.D, Not detected. F, Analysis of BiP protein levels in wild-type and ses1-2 seedlings before and after salt treatment. Total protein was extract from 10-d-old seedlings.
Figure 7.
Figure 7.
SES1 is involved in the ER stress response. A, Response of SES1 expression to the ER stress reagent TM (5 μg mL−1) for the indicated durations. The data were normalized against the expression of ACTIN7 and UBQ10. The means were calculated from three independent replicates and compared with the no-treatment condition (0 h). Error bars indicate se. B, Histochemical staining analysis of pSES1::GUS seedlings before and after 5 μg mL−1 TM treatment. Bar = 1 cm. C, Phenotypes of ses1, wild-type (WT), and overexpression (OE) lines with or without TM treatment. Photographs were taken after growing vertically at 22°C for 7 d. Bar = 1 cm. D, Root length of the seedlings in C. Error bars indicate sd (n = 6). Statistical differences from the wild type were determined by Student’s t test: ***, P < 0.001. E, Growth status of ses1, wild-type, and overexpression lines with or without TM treatment. Photographs were taken after growing at 22°C for 7 d. Bar = 1 cm. F, Cotyledon greening rate of ses1, wild-type, and overexpression lines with or without TM treatment. The bars indicate means ± sd of three independent measurements. Statistical differences from the wild type were determined by Student’s t test: ***, P < 0.001.
Figure 8.
Figure 8.
SES1 has chaperone activity. A, Holdase chaperone activity of SES1 with the model substrate MDH. MDH (300 μm) was incubated without or with recombinant GST-SES1 at 45°C for the indicated times. GST was used as a negative control. The means were calculated from three independent replicates. B, GFP fluorescence of p35S::secGFP in ses1-2 and wild-type (WT) transgenic lines was imaged with a high-resolution laser confocal microscope at 488 nm. Bars = 100 µm. C, GFP and RFP fluorescence of transgenic lines containing secGFP and HDEL-RFP in the ses1-2 background was imaged with a high-resolution laser confocal microscope at 488 and 610 nm, respectively. Bars = 20 µm. D, Analysis of total and ER-localized secGFP in wild-type and ses1-2 seedlings. Protein was extracted from 10-d-old seedlings.
Figure 9.
Figure 9.
Transcription factor bZIP17 targets the promoter of SES1. A, Expression of SES1 in wild-type (WT), bzip17, and two bZIP17ΔC overexpression lines (OE1 and OE2) with or without 200 mm NaCl treatment. Error bars indicate sd (n = 6). Statistical significance was determined by Student’s t test: ***, P < 0.001. B, GUS activity measurement in N. benthamiana leaves after transient expression of p35S::bZIP17ΔC. pSES1::GUS was used as an internal control. Error bars indicate sd (n = 6). Statistical significance was determined by Student’s t test: ***, P < 0.001. C, DNA-binding activity of bZIP17ΔC to the ERSEL element. The positions of bands is indicated with the arrow. D, Diagram of the SES1 promoter region. The gray rectangle represents the position of ERSEL (CCAATN9CCACT). P1, P2, and P3 indicate three fragments used for ChIP-PCR analysis. E, bZIP17ΔC combination with DNA fragments in the ChIP assay. The bars indicate means ± sd of three independent measurements. F, Phenotypes of bzip17, the wild type, and p35S::SES1/bzip17 (overexpression of SES1 in the bzip17 mutant) with or without 150 mm NaCl treatment. Photographs were taken after growing vertically at 22°C for 7 d. Bar = 1 cm. G, Root length of the seedlings in F. Error bars indicate sd (n = 6). Statistical significance was determined by Student’s t test. *, P < 0.05. ns indicates no significant differences (P < 0.05, Student’s t test).
Figure 10.
Figure 10.
Simplified working model of SES1 in Arabidopsis.

Similar articles

Cited by

References

    1. An R, Chen QJ, Chai MF, Lu PL, Su Z, Qin ZX, Chen J, Wang XC (2007) AtNHX8, a member of the monovalent cation:proton antiporter-1 family in Arabidopsis thaliana, encodes a putative Li/H antiporter. Plant J 49: 718–728 - PubMed
    1. Barragán V, Leidi EO, Andrés Z, Rubio L, De Luca A, Fernández JA, Cubero B, Pardo JM (2012) Ion exchangers NHX1 and NHX2 mediate active potassium uptake into vacuoles to regulate cell turgor and stomatal function in Arabidopsis. Plant Cell 24: 1127–1142 - PMC - PubMed
    1. Batoko H, Zheng HQ, Hawes C, Moore I (2000) A rab1 GTPase is required for transport between the endoplasmic reticulum and Golgi apparatus and for normal Golgi movement in plants. Plant Cell 12: 2201–2218 - PMC - PubMed
    1. Berthomieu P, Conéjéro G, Nublat A, Brackenbury WJ, Lambert C, Savio C, Uozumi N, Oiki S, Yamada K, Cellier F, et al. (2003) Functional analysis of AtHKT1 in Arabidopsis shows that Na+ recirculation by the phloem is crucial for salt tolerance. EMBO J 22: 2004–2014 - PMC - PubMed
    1. Cha JY, Jung MH, Ermawati N, Su’udi M, Rho GJ, Han CD, Lee KH, Son D (2009) Functional characterization of orchardgrass endoplasmic reticulum-resident Hsp90 (DgHsp90) as a chaperone and an ATPase. Plant Physiol Biochem 47: 859–866 - PubMed

Publication types

MeSH terms

Substances

LinkOut - more resources