. 2018 Nov 5;215(11):2887-2900.
doi: 10.1084/jem.20172021. Epub 2018 Oct 4.

SOX4 controls invariant NKT cell differentiation by tuning TCR signaling

Affiliations

SOX4 controls invariant NKT cell differentiation by tuning TCR signaling

Nidhi Malhotra et al. J Exp Med. .

Abstract

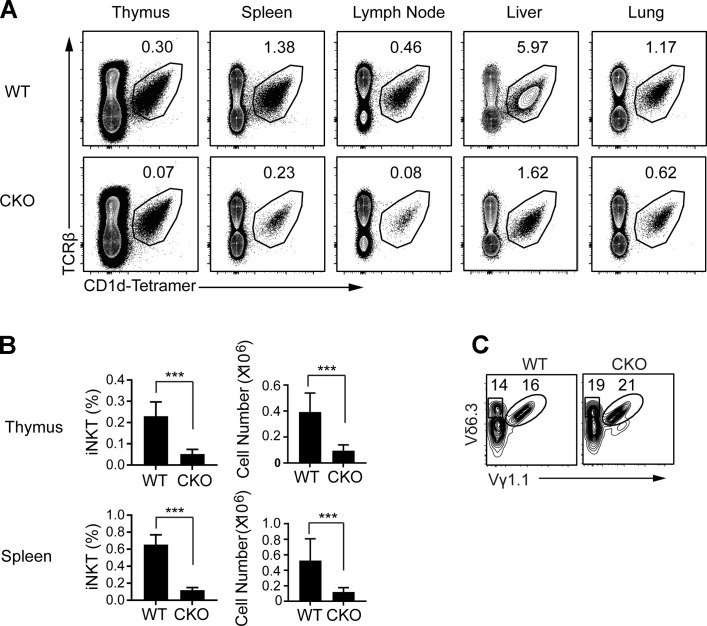
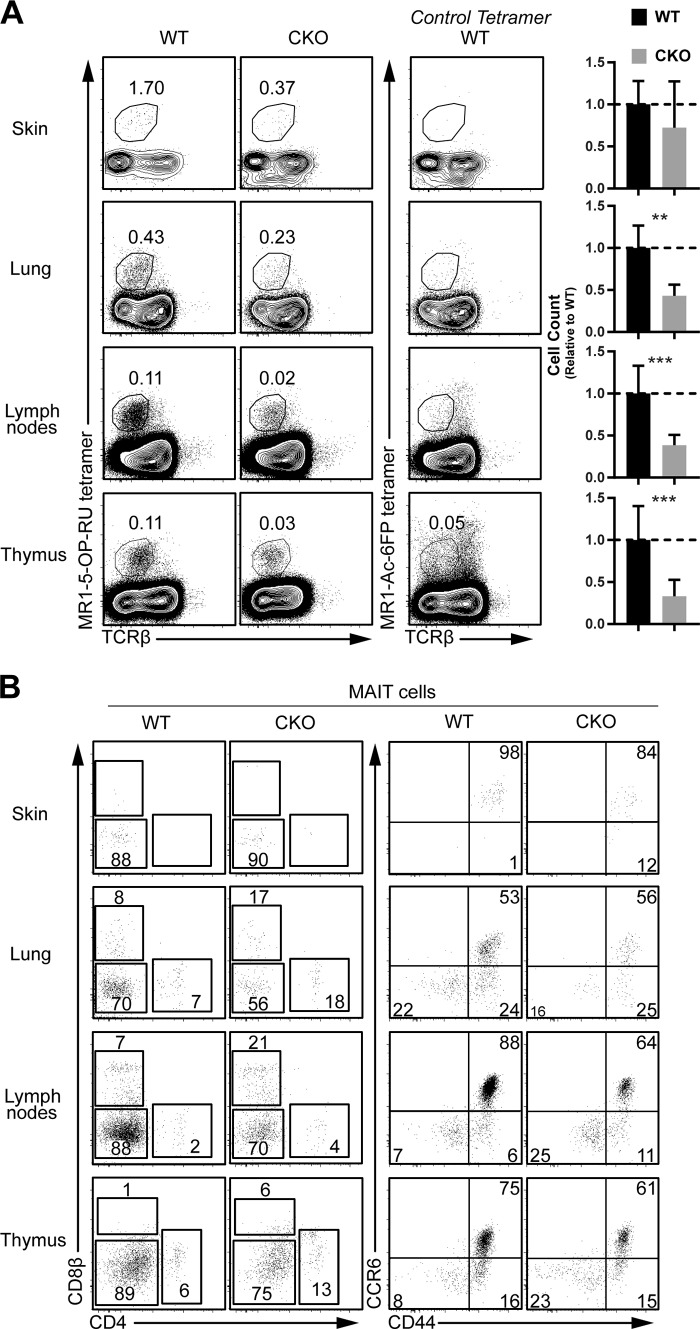
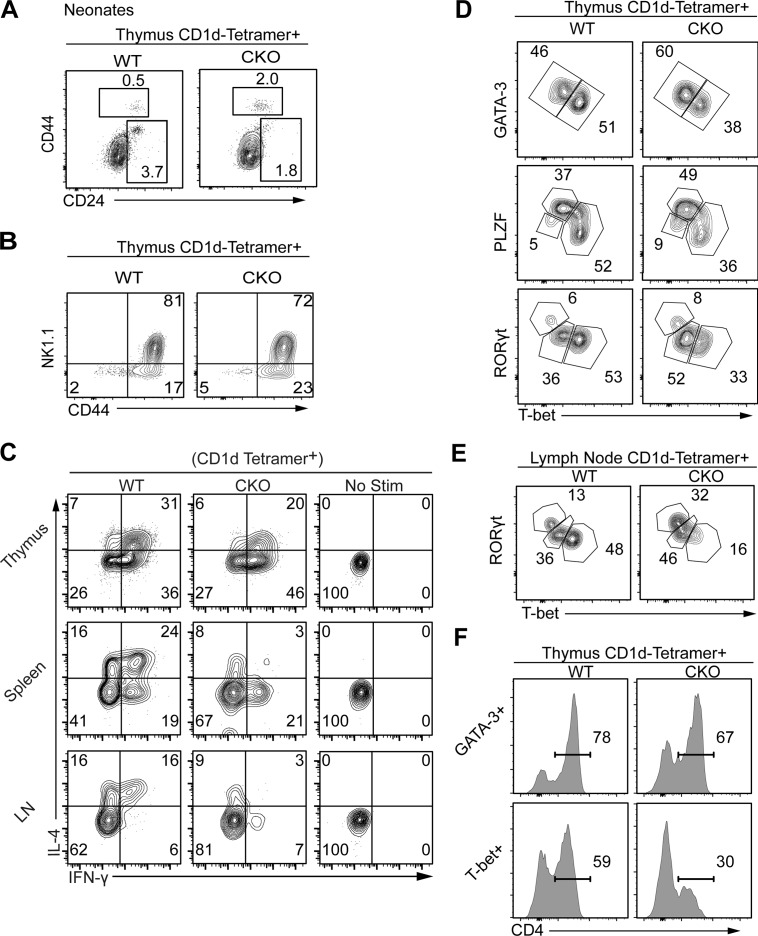
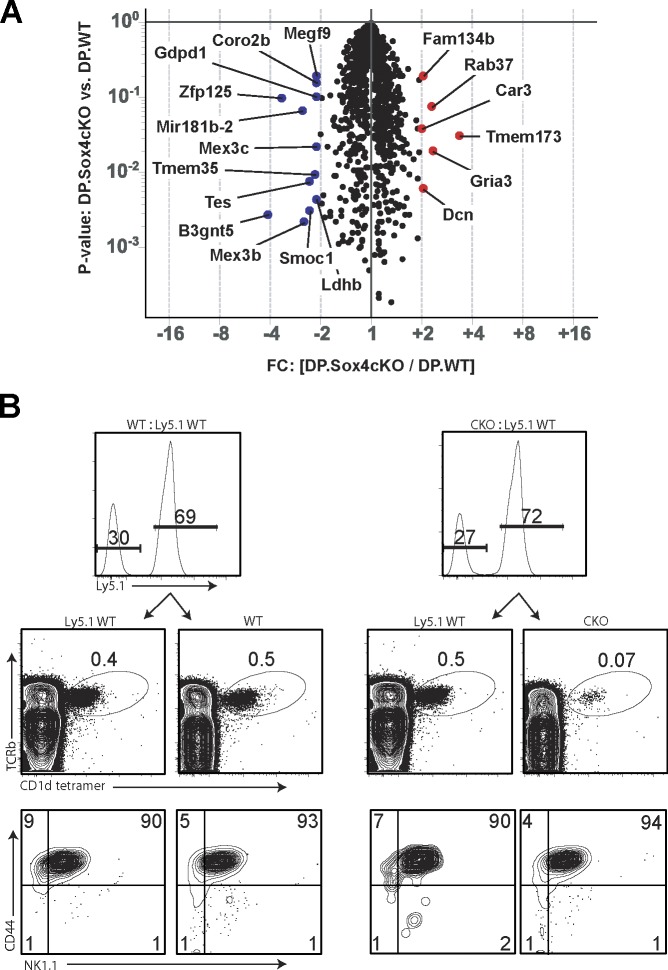
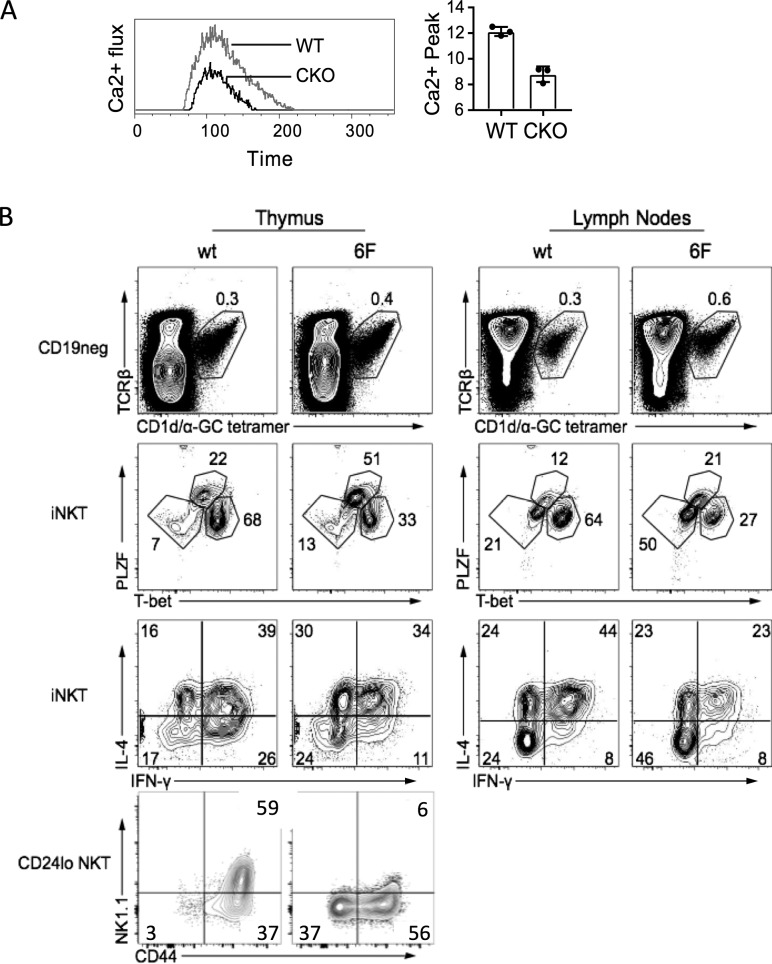
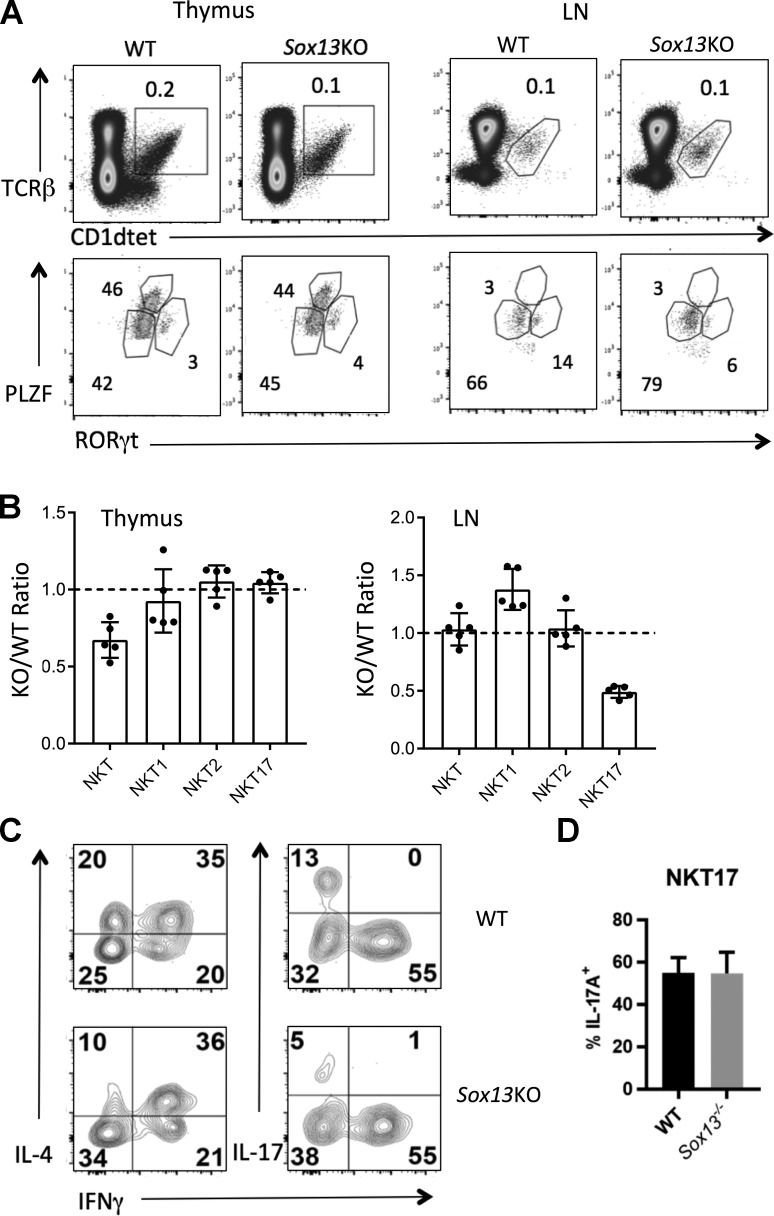
Natural killer T (NKT) cells expressing the invariant T cell receptor (iTCR) serve an essential function in clearance of certain pathogens and have been implicated in autoimmune and allergic diseases. Complex effector programs of these iNKT cells are wired in the thymus, and upon thymic egress, they can respond within hours of antigenic challenges, classifying iNKT cells as innate-like. It has been assumed that the successful rearrangement of the invariant iTCRα chain is the central event in the divergence of immature thymocytes to the NKT cell lineage, but molecular properties that render the iTCR signaling distinct to permit the T cell lineage diversification remain obscure. Here we show that the High Mobility Group (HMG) transcription factor (TF) SOX4 controls the production of iNKT cells by inducing MicroRNA-181 (Mir181) to enhance TCR signaling and Ca2+ fluxes in precursors. These results suggest the existence of tailored, permissive gene circuits in iNKT precursors for innate-like T cell development.


Figures

Figure 1.
Figure 1.
iNKT cell development is severely impaired in mice lacking Sox4 in hematopoietic cells. (A) Representative flow cytometric analyses show decreased frequencies of iNKT cells in the thymus, spleen, peripheral LNs, liver, and lung of WT (Cd2-iCre; Sox4+/+) and Cd2-iCre;Sox4fl/fl CKO mice. One of three independent experiments (minimum of three mice per genotype) is shown. (B) Summary of frequencies and cell numbers of iNKT cells in the thymus and spleen, with statistical significance denoted (***, P < 0.001, Student’s t test). Error bars denote SD. (C) γδTCR+ NKT cells (Vγ1.1+Vδ6.3+) as shown among gated γδTCR+ cells are not altered in CKO mice. Representative plots from one of two independent experiments.
Figure 2.
Figure 2.
Defective innate MAIT cell development in Sox4 CKO mice. (A) Representative flow cytometric analyses of MAIT (TCRβintermediateMR1-5-OP1RU tetramer+) cells in indicated tissues from WT and Sox4 CKO mice are shown along with the tissue iNKT cellularities (normalized to WT cell counts; **, P < 0.01; ***, P < 0.001, Student’s t test) from three independent experiments for all tissues and of five experiments for thymus and LNs. Thymic profiles are gated on CD8neg thymocytes due to relatively high background staining of the control tetramer on DP thymocytes. Overall cellularity in tissues of WT and Sox4 CKO mice was not significantly altered and differences in proportions of MAIT cells reflect differences in cell numbers. For ears, there was a high variability, with one out of three of the Sox4-deficient mice analyzed exhibiting WT phenotype, leading to the nonsignificant difference. Error bars denote SD. (B) T cell coreceptor (CD4 and CD8; left panels), activation (CD44), and CCR6 chemokine receptor expression on WT and CKO MAIT cells.
Figure 3.
Figure 3.
Remnants of iNKT cells in Sox4 CKO mice are selectively depleted of NKT1 cells. (A) Representative flow cytometric analyses show a proportional enrichment for DP (CD8α+) CD1d-tetramer+ cells in neonatal CKO mice. Note that a general trend for decreased CD24 expression in Sox4 CKO DP thymocytes obscures the CD24+ NKT0 cells. (B) iNKT maturation marker CD44 and NK1.1 were analyzed in thymic iNKT cells of WT and CKO mice. Representative profiles from five independent experiments. (C) Programmed production of IL-4 and IFNγ from remnants of Sox4 CKO iNKT cells from indicated tissues was compared with normal iNKT cells (with no stimulation profiles). Representative profiles from four independent experiments. (D and E) iNKT effector subsets identified by the expression of indicated TFs in iNKT cells show decreased production of T-bet+ NKT1 cells in remnants of Sox4 CKO iNKT cells. Frequencies of each subset were assessed in the thymus (D) and peripheral LNs (E). Representative profiles from three independent experiments. (F) Proportions of CD4 iNKT cells within thymic GATA3+ or T-bet+ iNKT cells are shown. Representative plots from three independent experiments.
Figure 4.
Figure 4.
SOX4 is a T cell–intrinsic factor required for iNKT cell development from DP thymocytes. (A) Volcano plot shows genes that are expressed at higher (red) or lower (blue) in CKO DP thymocytes relative to WT counterparts. Genes whose expression was different by at least twofold on average with indicated P values are shown (FC, fold change). Expression values were determined using microarrays of three sorted DP thymocyte replicates for each genotype. Cd1d, Cd24, and Mir181a/b were all decreased in expression, but are not denoted on the plot as they were decreased 1.7–1.9-fold on average in transcript amounts as detected using microarrays. (B) Impaired iNKT cell development from Sox4-deficient precursors cannot be rescued in trans by codifferentiating WT T cells in the thymus. Flow cytometric analysis of thymocytes from Rag1−/− mice that were reconstituted with an ∼1:1 mix of WT:WT or WT:CKO BM cells ∼8–10 wk prior. Partner WT cells were from congenic C57BL/6 (Ly5.1) mice for tracking purposes. Shown are contributions from partner precursors (top panels; range for CKO reconstitution: 38–76% relative to partner WT cells, with no correlation between the extent of defective iNKT cell generation and relative reconstitution frequencies), iNKT cell frequencies (middle), and iNKT cell maturation profiles (bottom). Representative plots from two independent experiments with a minimum of five mixed BM chimeras/group.
Figure 5.
Figure 5.
Evidence for impaired TCR signaling in Sox4-deficient thymocytes. (A) Impaired Ca2+ signaling in thymocytes lacking SOX4. Left, kinetic analysis of Ca2+ flux (ratios of Fluo 3:Fura red) in DP thymocytes from WT and Sox4 CKO mice after stimulation with CD3ε cross-linking. Representative plots from four independent experiments. Right, averages of peak flux (n = 4/genotype). Error bars denote SD. (B) Thymocytes from Cd2476F/6F (6F) mice with compromised TCR-signaling capacity also show impaired NKT1 cell generation and function. Shown from top to bottom panels are iNKT cell frequencies, iNKT cell subset distributions, effector cytokine production, and iNKT cell maturation profiles in the thymus and LNs of WT and Cd2476F/6F mice. Representative plots from three independent experiments using mice of age ranging from 4 to 6 wk old (thymus) or 8 to 12 wk old (LN).
Figure 6.
Figure 6.
SOX4 regulates Mir181 expression in thymocytes. (A) Mir181a-1 and Mir181b-1 transcripts in DP thymocytes of WT and CKO mice were quantified by real-time PCR. One of three experiments is shown. (B) ChIP analysis for SOX4 docking and epigenetic modifications at the Mir181 locus of DP thymocytes. Each graph shows control Ab (matching the species of origin of experimental Ab) for the protein–chromatin complex precipitation followed by the chromatin states probed with Abs to indicated markers in sorted WT and Sox4 CKO DP thymocytes. The consensus DNA binding motif for SOX4 is located ∼2.3 kb upstream of the transcription start site of Mir181a-1 and denoted on the schematic (right; not to scale), which also shows the region assessed by quantitative PCR (arrows). Active (K4me3), poised (K9me3), and suppressed (K27me3) histone modifications in the region are shown. Statistical significance based on Student’s t test denoted. (C and D) iNKT cell development from Sox4-deficient precursors can be rescued by enforced Mir181a-1 expression. (C) Representative profiles of the rescued iNKT cell development among mature (CD24neg) thymocytes showing frequencies of iNKT cells from the Mir181a-1 retrovirus transduced (GFP+) and nontransduced (GFP) precursors in the same mouse. Transduction studies using WT and CKO BM cells are shown. Representative plots from one of two independent experiments. (D) Summary of thymic iNKT cell frequencies from retroviral reconstitution experiments using infected WT (blank circles) and CKO (filled circles) BM cells. Only mice with >1% GFP+ cells among mature thymocytes were included in the calculation. Denoted significance in graphs was based on Student’s t test. Error bars denote SD.
Figure 7.
Figure 7.
SOX13 regulates NKT17 cell development. (A) Representative profiles showing the reduction of thymic iNKT cells and LN RORγt+ NKT17 cells in Sox13−/− (KO, ∼3–4 wk old, 129/J background) and aged-matched 129/J WT mice. One of two experiments. (B) Summary of the frequencies of total iNKT cells and NKT cell subsets defined by TFs in the thymus and LN of KO relative to WT mice. Each dot represents an individual mouse. Total tissue cellularity of KO and WT mice was indistinguishable. Data are combined from two independent experiments. (C) Representative profiles of effector cytokine (IL-4, IL-17A, and IFNγ) production by LN iNKT cells from WT and KO mice as measured by intracellular staining. One of two experiments with a minimum of n = 3/genotype is shown. (D) Thymic iNKT cells were stimulated with PMA and Ionomycin for simultaneous analysis of TFs and cytokine production. NKT17 cells were gated as live, B220/CD19, TCRβ+, mCD1d-PBS57+, and RORγt+T-bet. Data are summarized from two independent assays. Error bars denote SD.

References

    1. Arase H., Ono S., Arase N., Park S.Y., Wakizaka K., Watanabe H., Ohno H., and Saito T.. 1995. Developmental arrest of NK1.1+ T cell antigen receptor (TCR)-alpha/beta+ T cells and expansion of NK1.1+ TCR-gamma/delta+ T cell development in CD3 zeta-deficient mice. J. Exp. Med. 182:891–895. 10.1084/jem.182.3.891 - DOI - PMC - PubMed
    1. Askew D., and Harding C.V.. 2008. Antigen processing and CD24 expression determine antigen presentation by splenic CD4+ and CD8+ dendritic cells. Immunology. 123:447–455. 10.1111/j.1365-2567.2007.02711.x - DOI - PMC - PubMed
    1. Azzam H.S., Grinberg A., Lui K., Shen H., Shores E.W., and Love P.E.. 1998. CD5 expression is developmentally regulated by T cell receptor (TCR) signals and TCR avidity. J. Exp. Med. 188:2301–2311. 10.1084/jem.188.12.2301 - DOI - PMC - PubMed
    1. Carnaud C., Lee D., Donnars O., Park S.-H., Beavis A., Koezuka Y., and Bendelac A.. 1999. Cutting edge: Cross-talk between cells of the innate immune system: NKT cells rapidly activate NK cells. J. Immunol. 163:4647–4650. - PubMed
    1. Carr T., Krishnamoorthy V., Yu S., Xue H.H., Kee B.L., and Verykokakis M.. 2015. The transcription factor lymphoid enhancer factor 1 controls invariant natural killer T cell expansion and Th2-type effector differentiation. J. Exp. Med. 212:793–807. 10.1084/jem.20141849 - DOI - PMC - PubMed

Publication types

MeSH terms

LinkOut - more resources