. 2018 Oct 23;115(43):E10099-E10108.
doi: 10.1073/pnas.1814552115. Epub 2018 Oct 4.

Noncanonical autophagy at ER exit sites regulates procollagen turnover

Affiliations

Noncanonical autophagy at ER exit sites regulates procollagen turnover

Shakib Omari et al. Proc Natl Acad Sci U S A. .

Abstract

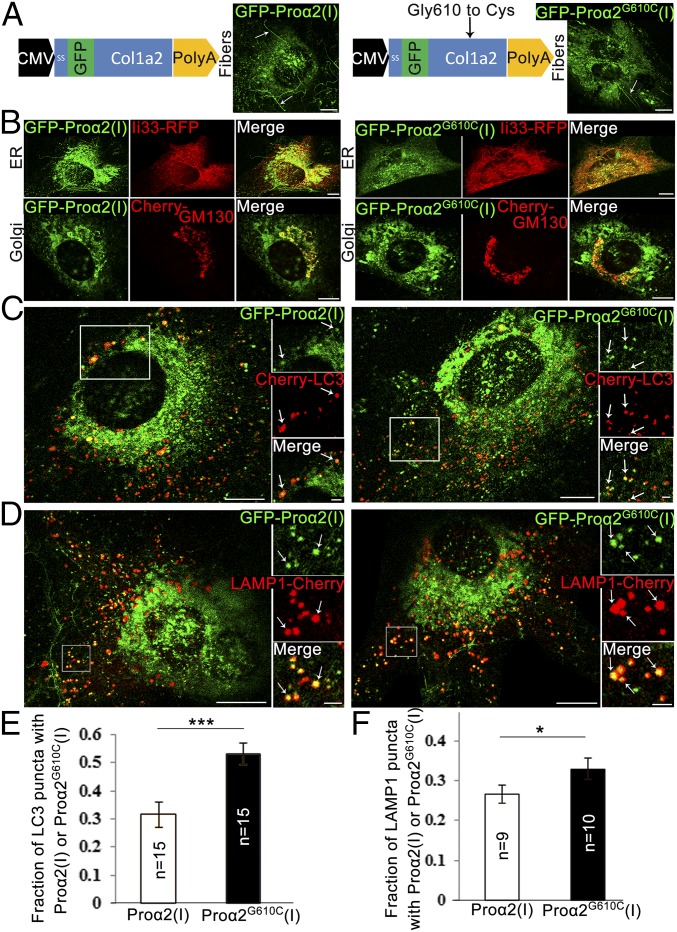
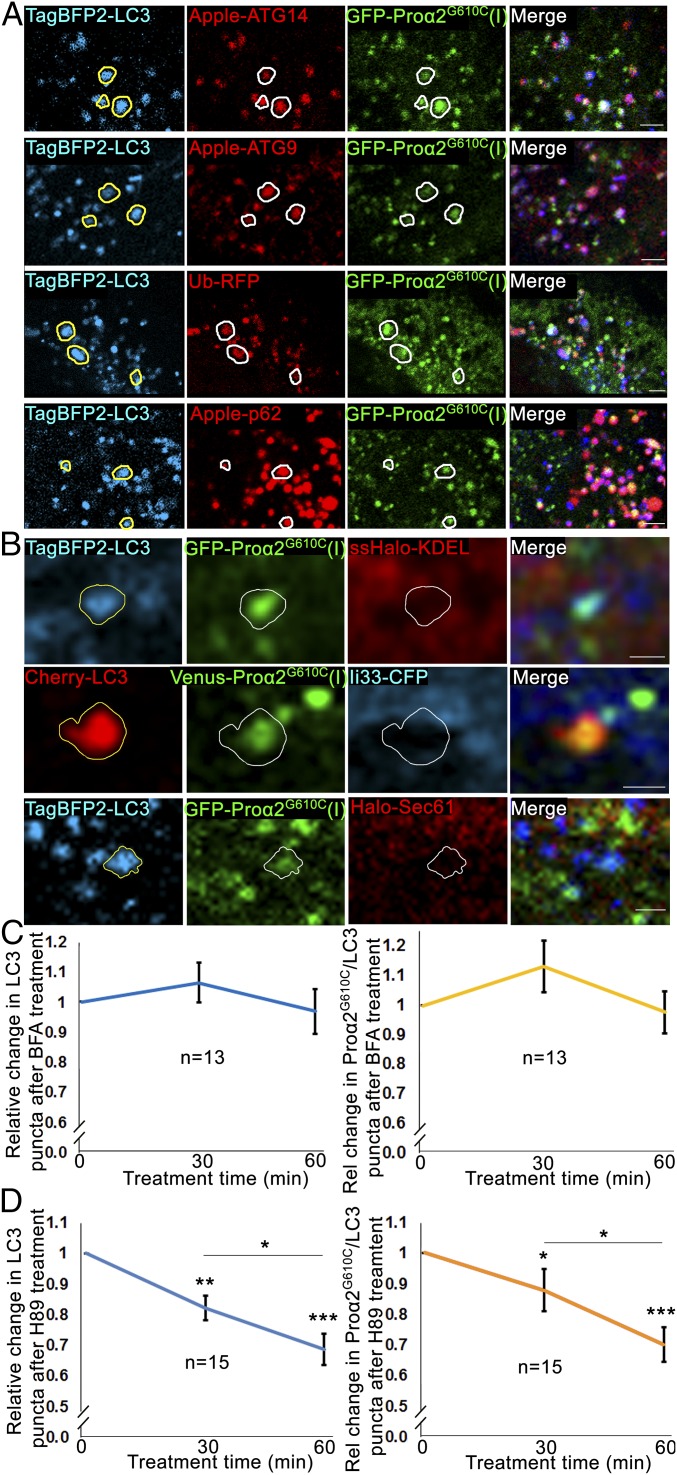
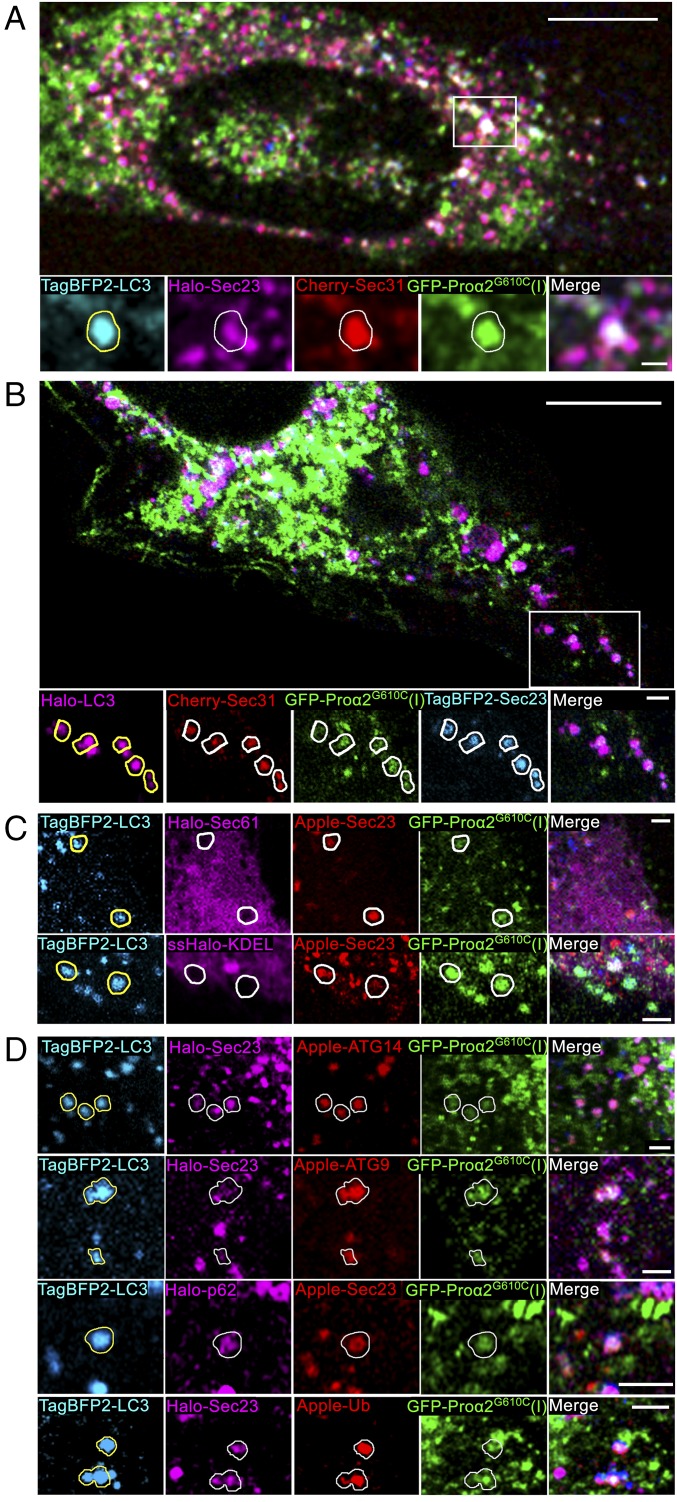
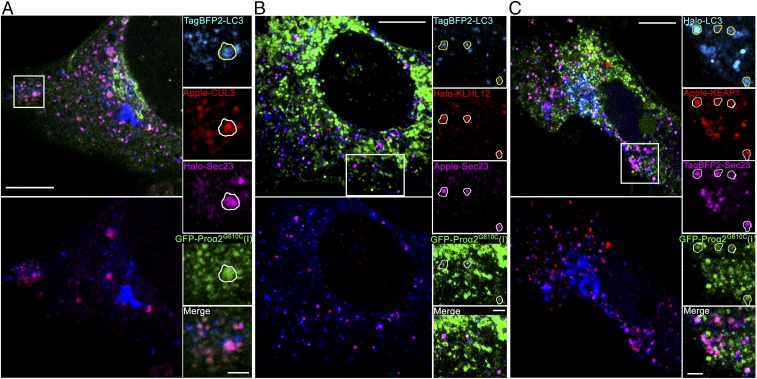
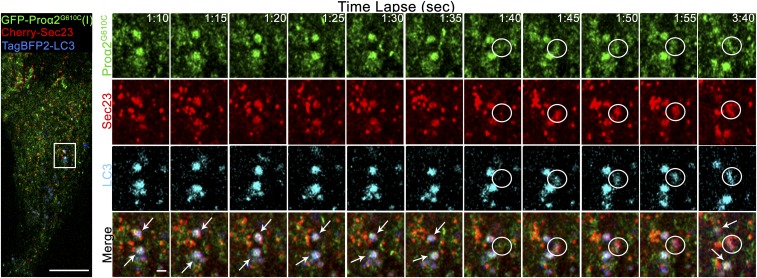
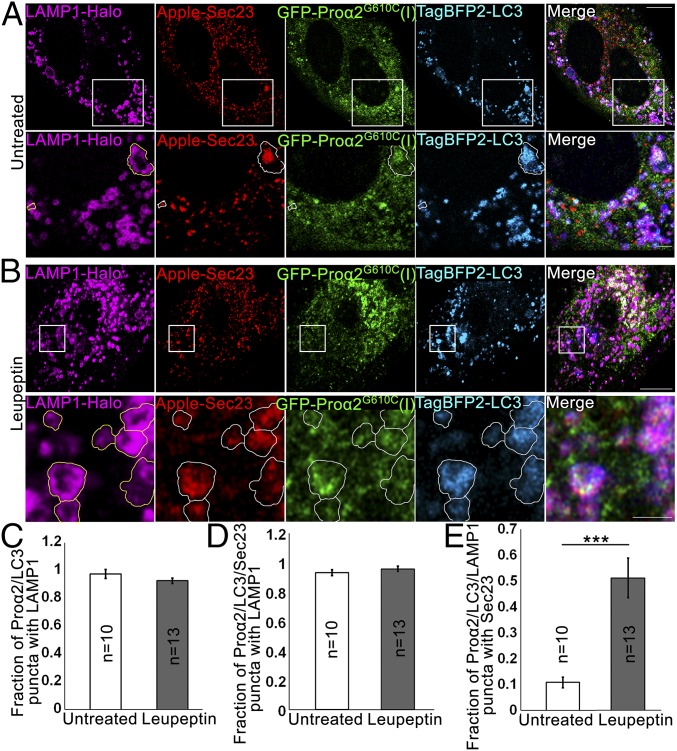
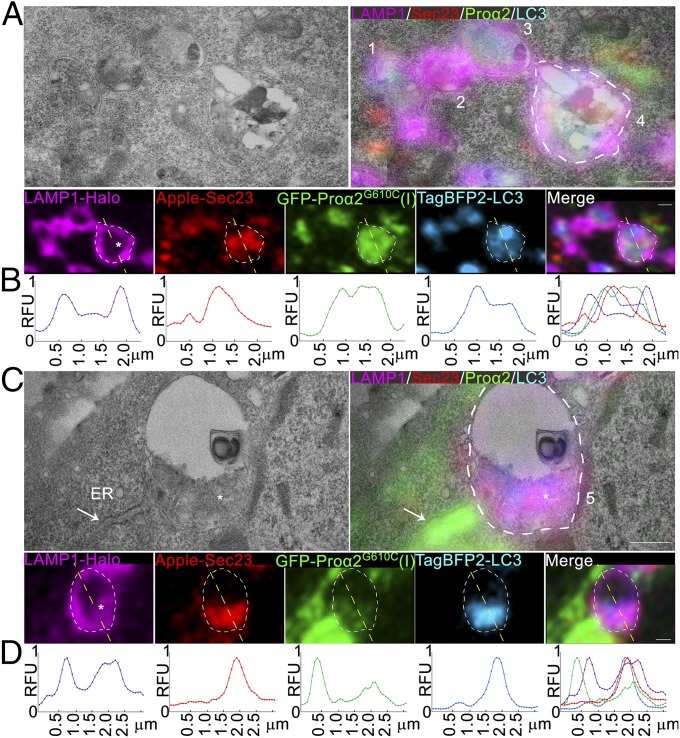
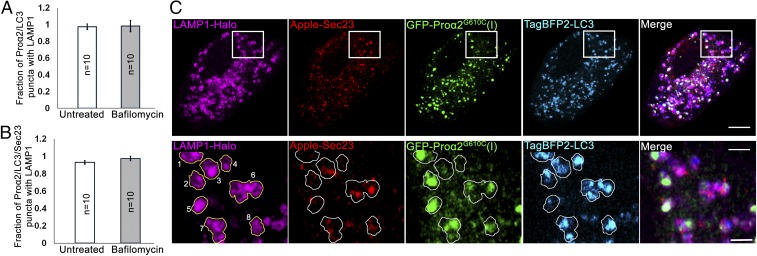
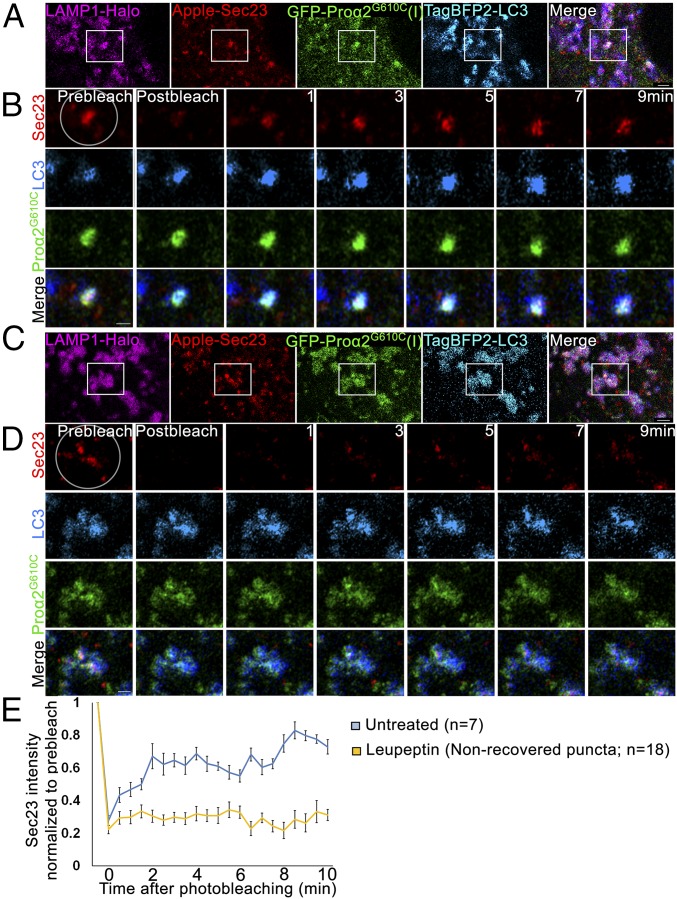
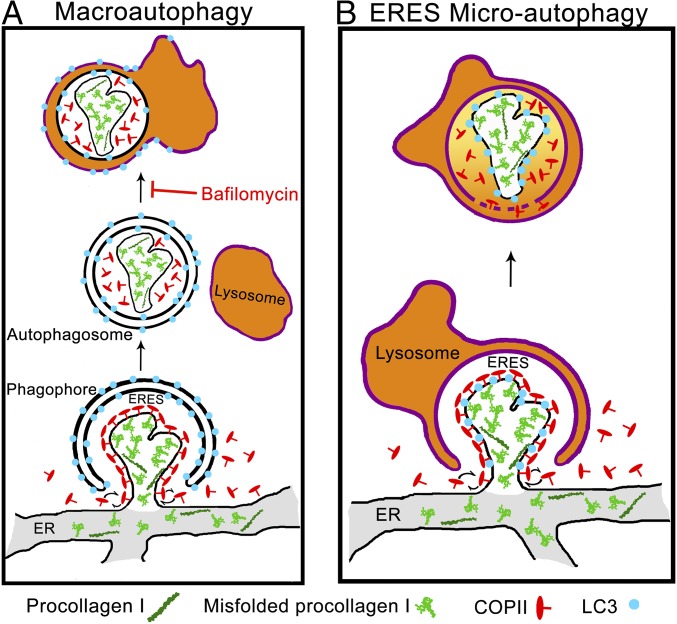
Type I collagen is the main component of bone matrix and other connective tissues. Rerouting of its procollagen precursor to a degradative pathway is crucial for osteoblast survival in pathologies involving excessive intracellular buildup of procollagen that is improperly folded and/or trafficked. What cellular mechanisms underlie this rerouting remains unclear. To study these mechanisms, we employed live-cell imaging and correlative light and electron microscopy (CLEM) to examine procollagen trafficking both in wild-type mouse osteoblasts and osteoblasts expressing a bone pathology-causing mutant procollagen. We found that although most procollagen molecules successfully trafficked through the secretory pathway in these cells, a subpopulation did not. The latter molecules appeared in numerous dispersed puncta colocalizing with COPII subunits, autophagy markers and ubiquitin machinery, with more puncta seen in mutant procollagen-expressing cells. Blocking endoplasmic reticulum exit site (ERES) formation suppressed the number of these puncta, suggesting they formed after procollagen entry into ERESs. The punctate structures containing procollagen, COPII, and autophagic markers did not move toward the Golgi but instead were relatively immobile. They appeared to be quickly engulfed by nearby lysosomes through a bafilomycin-insensitive pathway. CLEM and fluorescence recovery after photobleaching experiments suggested engulfment occurred through a noncanonical form of autophagy resembling microautophagy of ERESs. Overall, our findings reveal that a subset of procollagen molecules is directed toward lysosomal degradation through an autophagic pathway originating at ERESs, providing a mechanism to remove excess procollagen from cells.

Keywords: ERES; autophagy; lysosome; microautophagy; procollagen.


Conflict of interest statement

The authors declare no conflict of interest.

Figures

Fig. 1.
Fig. 1.
GFP-proα2(I)–tagged procollagen progresses through secretory and autophagic degradation pathways. (A) Schematic representation of GFP-proα2(I) (Left) and GFP-proα2G610C(I) (Right) constructs. Images show integration of procollagen molecules containing these chains into extracellular fibers (arrows) produced by transfected MC3T3 cells. (B) MC3T3 cells transfected with GFP-proα2(I) (Left) and GFP-proα2G610C(I) (Right) as well as markers of ER (Ii33-RFP) and cis-Golgi (Cherry-GM130) to visualize progression through the secretory pathway. (C and D) MC3T3 cells transfected with GFP-proα2(I) (Left) and GFP-proα2G610C(I) (Right) chains as well as markers of autophagic membrane (Cherry-LC3 in C) or lysosomal membrane (LAMP1-Cherry in D). Arrows point to selected puncta containing procollagen and LC3 or LAMP1. (E and F) Fractions of LC3 puncta (E) and LAMP1 puncta (F) containing procollagen (calculated as shown in SI Appendix, Fig. S6). Graphs display mean values ± SEM; *P < 0.05, ***P < 0.001. All images in AD are confocal single slices. [Scale bars: 10 µm (whole cell) and 2 µm (zoom).] Procollagen colocalization with LC3 or LAMP1 near dense ER regions (C) was less obvious than in distal regions (D). We therefore used a conservative counting algorithm, which always undercounted rather than overcounted colocalized puncta (SI Appendix, Fig. S6).
Fig. 2.
Fig. 2.
Procollagen autophagy is initiated at early steps in the secretory pathway. (A) Confocal single-slice images of colocalized puncta in MC3T3 cells transfected with GFP-proα2G610C(I), TagBFP2-LC3 as well as autophagy markers Apple-ATG14, Apple-ATG9, ubiquitin-RFP (Ub-RFP), or Apple-p62. (Scale bars: 2 µm.) (B) Autophagic structures containing FP-proα2G610C(I) and FP-LC3 imaged in MC3T3 cells also transfected with a marker of ER lumen (ssHalo-KDEL) or ER membrane (Ii33-CFP or ssHalo-Sec61). Top two rows are confocal single-slice images; the Bottom row is Airyscan single-slice images. (Scale bars: 1 µm.) In A and B, yellow outlines of LC3-positive puncta are projected in white onto the other channels; all individual blue channels are displayed in cyan for better visualization. (C and D) MC3T3 cells transfected with GFP-proα2G610C(I) and TagBFP2-LC3 were imaged before and after 60-min treatment with 5 µg/mL BFA or 50 µM H89. Averaged relative changes in the number of total LC3 puncta and procollagen/LC3 puncta during the BFA (C) or H89 (D) treatment are shown. Sample images are displayed in SI Appendix, Fig. S4. The SE was calculated using repeated-measures ANOVA for the raw data; *P < 0.05, **P < 0.01, ***P < 0.001.
Fig. 3.
Fig. 3.
Misfolded procollagen enters autophagic structures at ERES. (A) Procollagen autophagic structures marked with GFP-proα2G610C(I) and TagBFP2-LC3 were imaged in MC3T3 cells also transfected with FP-tagged components of COPII coat Cherry-Sec31 and Halo-Sec23. Outline of an LC3-positive punctum is projected onto the other channels in zoomed confocal single-slice images to visualize colocalization. Colocalization was confirmed by analysis of the full 3D z-stack (SI Appendix, Fig. S4). (B) Similar imaging of TagBFP2-Sec23 and Cherry-Sec31 colocalization with procollagen autophagic structures positive for GFP-proα2G610C(I) and Halo-LC3. LC3 puncta outlines show only the structures in which the colocalization was confirmed by 3D z-stack analysis (SI Appendix, Fig. S4). The number of FP-Sec23/FP-proα2(I)G610C/FP-LC3 colocalized puncta represented 9.8 ± 1.4% of total LC3 puncta (n = 21 cells) and 4.7 ± 0.7% of total Sec23 puncta (n = 20 cells). (C) None of the puncta marked with GFP-proα2(I)G610C, TagBFP2-LC3, and FP-Sec23 (arrows) contained either Halo-Sec61 (ER membrane) or ssHalo-KDEL (ER lumen) markers. (D) Puncta marked with FP-Sec23, GFP-proα2G610C(I), and TagBFP2-LC3 also contained autophagic markers Apple-ATG14, Apple-ATG9, Halo-p62, or Apple-Ub. Images of C, Bottom are Airyscan single slices; all other images are confocal single slices. In all images, individual blue channels are displayed in cyan for better visualization. [Scale bars: 10 µm (whole cell) and 2 µm (zoom).]
Fig. 4.
Fig. 4.
Procollagen/Sec23/LC3 puncta colocalize with ubiquitination machinery. (A) Airyscan slice showing TagBFP2-LC3 and GFP-proα2(I)G610C puncta colocalization with Halo-Sec23 and Apple-CUL3, an E3 ubiquitin ligase. All large FP-CUL3 puncta were confirmed to be colocalized with FP-LC3 (Bottom Left image of the whole cell) and procollagen (zoomed panels, Right), and some also contained FP-Sec23 (zoomed panels, outline). (B) Airyscan slice showing colocalization of TagBFP2-LC3 puncta with Halo-KLHL12 adaptor for CUL3 ubiquitin ligase (Bottom Left) and with GFP-proα2G610C(I) and Apple-Sec23 (zoomed panels, outlines). All Halo-KLHL12 puncta colocalized with GFP-proα2G610C(I) were confirmed to be also colocalized with TagBFP2-LC3 (top images of the whole cell). (C) Airyscan slice showing colocalization of Halo-LC3 puncta with Apple-Keap1 adaptor for CUL3 ubiquitin ligase (Bottom Left) and with GFP-proα2G610C(I) and TagBFP2-Sec23 (zoomed panels, outlines). In all zoomed panels, yellow outlines of LC3-positive puncta are projected in white onto other channels. Individual blue channels are displayed in cyan. [Scale bars: 10 µm (whole cell) and 2 µm (zoom).]
Fig. 5.
Fig. 5.
Procollagen/LC3 structures rapidly form at COPII puncta, retain COPII coat, and remain relatively stationary. MC3T3 cells transfected with Cherry-Sec23, GFP-proα2G610C(I), and TagBFP2-LC3 (Left) were imaged by Airyscan (5 s) time-lapse microscopy (Movie S4). Single-slice, time-lapse images (Right) show preexisting long-lived proα2G610C(I)/LC3/Sec23-positive autophagic structures (white arrows) and formation of a new proα2G610C(I), LC3, and Sec23-positive autophagic structure (white circle). Blue channels are displayed in cyan for better visualization. [Scale bars: 10 µm (whole cell) and 1 µm (zoom).]
Fig. 6.
Fig. 6.
Autophagic structures at ERESs are engulfed by lysosomal membranes. (A and B) COPII-positive procollagen autophagic structures marked with GFP-proα2G610C(I), TagBFP2-LC3, and Apple-Sec23 were imaged by Airyscan microscopy in MC3T3 cells without (A) and with (B) 6 h 100 µM leupeptin treatment. The cells were also transfected with a lysosomal membrane marker, LAMP1-Halo. In zoomed panels, yellow outlines of LAMP1-positive puncta are projected in white onto other channels. (A, Bottom) Outlines show proα2G610C(I), LC3, and Sec23 surrounded by LAMP1-positive membranes; the large structure appears to be only partially surrounded. (B, Bottom) Outlines show multiple proα2/LC3/LAMP1 puncta that also contain Sec23. All images are single Airyscan slices; blue channels are displayed in cyan. [Scale bars: 10 µm (whole cell) and 2 µm (zoom).] (CE) Effect of 6-h leupeptin treatment on procollagen autophagic structures. Bar charts display mean values ± SEM; ***P < 0.001. (C and D) Fraction of proα2/LC3 (C) and proα2/LC3/Sec23 (D) puncta that are also positive for LAMP1. (E) Fraction of proα2/LC3/LAMP1 puncta that are also positive for Sec23.
Fig. 7.
Fig. 7.
Ultrastructure of ERESs engulfed by lysosomes. (A and C) Correlative single-slice Airyscan and transmission electron microscopy images of MC3T3 cells transfected with GFP-proα2G610C(I), TagBFP2-LC3, Apple-Sec23, and LAMP1-Halo and treated with 100 µM leupeptin for 6 h to prevent Sec23 degradation. Autophagic procollagen ERES that appears to be only partially engulfed by lysosomal membrane is labeled 1. Lysosomes with internalized procollagen, LC3, and Sec23 are labeled 2 and 3. Lysosomes with internalized degradation products, procollagen, LC3, Sec23, and LAMP1 membranes are labeled 4 and 5. The asterisk in lysosome 5 (C) marks an apparent large clump of internalized lysosomal membranes. The arrow marks rough ER filled with procollagen, which is adjacent to lysosome 5. White outlines of lysosomes 4 and 5 are projected onto the fluorescent channels. Individual blue channels are displayed in cyan. (Scale bars: 0.5 µm.) (B and D) Line plots of relative fluorescence intensities (RFU) along the yellow dashed lines (top to bottom) shown in the corresponding fluorescence channels (A and C) above the plots.
Fig. 8.
Fig. 8.
Bafilomycin A1 does not affect the fraction of procollagen autophagic structures engulfed by lysosomal membranes. MC3T3 cells were transfected with GFP-proα2G610C(I), TagBFP2-LC3, Apple-Sec23, and LAMP1-Halo, treated with 100 nM bafilomycin A1 for 4 h to prevent autophagosome-lysosome fusion, and then imaged. (A and B) Quantified fractions of proα2G610C(I)/LC3 (A) and proα2G610C(I)/LC3/Sec23 (B) puncta that are also positive for LAMP1 in bafilomycin A1-treated and untreated cells. Bar charts display mean values ± SEM. (C) Single-slice Airyscan images illustrating no accumulation of proα2G610C(I)/LC3-positive puncta that are LAMP1-negative after bafilomycin A1 treatment. Yellow outlines of LAMP1 puncta projected onto other channels in zoomed images (Bottom) show lysosomes with procollagen and LC3, some of which (3 and 6–8) contain Sec23 and some (1, 2, 4, and 5) have little or no Sec23. Individual blue channels are displayed in cyan. [Scale bars: 10 µm (whole cell) and 2 µm (zoom).]
Fig. 9.
Fig. 9.
Sec23 dynamics in procollagen autophagic ERESs engulfed by lysosomal membranes. (A and C) Single-slice confocal images of GFP-proα2G610C(I), TagBFP2-LC3, Apple-Sec23, and LAMP1-Halo–positive puncta in untreated MC3T3 cells (A) and after 6-h 100 µM leupeptin treatment (C). Individual blue channels are displayed in cyan. (Scale bars: 2 µm.) (B and D) High-magnification, single-slice Airyscan microscopy images of the boxed regions before and 0, 1, 3, 5, 7, and 9 min after Apple-Sec23 photobleaching within the circled area (selected from full 30-s-per-image time-lapse sets shown in Movie S5). Individual blue channels are displayed in cyan. (Scale bars: 1 µm.) (E) Average kinetics of Apple-Sec23 fluorescence recovery in untreated cells and in cells pretreated for 6 h with 100 µM leupeptin. In the treated cells, the kinetics are shown only for the puncta that exhibited no fluorescence recovery (∼65% of all puncta); average kinetics of fluorescence recovery in the other 35% of the puncta is shown in SI Appendix, Fig. S8. Graph displays mean intensity relative to the prebleach value ± SEM.
Fig. 10.
Fig. 10.
Noncanonical ERES microautophagy model of procollagen degradation. Schematics of macroautophagy (A) and microautophagy (B) pathways of ERES degradation. In macroautophagy, the cargo is first internalized inside a double-membrane autophagosome followed by autophagosome-lysosome fusion. In microautophagy, the cargo is directly engulfed by a lysosome. Misfolded procollagen aggregates appear to enter ERESs on their own or together with normally folded molecules, preventing formation of Golgi-bound carrier vesicles and activating autophagy machinery (perhaps because of their size/structure). These ERESs are then degraded by microautophagy, as suggested by the following observations. (i) Airyscan and CLEM microscopy show LC3 membranes intermixing with (expected in microautophagy) rather than encapsulating (expected in macroautophagy) Sec23 and procollagen. (ii) CLEM shows LC3 inside but not on the LAMP1-positive lysosome surface, as expected after lysosomal engulfment but not autophagosome–lysosome fusion. (iii) CLEM also shows encapsulation of LAMP1-positive membranes together with autophagic ERES inside the lysosome, as expected after lysosomal engulfment but not autophagosome–lysosome fusion. (iv) No effect of bafilomycin A1 on lysosomal internalization of autophagic ERESs containing procollagen is consistent with micro- but not macroautophagy. (v) Sec23 photobleaching experiments show rapid exchange of Sec23 between cytoplasm and LAMP1-positive autophagic ERESs, which is possible at ERESs partially engulfed by lysosomes in microautophagy but not after autophagosome–lysosome fusion.

Similar articles

Cited by

References

    1. Ishikawa Y, Bächinger HP. A molecular ensemble in the rER for procollagen maturation. Biochim Biophys Acta. 2013;1833:2479–2491. - PubMed
    1. Makareeva E, Aviles NA, Leikin S. Chaperoning osteogenesis: New protein-folding disease paradigms. Trends Cell Biol. 2011;21:168–176. - PMC - PubMed
    1. Bienkowski RS, Gotkin MG. Control of collagen deposition in mammalian lung. Proc Soc Exp Biol Med. 1995;209:118–140. - PubMed
    1. Mirigian LS, et al. Osteoblast malfunction caused by cell stress response to procollagen misfolding in α2(I)-G610C mouse model of osteogenesis imperfecta. J Bone Miner Res. 2016;31:1608–1616. - PMC - PubMed
    1. Shapiro JR, Byers PH, Glorieux FH, Sponseller PD, eds (2014) Osteogenesis Imperfecta (Elsevier, Amsterdam), pp 555.

Publication types

LinkOut - more resources