. 2018 Nov 23;293(47):18270-18284.
doi: 10.1074/jbc.RA118.002121. Epub 2018 Oct 4.

ER stress signaling has an activating transcription factor 6α (ATF6)-dependent "off-switch"

Affiliations

ER stress signaling has an activating transcription factor 6α (ATF6)-dependent "off-switch"

Franziska Walter et al. J Biol Chem. .

Abstract

In response to an accumulation of unfolded proteins in the endoplasmic reticulum (ER) lumen, three ER transmembrane signaling proteins, inositol-requiring enzyme 1 (IRE1), PRKR-like ER kinase (PERK), and activating transcription factor 6α (ATF6α), are activated. These proteins initiate a signaling and transcriptional network termed the unfolded protein response (UPR), which re-establishes cellular proteostasis. When this restoration fails, however, cells undergo apoptosis. To investigate cross-talk between these different UPR enzymes, here we developed a high-content live cell screening platform to image fluorescent UPR-reporter cell lines derived from human SH-SY5Y neuroblastoma cells in which different ER stress signaling proteins were silenced through lentivirus-delivered shRNA constructs. We observed that loss of ATF6 expression results in uncontrolled IRE1-reporter activity and increases X box-binding protein 1 (XBP1) splicing. Transient increases in both IRE1 mRNA and IRE1 protein levels were observed in response to ER stress, suggesting that IRE1 up-regulation is a general feature of ER stress signaling and was further increased in cells lacking ATF6 expression. Moreover, overexpression of the transcriptionally active N-terminal domain of ATF6 reversed the increases in IRE1 levels. Furthermore, inhibition of IRE1 kinase activity or of downstream JNK activity prevented an increase in IRE1 levels during ER stress, suggesting that IRE1 transcription is regulated through a positive feed-forward loop. Collectively, our results indicate that from the moment of activation, IRE1 signaling during ER stress has an ATF6-dependent "off-switch."

Keywords: APY29; ATF6; GRP78; IRE1; UPR reporters; X-box binding protein 1 (XBP1); c-Jun N-terminal kinase (JNK); cell death; endoplasmic reticulum stress (ER stress); fluorescent reporter; high content imaging; imaging; lentivirus; protein misfolding; stress response; unfolded protein response (UPR).


Conflict of interest statement

The authors declare that they have no conflicts of interest with the contents of this article

Figures

Figure 1.
Figure 1.
Silencing ATF6 expression. SH-SY5Y cells were transduced with vectors encoding shRNA against ATF6 or scrambled control (scram). A, ATF6 protein levels were analyzed by Western blotting using ATF6 antibody. Actin served as loading control. B, real-time qPCR analysis of ATF6 mRNA in SH-SY5Y cells transduced with vectors encoding shRNA against ATF6 or control and treated with 3 μm Tm or DMSO for 24 h. Results were normalized to β-actin levels and expressed relative to DMSO-treated scram control cells (mean of n = 3, error bars indicate S.E. Student's t tests were performed to compare Tm-treated and control group (* indicates p < 0.05) or ATF6-KD and scram control cells (# indicates p < 0.05). C, YFP mean fluorescence intensity over time in ATF6-reporter cells transduced with ATF6-KD or scram control construct, treated with Tg or 0.1% DMSO, respectively. ATF6-reporter cells were transduced with shRNA against ATF6 or scrambled control vector. 96 h after transduction, cells were stained with Hoechst and PI. Images were taken at 1-h intervals starting immediately after treatment for 48 h using high-content time-lapse live cell imaging. Error bars indicate S.E. of all cells per time point and treatment. Data shown are representative of two experiments. D, YFP mean fluorescence intensity 30 h after treatment with 1 μm Tg or 0.1% DMSO. Error bars indicate S.E. of n = 3 wells ATF6-KD or n = 2 wells scram. Student's t tests were performed comparing KD and scrambled groups. * indicates p < 0.05. a.u., arbitrary units.
Figure 2.
Figure 2.
Employing high-content live cell imaging to interrogate cross-talk between the UPR-signaling branches. IRE1-, PERK-, or ATF6-reporter cells were transduced with shRNA against ATF6, IRE1, PERK, or scrambled control vector. 96 h after transduction, the cells were stained with Hoechst and PI and treated with 1 μm Tg. Images were taken at 1-h intervals starting immediately after treatment for 48 h using high-content time-lapse live cell imaging. Left column: A, D, G, J, M, and P, schematic indicating reporter cell line and silencing construct used. Middle column: B and E, percentage of YFP-positive cells, or H, K, N, and R, mean YFP intensity over time in response to 1 μm Tg or 0.1% DMSO in reporter cells transduced with silencing construct or scrambled control group was plotted. Error bars indicate S.E. of at least n = 2 wells of a representative experiment. Right column: C and F, mean percentage of YFP-positive cells, or I, L, O, and Q, mean YFP intensity 24 h after treatment with 1 μm Tg or 0.1% DMSO control. Error bars indicate S.E. of n = 3 independent experiments. Student's t tests were performed comparing KD and scrambled groups. * indicates p < 0.05. a.u., arbitrary units.
Figure 3.
Figure 3.
ATF6 silencing results in increased XBP1 splicing but does not affect cell death. IRE1-reporter cells were transduced with shRNA against ATF6 or scrambled control vector. 96 h after transduction, the cells were stained with Hoechst and PI and treated with different concentrations of Tm, Tg, or BFA. Images were taken at 1-h intervals starting immediately after treatment for 48 h using high-content time-lapse live cell imaging. A, percentage of YFP-positive cells over time in response to 0.3 μm Tm or 0.1% DMSO in ATF6-KD and scrambled control group was plotted. Error bars indicate S.E. of n = 2 wells (ATF6-KD) or n = 3 wells (scram). B, mean percentage of YFP-positive cells 15 h after treatment. Error bars indicate S.E. of n = 3 independent experiments. Student's t tests were performed comparing ATF6-KD and scrambled control groups for each treatment. * indicates p < 0.05. C, percentage of YFP-positive cells over time in response to 0.5 μg/ml BFA or 0.1% DMSO in ATF6-KD and scrambled control group was plotted. Error bars indicate S.E. of n = 3 wells (DMSO) or n = 6 wells (BFA). D, mean percentage of YFP-positive cells 15 h after treatment. Error bars indicate S.E. of n = 3 independent experiments. Student's t tests were performed comparing ATF6-KD and scrambled control groups for each treatment. * indicates p < 0.05. E, percentage of PI-positive cells over time in response to 0.3 μm Tm or 0.1% DMSO in ATF6-KD and scrambled control group was plotted. Error bars indicate S.E. of n = 3 wells (ATF6-KD) or n = 2 wells (scram). F, mean percentage of PI-positive cells 45 h after treatment. Error bars indicate S.E. of n = 3 independent experiments. Student's t tests were performed comparing ATF6-KD and scrambled control groups for each treatment. G, percentage of PI-positive cells over time in response to 0.5 μg/ml BFA or 0.1% DMSO in ATF6-KD and scrambled control group was plotted. Error bars indicate S.E. of n = 3 wells (DMSO) or n = 6 wells (BFA). H, mean percentage of PI-positive cells 45 h after treatment. Error bars indicate S.E. of n = 3 independent experiments. Student's t tests were performed comparing ATF6-KD and scrambled control groups for each treatment. * indicates p < 0.05. I, percentage of PI-positive cells over time in response to 0.3 μm Tg or 0.1% DMSO in ATF6-KD and scrambled control group was plotted. Error bars indicate S.E. of n = 3 wells (ATF6-KD) or n = 2 wells (scram). J, mean percentage of PI-positive cells 45 h after treatment. Error bars indicate S.E. of n = 2 independent experiments. Student's t tests were performed comparing ATF6-KD and scrambled control groups for each treatment.
Figure 4.
Figure 4.
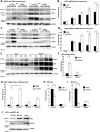
ATF6 silencing results in increased XBP1 splicing and IRE1 levels. SH-SY5Y cells were transduced with vectors encoding shRNA against ATF6 or scrambled control (scram) followed by treatment with 3 μm Tm or DMSO for 4 and 8 h (A) or 16 and 40 h (C). XBP1s and IRE1 protein levels were analyzed by Western blotting using antibodies against spliced XBP1, IRE1, and IRE1-p (Ser-714). β-Actin served as loading control. (Please note the membrane was further incubated with antibodies against PERK, eIF2α, and eIF2α-P as shown in Fig. S4A.) Real-time qPCR analysis of Ire1-spliced (B) or Xbp1-spliced (D) mRNA levels in cells silenced for ATF6 or scram control treated with 3 μm Tm for the times indicated. Results were normalized to β-actin levels and expressed relative to DMSO-treated scram control cells (mean of n = 3, error bars indicate S.E.). Student's t tests were performed to compare ATF6-KD and scram control group (* indicates p < 0.05). E, increase of IRE1 protein levels in response to 3 μm Tm in ATF6-KD and scram cells over time. SH-SY5Y cells were transduced with vectors encoding shRNA against ATF6 or scrambled control followed by treatment with Tm for times indicated. Protein levels were analyzed by Western blotting using antibodies against spliced XBP1, IRE1, and IRE1-p (Ser-714). β-Actin served as loading control. F, quantification of IRE1 protein levels at 40 h using densitometry. IRE1 levels were normalized to actin (mean of n = 3 independent experiments, error bars indicate S.E.), Real-time qPCR analysis of IRE1 mRNA (G), XBP1 mRNA (H), and ATF4 mRNA (I) in cells transduced with shRNA against ATF6, XBP1, ATF4, or scram control, treated with 3 μm Tm or DMSO for 24 h. Results were normalized to β-actin levels and expressed relative to respective DMSO-treated cells (mean of n = 3 from independent cultures, error bars indicate S.E.). Student's t tests were performed to compare Tm-treated and DMSO control group (* indicates p < 0.05) or XBP1-KD or ATF4-KD and scram control cells. (# indicates p < 0.05). J, XBP1s and IRE1 protein levels were analyzed by Western blotting using antibodies against spliced XBP1 and IRE1. β-Actin served as loading control.
Figure 5.
Figure 5.
IRE1 levels increase in response to ER stress. SH-SY5Y cells were treated with 3 μm Tm or Tg for times indicated. Increase in IRE1 protein levels in response to Tm (A) or Tg (B) were analyzed by Western blotting using antibodies against IRE1 and spliced XBP1. β-Actin served as loading control. Experiment was repeated with similar results. Real-time qPCR analysis of IRE1-mRNA in SH-SY5Y cells treated with 3 μm Tm (C) or 3 μm Tg (D) for times indicated. Results were normalized to β-actin levels and expressed relative to 0 h control cells (mean of n = 3), and error bars indicate S.E. Experiments were repeated with similar results. E, IRE1 expression levels were analyzed in SH-SY5Y cells treated with 3 μm Tg and with or without 1 μg/ml cycloheximide. Protein levels were analyzed by Western blotting using antibodies against IRE1 and KDEL antibody against GRP78 and GRP94. β-Actin served as loading control. Experiment was repeated with similar results.
Figure 6.
Figure 6.
Increase in IRE1 levels in response to ER stress depends on IRE1 and c-JUN phosphorylation. A, SH-SY5Y cells were pre-treated with 1 μm IRE1 kinase inhibitor APY29, 50 μm JNK inhibitor SP600125 for 1 h, followed by treatment with 3 μm Tg for 3 or 8 h. Protein levels were analyzed by Western blotting using antibodies against IRE1, and IRE1-p (Ser-714), spliced XBP1, c-JUN-p (Ser-63) and JNK. β-Actin served as loading control. SH-SY5Y cells were treated with 20 μm SP600125 (B) or 50 μm IRE1-endonuclease inhibitor 4μ8C (C) and/or 3 μm Tm for times indicated. Protein levels were analyzed by Western blotting using antibodies against IRE1, and IRE1-p (Ser-714), and spliced XBP1. β-Actin served as loading control. Experiments were repeated with similar results. D–G, IRE1-reporter cells were pre-treated with 1 μm APY29 or 50 μm 4μ8C for 1 h, followed by treatment with Tm or Tg and staining with Hoechst and PI. Cells were incubated on stage, and images were taken at 1-h intervals for 48 h using high-content time-lapse live cell imaging. The percentage of YFP-positive cells plotted over time in response to 1 μm APY29 or 50 μm 4μ8C pre-treatment and 0.3 μm Tm (D) or 1 μm Tg (F) and 0.1% DMSO. Error bars indicate S.E. of n = 4 wells. The mean percentage of YFP-positive cells 8 h after treatment with Tm (E) or Tg (G) is shown. Error bars indicate S.E. of n = 3 independent experiments. Student's t tests were performed comparing Tm and DMSO treated for each pre-treatment (* indicates p < 0.05) and comparing APY29 or 4μ8C pretreatment to control group (# indicates p < 0.05).
Figure 7.
Figure 7.
Expression of transcriptionally active ATF6 rescues IRE1 levels. IRE1-reporter cells were transduced with vector expressing HA-ATF6(1–373) or empty control vector. 96 h after transduction, the cells were stained with Hoechst and PI and treated with Tm or Tg. Images were taken at 1-h intervals for 48 h using high-content time-lapse live cell imaging. The percentage of YFP-positive cells over time in response to 0.3 μm Tm (A) or 0.3 μm Tg (C) and 0.1% DMSO in ATF6(1–373) and control group was plotted. Error bars indicate S.E. of n = 6 wells. The mean percentage of YFP-positive cells 15 h after treatment with 0.1, 0.3, or 1 μm Tm (B) or Tg and 0.1% DMSO control (D). Error bars indicate S.E. of n = 3 independent experiments. Student's t tests were performed comparing ATF6-oe and control groups for each treatment. * indicates p < 0.05. E, IRE1-reporter cells were transduced with vector expressing HA-ATF6(1–373) or empty control vector. 72 h after transduction, cells were harvested, and HA-ATF6 levels were analyzed by Western blotting using antibody against the HA-tag. β-Actin served as loading control. F, SH-SY5Y cells stably transfected with shRNA against ATF6 or scram control were transduced with vector expressing HA-ATF6(1–373) or empty control vector. ATF6 mRNA levels were analyzed by real-time qPCR using primer annealing in the 3′ region of endogenous Atf6 but not Ha-Atf6(1–373) or (G) primer annealing in the 5′ region of endogenous Atf6 and Ha-Atf6(1–373). Results were normalized to β-actin levels and expressed relative to scram control cells transduced with empty vector, mean of n = 3, error bars indicate S.E. Student's t tests were performed comparing all groups to scram control cells transduced with empty control vector; * indicates p < 0.05. Additionally ATF6-KD cells transduced with HA-ATF6(1–373) were compared with ATF6-KD cells expressing empty vector; # indicates p < 0.05. H, real-time qPCR analysis of IRE1 mRNA levels in SH-SY5Y cells stably transfected with shRNA against ATF6 or scram control and transduced with vector expressing HA-ATF6(1–373) or empty control vector followed by treatment with 3 μm Tm or DMSO for 24 h. Results were normalized to β-actin levels and expressed relative to scram control cells transduced with empty vector (mean of n = 3, error bars indicate S.E.). I, Western blot analysis of IRE1 protein levels in SH-SY5Y cells stably transfected with shRNA against ATF6 or scram control and transduced with vector expressing HA-ATF6(1–373) or empty control vector followed by treatment with 3 μm Tm or DMSO for 40 h. Antibodies against IRE1 and HA were used. β-Actin served as loading control.
Figure 8.
Figure 8.
Schematic showing the self-activating forward loop of Ire1 transcription and proposed role of ATF6 in regulating increase in IRE1 levels. Under ER stress, BiP dissociates from IRE1 and ATF6 to bind to unfolded proteins. IRE1 forms oligomers that enable autophosphorylation of its kinase domain and subsequent activation of its endonuclease domain. While the endonuclease domain catalyzes the splicing of Xbp1 mRNA, the kinase domain activity promotes IRE1 transcription through interaction with TRAF2 and subsequent activation of JNK and downstream transcription factors. Following dissociation of BiP, ATF6 is trafficked to the Golgi where the N-terminal cytosolic fragment is cleaved off. N-terminal ATF6 functions as a transcription factor and down-regulates IRE1 mRNA and protein levels during prolonged ER stress.

Similar articles

Cited by

References

    1. Lin J. H., Li H., Yasumura D., Cohen H. R., Zhang C., Panning B., Shokat K. M., Lavail M. M., and Walter P. (2007) IRE1 signaling affects cell fate during the unfolded protein response. Science 318, 944–949 10.1126/science.1146361 - DOI - PMC - PubMed
    1. Han J., Back S. H., Hur J., Lin Y. H., Gildersleeve R., Shan J., Yuan C. L., Krokowski D., Wang S., Hatzoglou M., Kilberg M. S., Sartor M. A., and Kaufman R. J. (2013) ER stress-induced transcriptional regulation increases protein synthesis leading to cell death. Nat. Cell Biol. 15, 481–490 10.1038/ncb2738 - DOI - PMC - PubMed
    1. Wu J., Rutkowski D. T., Dubois M., Swathirajan J., Saunders T., Wang J., Song B., Yau G. D., and Kaufman R. J. (2007) ATF6α optimizes long-term endoplasmic reticulum function to protect cells from chronic stress. Dev. Cell 13, 351–364 10.1016/j.devcel.2007.07.005 - DOI - PubMed
    1. Shoulders M. D., Ryno L. M., Genereux J. C., Moresco J. J., Tu P. G., Wu C., Yates J. R. 3rd., Su A. I., Kelly J. W., and Wiseman R. L. (2013) Stress-independent activation of XBP1s and/or ATF6 reveals three functionally diverse ER proteostasis environments. Cell Rep. 3, 1279–1292 10.1016/j.celrep.2013.03.024 - DOI - PMC - PubMed
    1. Bertolotti A., Zhang Y., Hendershot L. M., Harding H. P., and Ron D. (2000) Dynamic interaction of BiP and ER stress transducers in the unfolded-protein response. Nat. Cell Biol. 2, 326–332 10.1038/35014014 - DOI - PubMed

Publication types

MeSH terms