Large-scale transcriptome-wide association study identifies new prostate cancer risk regions
- PMID: 30287866
- PMCID: PMC6172280
- DOI: 10.1038/s41467-018-06302-1
Large-scale transcriptome-wide association study identifies new prostate cancer risk regions
Erratum in
-
Author Correction: Large-scale transcriptome-wide association study identifies new prostate cancer risk regions.Nat Commun. 2019 Jan 8;10(1):171. doi: 10.1038/s41467-018-08108-7. Nat Commun. 2019. PMID: 30622272 Free PMC article.
Abstract
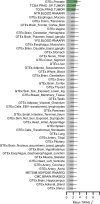
Although genome-wide association studies (GWAS) for prostate cancer (PrCa) have identified more than 100 risk regions, most of the risk genes at these regions remain largely unknown. Here we integrate the largest PrCa GWAS (N = 142,392) with gene expression measured in 45 tissues (N = 4458), including normal and tumor prostate, to perform a multi-tissue transcriptome-wide association study (TWAS) for PrCa. We identify 217 genes at 84 independent 1 Mb regions associated with PrCa risk, 9 of which are regions with no genome-wide significant SNP within 2 Mb. 23 genes are significant in TWAS only for alternative splicing models in prostate tumor thus supporting the hypothesis of splicing driving risk for continued oncogenesis. Finally, we use a Bayesian probabilistic approach to estimate credible sets of genes containing the causal gene at a pre-defined level; this reduced the list of 217 associations to 109 genes in the 90% credible set. Overall, our findings highlight the power of integrating expression with PrCa GWAS to identify novel risk loci and prioritize putative causal genes at known risk loci.
Conflict of interest statement
The authors declare no competing interests.
Figures


Comment in
-
Re: Large-Scale Transcriptome-Wide Association Study Identifies New Prostate Cancer Risk Regions.J Urol. 2019 Mar;201(3):447. doi: 10.1097/01.JU.0000553717.83594.53. J Urol. 2019. PMID: 30759679 No abstract available.
References
Publication types
MeSH terms
Grants and funding
- 16491/CRUK_/Cancer Research UK/United Kingdom
- 18504/CRUK_/Cancer Research UK/United Kingdom
- 17528/CRUK_/Cancer Research UK/United Kingdom
- U01 CA188392/CA/NCI NIH HHS/United States
- R01 HG006399/HG/NHGRI NIH HHS/United States
- G1000143/MRC_/Medical Research Council/United Kingdom
- R01 CA128978/CA/NCI NIH HHS/United States
- G0401527/MRC_/Medical Research Council/United Kingdom
- U01 CA098233/CA/NCI NIH HHS/United States
- U19 CA148112/CA/NCI NIH HHS/United States
- U19 CA148065/CA/NCI NIH HHS/United States
- HHSN268201200008I/HL/NHLBI NIH HHS/United States
- U01 CA098710/CA/NCI NIH HHS/United States
- MR/N003284/1/MRC_/Medical Research Council/United Kingdom
- U01 CA194393/CA/NCI NIH HHS/United States
- U01 CA098216/CA/NCI NIH HHS/United States
- HHSN268201200008C/HL/NHLBI NIH HHS/United States
- 14136/CRUK_/Cancer Research UK/United Kingdom
- U19 CA148537/CA/NCI NIH HHS/United States
- R01 HG009120/HG/NHGRI NIH HHS/United States
- U01 CA098758/CA/NCI NIH HHS/United States
LinkOut - more resources
Full Text Sources
Medical
Miscellaneous

