. 2018 Oct 1;4(2):vey028.
doi: 10.1093/ve/vey028. eCollection 2018 Jul.

Beneficial coinfection can promote within-host viral diversity

Affiliations

Beneficial coinfection can promote within-host viral diversity

Asher Leeks et al. Virus Evol. .

Abstract

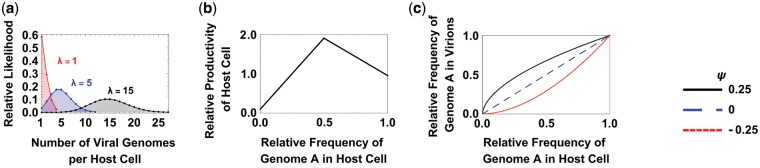
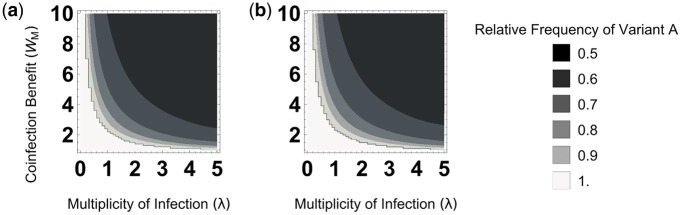
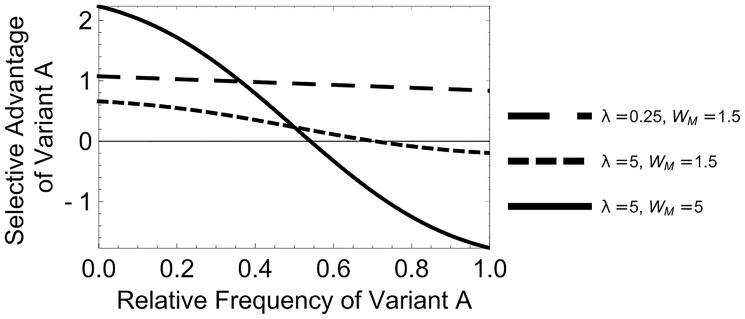
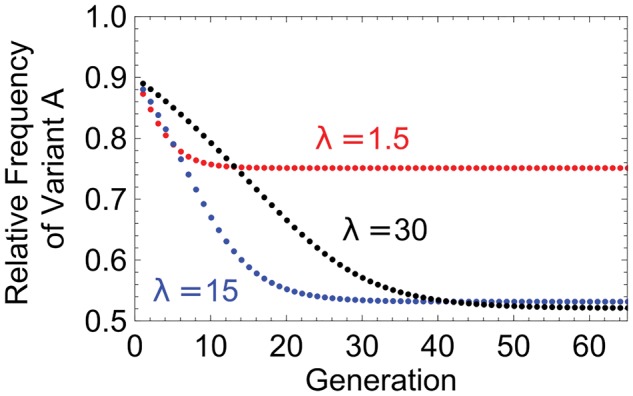
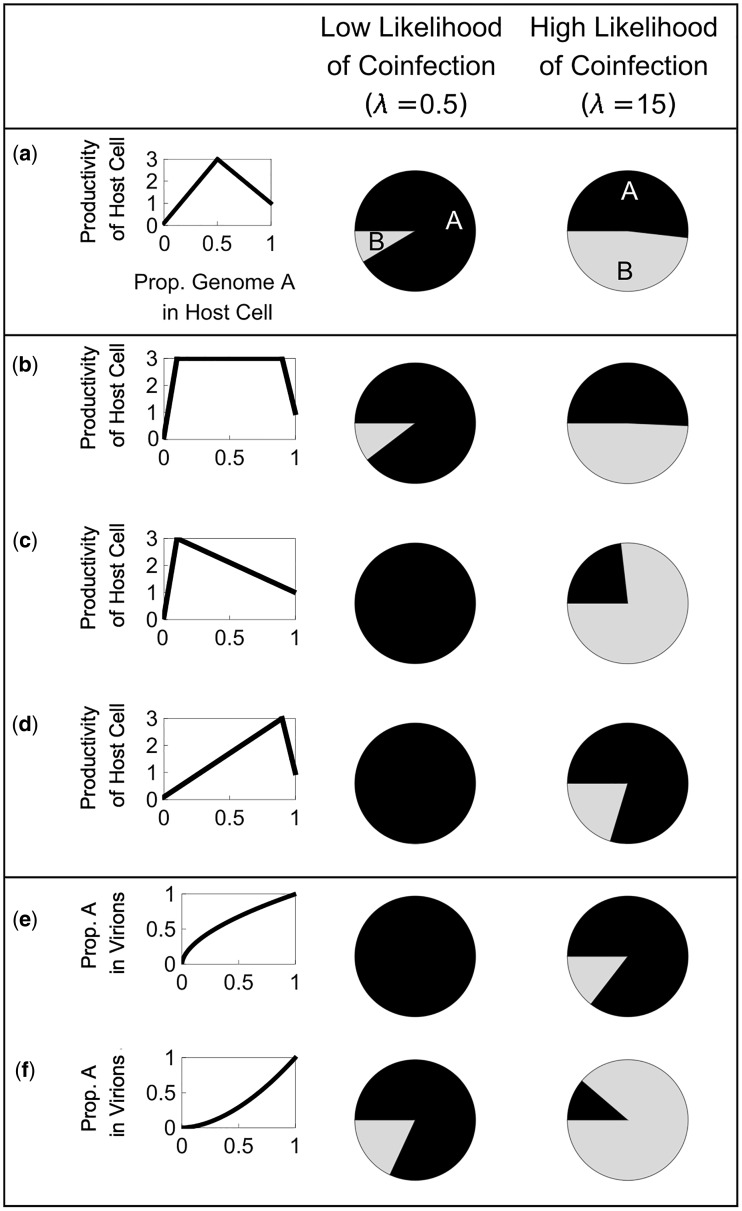
In many viral infections, a large number of different genetic variants can coexist within a host, leading to more virulent infections that are better able to evolve antiviral resistance and adapt to new hosts. But how is this diversity maintained? Why do faster-growing variants not outcompete slower-growing variants, and erode this diversity? One hypothesis is if there are mutually beneficial interactions between variants, with host cells infected by multiple different viral genomes producing more, or more effective, virions. We modelled this hypothesis with both mathematical models and simulations, and found that moderate levels of beneficial coinfection can maintain high levels of coexistence, even when coinfection is relatively rare, and when there are significant fitness differences between competing variants. Rare variants are more likely to be coinfecting with a different variant, and hence beneficial coinfection increases the relative fitness of rare variants through negative frequency dependence, and maintains diversity. We further find that coexisting variants sometimes reach unequal frequencies, depending on the extent to which different variants benefit from coinfection, and the ratio of variants which leads to the most productive infected cells. These factors could help drive the evolution of defective interfering particles, and help to explain why the different segments of multipartite viruses persist at different equilibrium frequencies.

Keywords: coinfection; diversity; evolution; frequency dependence; multipartite; phenotype mixing.


Figures

Figure 1.
Figure 1.
Equilibrium model assumptions. (a) We assume that infection of host cells is well described by a Poisson distribution (P(λ)), where the Poisson parameter λ is given by the ratio of virions to susceptible host cells (MOI). We truncate our Poisson distribution at 1, to focus on infected cells, and at three standard deviations above the mean, to avoid a potentially infinite number of infection states. (b) We assume mixed infections are more productive. The productivity of an infected host cell (y-axis) shows a peaked relationship with relative proportion of variant A virions in the initial infection mixture (pA; x-axis) according to the function Φ(pA). (c) We assume that the proportion of A genomes in the virions produced by that cell (y-axis) can be either linearly or non-linearly related to the proportion of A genomes that initially infected the host cell (pA; x-axis), according to the function Π(pA).
Figure 2.
Figure 2.
Coexistence. The x-axis is the multiplicity of infection (MOI; λ), which represents the ratio of virions to host cells. The y-axis is the productivity of mixed infections (WM), relative to the productivity of a cell infected only with genome A (WA). (a) Variant A spreads 10 times more quickly than variant B in pure infections (WA=1, WB=0.1). Coexistence is favoured by high multiplicity of infection (λ) and productivity in mixed infection (WM). (b) Variant A spreads 1,000 times more quickly than variant B in pure infections (WA=1, WB=0.001). Even though variant A is three orders of magnitude more productive than variant B in pure infection, provided coinfections are frequent and beneficial enough, variants A and B coexist at approximately equal frequencies.
Figure 3.
Figure 3.
Negative frequency dependence. The selective advantage of variant A is plotted against the relative frequency of variant A in the population. As variant A becomes more common, its relative fitness decreases (negative frequency dependence). When the selective advantage of variant A is >0 it will increase in frequency, and when it is <0, it will decrease in frequency.
Figure 4.
Figure 4.
Time to reach equilibrium. The relative frequency of variant A is plotted against time, for different multiplicities of infection (MOI; λ). At low MOI (red), the system quickly reaches an equilibrium state. At higher MOI (black and blue), the system reaches an equilibrium that is closer to an even distribution of the two variants. At the highest MOI (black) it takes longer to reach this equilibrium. Therefore, while the highest MOI gives the most even equilibrium ratio of A:B, if the system is observed before it has reached equilibrium (e.g. generation 30), higher MOI may result in a more uneven ratio of A:B.
Figure 5.
Figure 5.
Within-cell processes. Shaded pie charts illustrate the relative frequency of each variant at equilibrium. (a) When both variants contribute equally to coinfection benefit, variant A dominates at low MOI, while both variants coexist at high MOI. (b) A similar pattern is seen when a small amount of either a variant maximises coinfection benefit. (c) When a small amount of the more productive variant (A) maximises coinfection benefit, variant A dominates at low MOI while variant B dominates at high MOI. (d) When a small amount of the less productive variant (B) maximises coinfection benefit, variant A dominates at both low and high MOI. (e) When the more productive variant (A) gains a greater share of the virions produced in mixed infection, variant A dominates at both low and high MOI. (f) When the less productive variant (B) gains a greater share of the virions produced in mixed infection, variant A dominates at low MOI but variant B dominates at high MOI. Overall, asymmetries in how each variant contributes to and benefits from coinfection benefit tend to disfavour coexistence.
Figure 6.
Figure 6.
Scheme of the simulation. A two-dimensional grid contained NS susceptible, NE eclipse phase, NP virus-producing, and ND dead cells. Infection (NS → NE) was a second order, Poisson stochastic processes occurring with probability P = 1 − exp(−λΔt) for each cell and simulation time unit Δt (0.1 min). For infection, λ=kVVNS, where kV is the infection rate (infectivity), V is the local virus concentration, and NS is 1 or 0.
Figure 7.
Figure 7.
Coexistence in the simulations. The heatmaps represent equilibrium values, which were typically reached after 20 generations. In (b) and (d), superinfection exclusion occurs 3 h after a cell is infected. (a) The final MOI (ratio of viral particles: susceptible host cells) depends on both the infectivity of viral particles and the coinfection benefit. The infectivity is the likelihood that a viral particle will successfully infect a host cell upon contact. (b) Superinfection exclusion reduces the MOI since it makes multiple infection less likely. (c) Coexistence between the two variants is most likely when the coinfection benefit is large and viral particles are highly infectious. (d) Superinfection exclusion reduces the parameter space under which coexistence is found. All parameters were as shown in Supplementary Table S1 except those varied in the graph; rv was 10 times lower for variant B.

Similar articles

Cited by

References

    1. Andino R., Domingo E. (2015) ‘Viral Quasispecies’, Virology, 479–480: 46–51. - PMC - PubMed
    1. Arbiza J., Mirazo S., Fort H. (2010) ‘Viral Quasispecies Profiles as the Result of the Interplay of Competition and Cooperation’, BMC Evolutionary Biology, 10: 137. - PMC - PubMed
    1. Bergua M. et al. (2014) ‘A Viral Protein Mediates Superinfection Exclusion at the Whole-Organism Level but Is Not Required for Exclusion at the Cellular Level’, Journal of Virology, 88: 11327–38. - PMC - PubMed
    1. Bonhoeffer S. et al. (1997) ‘Virus Dynamics and Drug Therapy’, Proceedings of the National Academy of Sciences of the United States of America, 94: 6971–6. - PMC - PubMed
    1. Bordería A. V. et al. (2015) ‘Group Selection and Contribution of Minority Variants during Virus Adaptation Determines Virus Fitness and Phenotype’, PLOS Pathogens, 11: e1004838. - PMC - PubMed