. 2018 Aug 20;7(10):e1468956.
doi: 10.1080/2162402X.2018.1468956. eCollection 2018.

Long-term outcomes of a phase I study of agonist CD40 antibody and CTLA-4 blockade in patients with metastatic melanoma

Affiliations

Long-term outcomes of a phase I study of agonist CD40 antibody and CTLA-4 blockade in patients with metastatic melanoma

David L Bajor et al. Oncoimmunology. .

Abstract

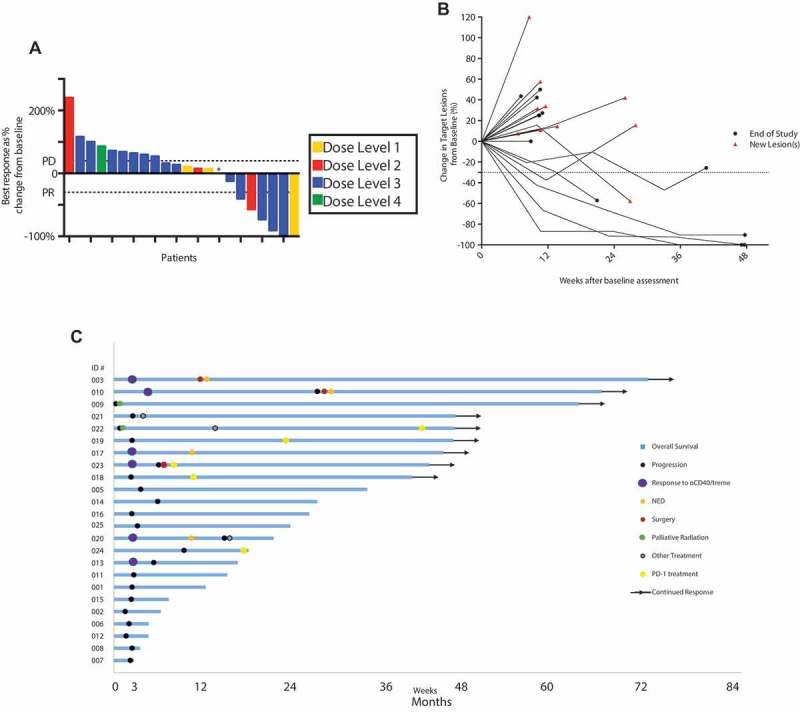
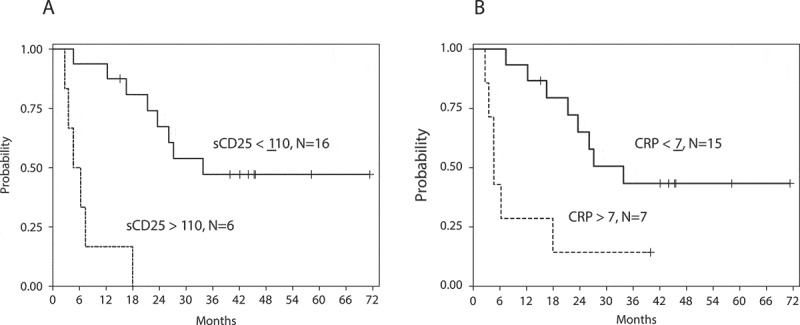
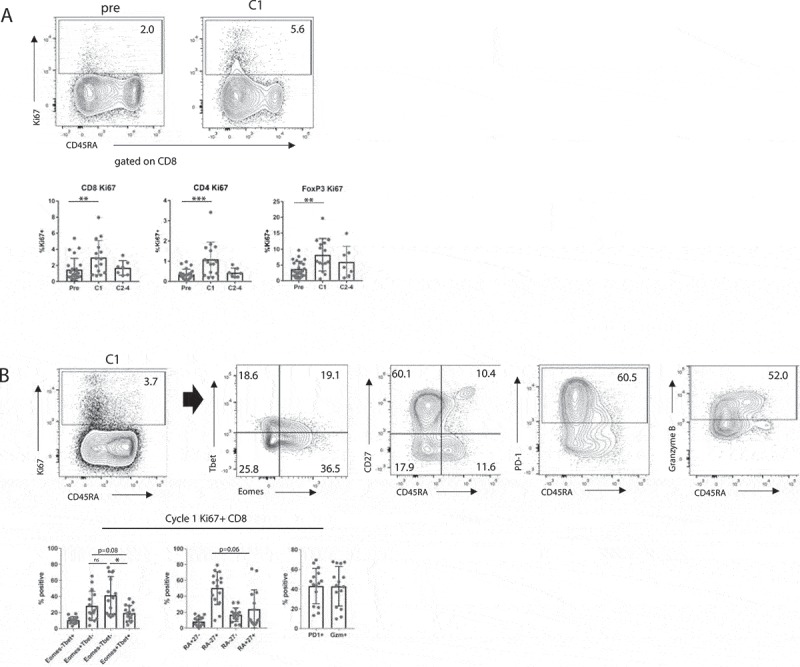
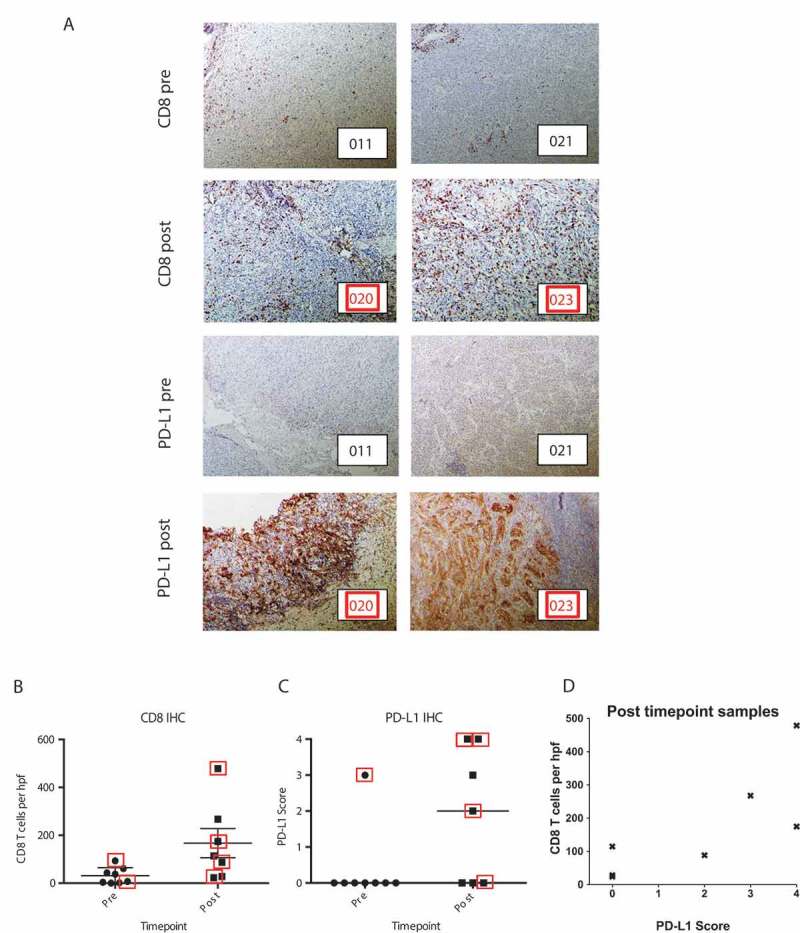
We report long-term clinical outcomes and immune responses observed from a phase 1 trial of agonist CD40 monoclonal antibody (mAb) and blocking CTLA-4 mAb in patients with metastatic melanoma. Twenty-four patients previously untreated with checkpoint blockade were enrolled. The agonistic CD40 mAb CP-870,893 and the CTLA-4 blocking mAb tremelimumab were dosed concomitantly every 3 weeks and 12 weeks, respectively, across four dose combinations. Two patients developed dose-limiting grade 3 immune-mediated colitis that led to the definition of the maximum tolerated dose (MTD). Other immune-mediated toxicity included uveitis (n = 1), hypophysitis (n = 1), hypothyroidism (n = 2), and grade 3 cytokine release syndrome (CRS) (n = 1). The estimated MTD was 0.2 mg/kg of CP-870,893 and 10 mg/kg of tremelimumab. In 22 evaluable patients, the objective response rate (ORR) was 27.3%: two patients (9.1%) had complete responses (CR) and four (18.2%) patients had partial responses (PR). With a median follow-up of 45 months, the median progression-free survival (PFS) was 3.2 months (95% CI, 1.3-5.1 months) and median overall survival (OS) was 23.6 months (95% CI, 11.7-35.5 months). Nine patients are long-term survivors (> 3 years), 8 of whom subsequently received other therapy including PD-1 mAb, surgery, or radiation therapy. Elevated baseline soluble CD25 was associated with shorter OS. Immunologically, treatment was associated with evidence of T cell activation and increased tumor T cell infiltration that was accomplished without therapeutic PD-1/PD-L1 blockade. These results suggest opportunities for immune activation and cancer immunotherapy beyond PD-1.

Keywords: CD40; CTLA4; melanoma.


Figures

Figure 1.
Figure 1.
Clinical activity of CP-870,893 and tremelimumab in metastatic melanoma. Data are illustrated as (a) waterfall plot showing RECIST responses per dose level, * patient came off study before a second scan. (b) spider plot showing tumor measurements for each patient, and (c) swimmer plot showing long-term clinical course for each patient.
Figure 2.
Figure 2.
Probability of OS. Data for baseline (a) sCD25 and (b) CRP, grouped according to classification and regression tree (CART) analysis. For sCD25high/low, HR = 13.38, 95% CI 3.17 – 56.50. For CRPhigh/low, HR = 4.14, 95% CI 1.39 – 12.33.
Figure 3.
Figure 3.
Immune analysis of peripheral lymphocytes. (a) Ki67 expression in CD8 T cells, CD4 T cells, and Tregs at serial time points. ** p < 0.01, *** p < 0.001 by linear regression. (b) Expression of Eomes versus Tbet, CD45RA versus CD27, PD-1, and Granzyme B in Ki67+ CD8 T cells at cycle 1. Eomes versus Tbet analyzed using Student’s paired t-test, CD45A versus CD27 analyzed using Wilcoxon matched pairs signed rank test, * p < 0.05.
Figure 4.
Figure 4.
Immunohistochemistry analysis of tumor. (a) Representative examples of tumor biopsies obtained at baseline and post-treatment, each stained for CD8 (top) and PD-L1 (bottom). Patient identifying numbers are shown in bottom right of each photomicrograph, corresponding to Figure 1c. (b) Quantification of CD8 cells. Mean of five high-powered fields (hpf) are shown for each sample. Whisker plots indicate mean and standard error of the group. Group differences were determined by linear regression, p = 0.009. (c) Quantification of PD-L1 expression; group differences were determined by ordinal logistic regression, p = 0.072. Lines indicate median. (d) Correlation of PD-L1 and CD8 IHC in post-treatment tumor samples. The x-axis indicates PD-L1 score as in (c) and the y-axis indicates mean CD8 cells of 5 hpf for each patient. Spearman’s correlation coefficient ρ = 0.82 with p = 0.022. Red squares indicate patients with objective responses.

References

    1. Sharma P, Allison JP.. The future of immune checkpoint therapy. Science. 2015;348:56–61. doi: 10.1126/science.aaa8172. - DOI - PubMed
    1. Huang AC, Postow MA, Orlowski RJ, Mick R, Bengsch B, Manne S, Xu W, Harmon S, Giles JR, Wenz B, et al. T-cell invigoration to tumour burden ratio associated with anti-PD-1 response. Nature. 2017;545:60–65. doi: 10.1038/nature22079. - DOI - PMC - PubMed
    1. Vonderheide RH, Glennie MJ. Agonistic CD40 antibodies and cancer therapy. Clin Cancer Res. 2013;19:1035–1043. doi: 10.1158/1078-0432.CCR-12-2064. - DOI - PMC - PubMed
    1. Buchbinder E, Hodi FS. Cytotoxic T lymphocyte antigen-4 and immune checkpoint blockade. J Clin Invest. 2015;125:3377–3383. doi: 10.1172/JCI80012. - DOI - PMC - PubMed
    1. Sharma P, Allison JP. Immune checkpoint targeting in cancer therapy: toward combination strategies with curative potential. Cell. 2015;161:205–214. doi: 10.1016/j.cell.2015.03.030. - DOI - PMC - PubMed

Publication types