. 2018 Aug 15;7(10):e1475875.
doi: 10.1080/2162402X.2018.1475875. eCollection 2018.

A point mutation in the Ncr1 signal peptide impairs the development of innate lymphoid cell subsets

Affiliations

A point mutation in the Ncr1 signal peptide impairs the development of innate lymphoid cell subsets

Francisca F Almeida et al. Oncoimmunology. .

Abstract

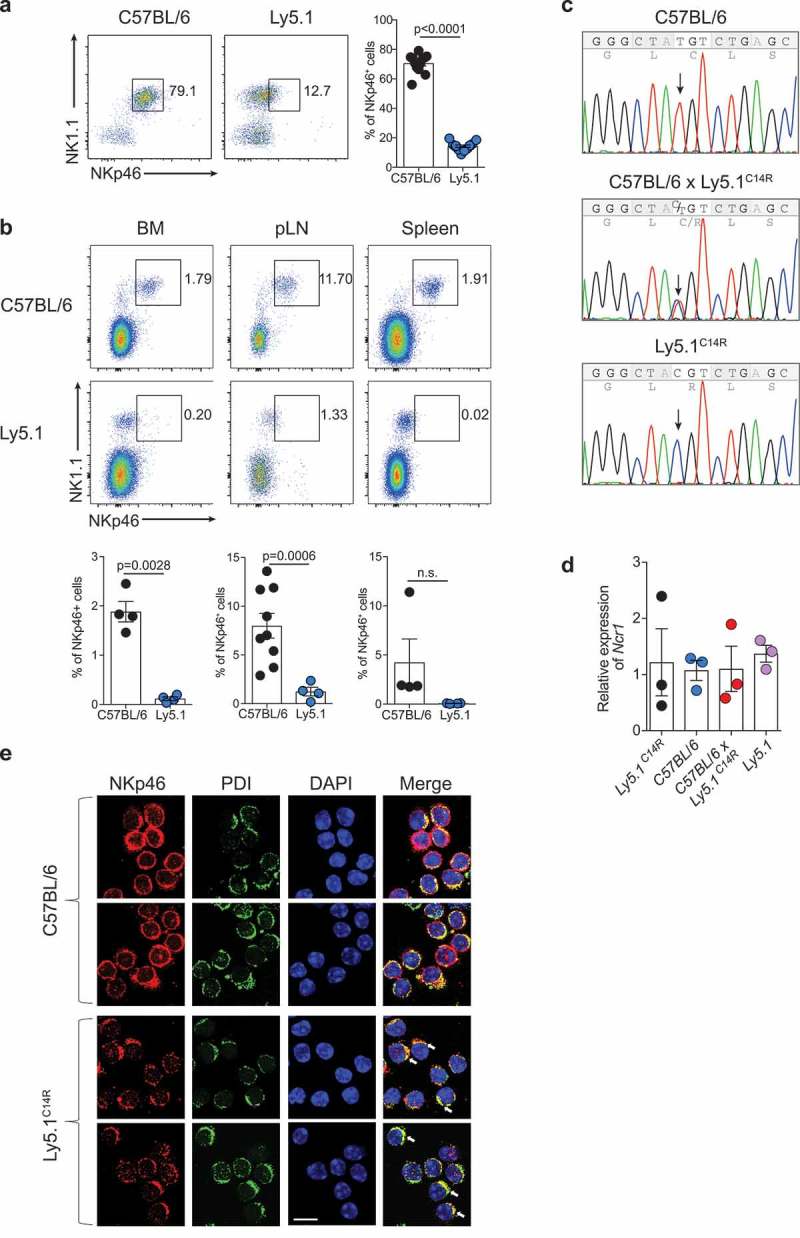
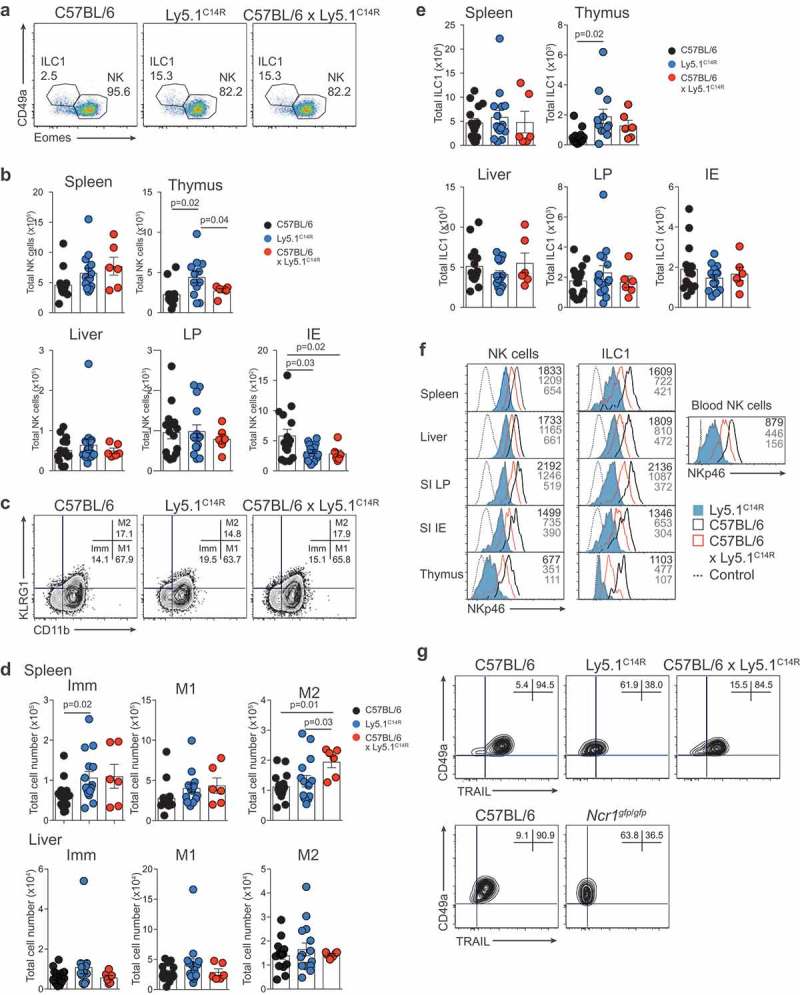
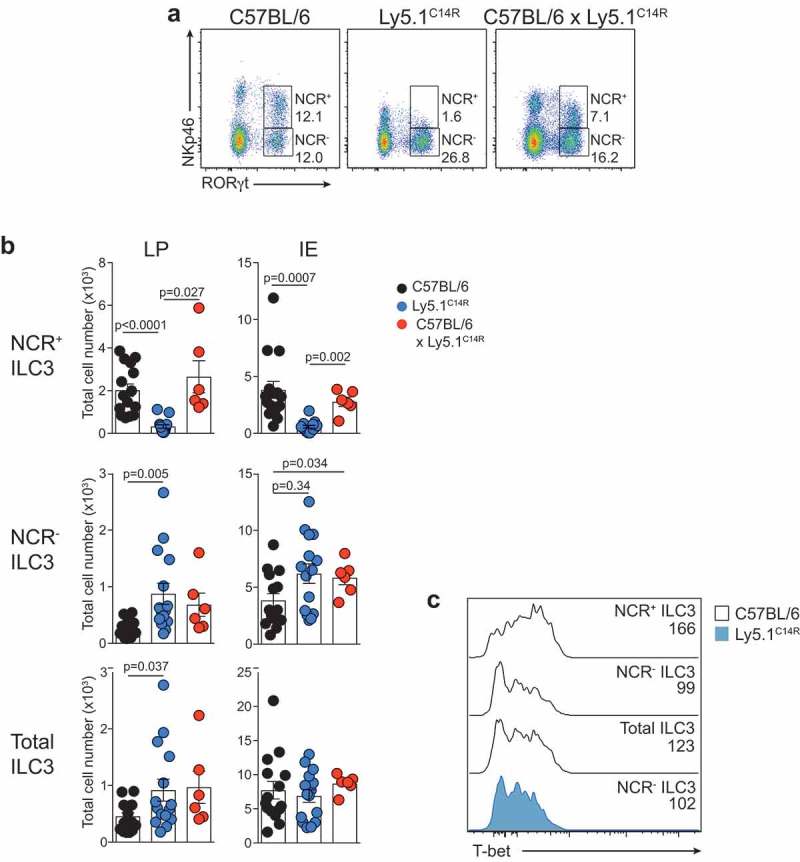
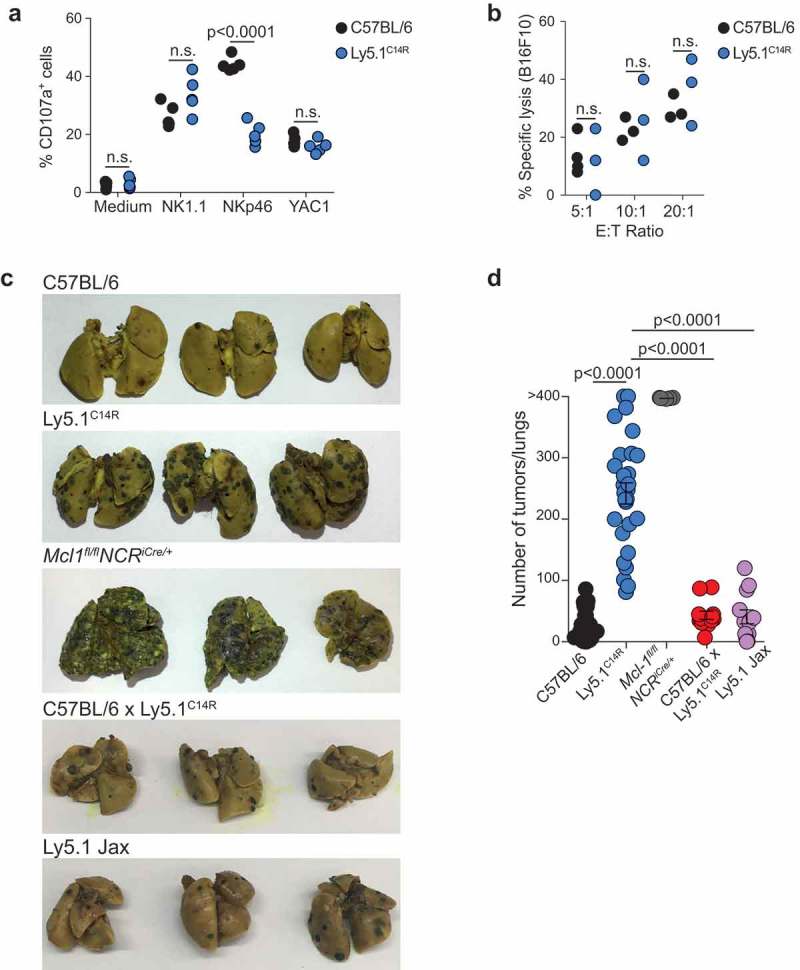
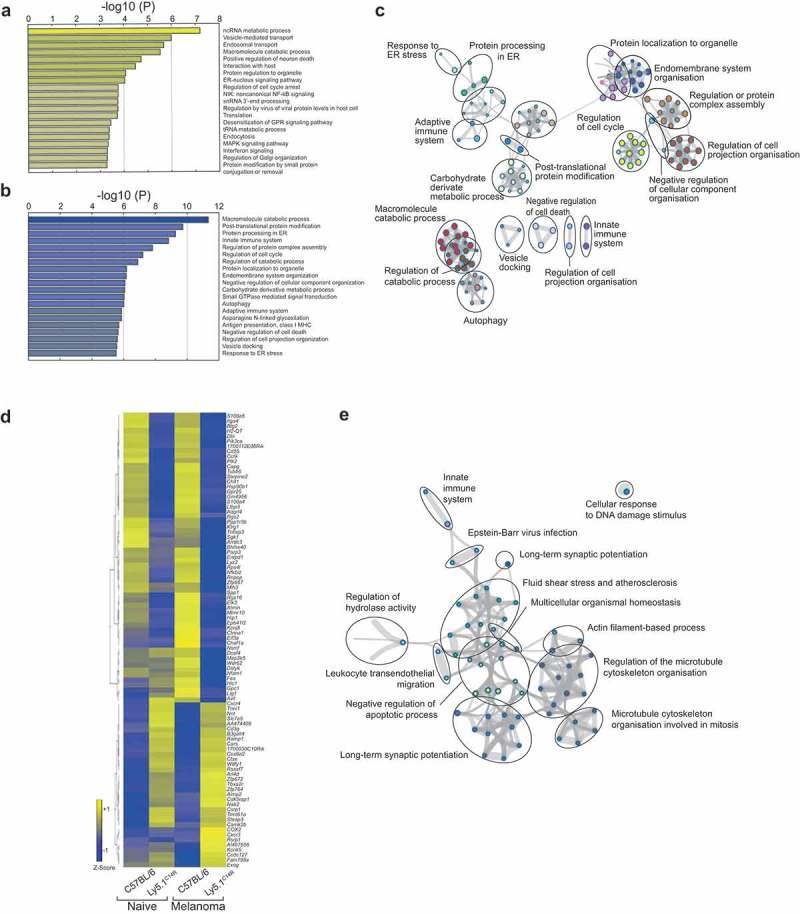
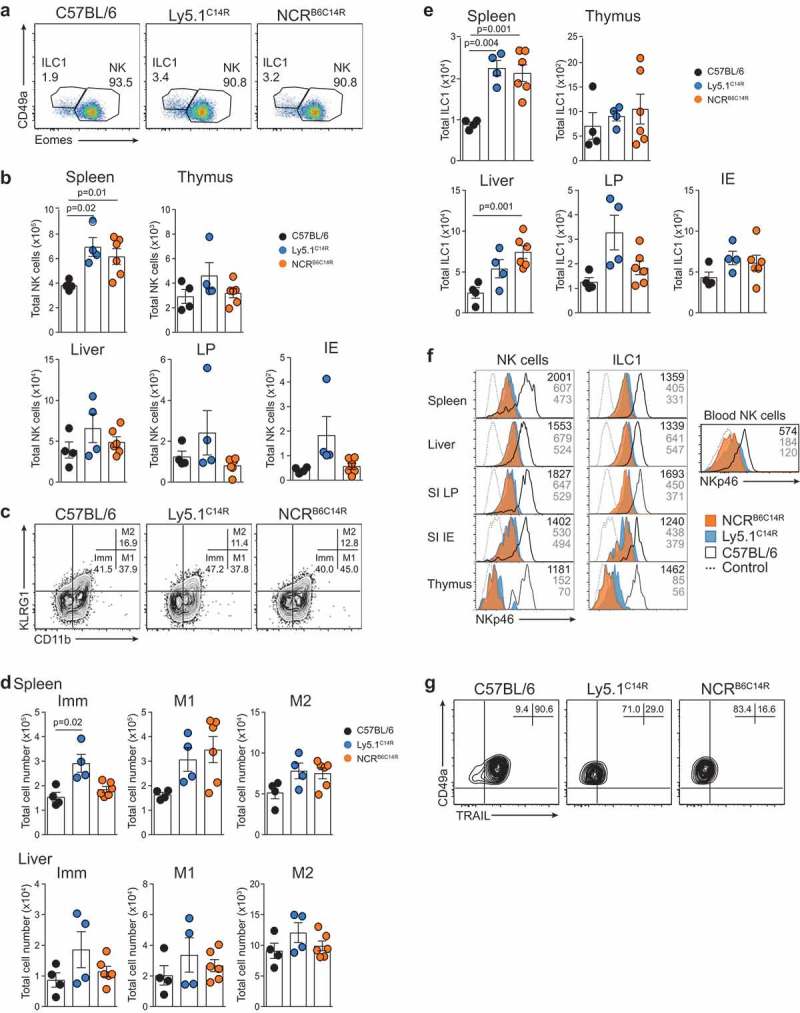
NKp46 (CD335) is a surface receptor shared by both human and mouse natural killer (NK) cells and innate lymphoid cells (ILCs) that transduces activating signals necessary to eliminate virus-infected cells and tumors. Here, we describe a spontaneous point mutation of cysteine to arginine (C14R) in the signal peptide of the NKp46 protein in congenic Ly5.1 mice and the newly generated NCRB6C14R strain. Ly5.1C14R NK cells expressed similar levels of Ncr1 mRNA as C57BL/6, but showed impaired surface NKp46 and reduced ability to control melanoma tumors in vivo. Expression of the mutant NKp46C14R in 293T cells showed that NKp46 protein trafficking to the cell surface was compromised. Although Ly5.1C14R mice had normal number of NK cells, they showed an increased number of early maturation stage NK cells. CD49a+ILC1s were also increased but these cells lacked the expression of TRAIL. ILC3s that expressed NKp46 were not detectable and were not apparent when examined by T-bet expression. Thus, the C14R mutation reveals that NKp46 is important for NK cell and ILC differentiation, maturation and function. Significance Innate lymphoid cells (ILCs) play important roles in immune protection. Various subsets of ILCs express the activating receptor NKp46 which is capable of recognizing pathogen derived and tumor ligands and is necessary for immune protection. Here, we describe a spontaneous point mutation in the signal peptide of the NKp46 protein in congenic Ly5.1 mice which are widely used for tracking cells in vivo. This Ncr1 C14R mutation impairs NKp46 surface expression resulting in destabilization of Ncr1 and accumulation of NKp46 in the endoplasmic reticulum. Loss of stable NKp46 expression impaired the maturation of NKp46+ ILCs and altered the expression of TRAIL and T-bet in ILC1 and ILC3, respectively.

Keywords: activation receptors; congenic mice; innate lymphoid cells; intracellular trafficking.


Figures

Figure 1.
Figure 1.
Ly5.1 congenic mouse strain exhibits reduced surface expression of NKp46 that alters the localization of the NKp46 protein. (A) Dot plot showing the staining and frequency of NK1.1+NKp46+ cells in the peripheral blood lymphocytes of C57BL/6 and Ly5.1 mice. Data show representative plots gated on live lymphocytes CD3 CD19 (n = 12 mice/genotype). (B) Dot plots showing the expression and frequency quantification of NK1.1+NKp46+ cells in the bone marrow (BM), peripheral lymph node (pLN) and spleen of C57BL/6 and Ly5.1 mice. (A, B) Data show representative plots gated on live lymphocytes CD3CD19 pooled from two to five independent experiments (n = 4–12 mice/genotype/tissue). (C) Sanger sequencing analysis of the Ncr1 gene in C57BL/6, C57BL/6 × Ly5.1C14R and Ly5.1C14R mice showing the position of the point mutation. (D) Relative levels of NKp46 transcripts in splenic NK cells of C57BL/6, Ly5.1C14R, WT Ly5.1 and C57BL/6 × Ly5.1C14R mice. Data show the mean ± SEM of 3–4 mice/genotype for one of three similar experiments. P values were calculated using an unpaired two-tailed Student’s t test. (E) NKp46 localization in primary NK cells. Representative images of NK cells isolated from C57BL/6 and mutant Ly5.1C14R mice stained with anti-NKp46 and anti-PDI primary antibodies, and AlexaFluor488-conjugated anti-goat and AlexaFluor546-conjugated anti-rabbit secondary antibodies (DAPI nuclear stain, blue; anti-NKp46, red; PDI, green). Images were obtained using confocal scanning microscopy. Arrows indicate ER localization. Scale bar, 10 μm.
Figure 2.
Figure 2.
Disruption of NK cell homeostasis and maturation of ILC1 and NK cells in Ly5.1C14R mice. (A) Dot plots showing the frequency of ILC1 and NK cells in the spleen. Data show representative plots gated on live NK1.1+ lymphocytes excluding T and B cells in C57BL/6, Ly5.1C14R and C57BL/6 × Ly5.1C14R mice. (B) Total number of NK cells in spleen, thymus, liver, small intestine lamina propria (LP) and within the intestinal intraepithelial compartment (IE). Data show the mean ± SEM pooled from three to six independent experiments (n = 6–15 mice/genotype); thymus are pooled from three to five independent experiments (n = 6–12 mice/genotype). P values were calculated using an unpaired two-tailed Student’s t test. (C) FACS plots showing the frequency of immature (Imm, KLRG1CD11b), mature 1 (M1, KLRG1CD11b+) and mature 2 (M2, KLRG1+CD11b+) NK cells in splenic NK1.1+CD3CD19 NK cells. (D) Total number of Imm, M1 and M2 NK cells in the spleen and liver of C57BL/6, Ly5.1C14R and C57BL/6 × Ly5.1C14R mice showing the mean ± SEM pooled from three to six independent experiments (n = 6–15 mice/genotype). P values were calculated using an unpaired two-tailed Student’s t test. (E) Total number of ILC1s in spleen, thymus, liver, small intestine lamina propria (LP) and within the intestinal intraepithelial compartment (IE). Data show the mean ± SEM pooled from three to six independent experiments (n = 6–15 mice/genotype); thymus data are pooled from three to five independent experiments (n = 6–12 mice/genotype). P values were calculated using an unpaired two-tailed Student’s t test. (F) Histograms showing the mean fluorescence intensity of NKp46 in various tissues for both NK cells and ILC1 for wild-type (black solid line), Ly5.1C14R (solid blue) and C57BL/6 × Ly5.1C14R (red solid line). CD3ϵ+ cells were used as a control for NKp46 expression (black dashed line). Data are representative of tissues analyzed in (A–E). (G) Expression of TRAIL on NK1.1+CD49a+CD3CD19 hepatic ILC1 in C57BL/6, Ly5.1C14R and C57BL/6 × Ly5.1C14R (results shown in the upper panels) and in C57BL/6 controls compared to Ncr1gfp/gfp (results from experiment shown in the lower panels). Data show representative plots from three to five independent experiments and indicate the the frequency of expression (n = 6–12 mice/genotype).
Figure 3.
Figure 3.
Ly5.1C14R mice have abnormal numbers of ILC3. (A) Dot plots showing the frequency of NCR+ and NCR ILC3 in the LP of the small intestine of C57BL/6, Ly5.1C14R and C57BL/6 × Ly5.1C14R mice. Data show representative plots gated on live CD3CD19 lymphocytes. (B) Enumeration of NCR+, NCR and total ILC3 for LP and IE in the small intestine. Data showing the mean ± SEM pooled from three to six independent experiments (n = 6–15 mice/genotype). P values were calculated using an unpaired two-tailed Student’s t test. (C) Histograms show the mean fluorescence intensity of intracellular staining for T-bet in ILC3 subsets from the small intestine of C57BL/6 and Ly5.1C14R mice (n = 6 mice/genotype). P values were calculated using a Student’s t test.
Figure 4.
Figure 4.
Ly5.1C14R NK cells cells show altered sensitivity to stimuli in vitro but fail to control melanoma tumor development in vivo. (A) Degranulation capacity of total NK1.1+ NK cells determined by surface CD107a expression in C57BL/6 and Ly5.1C14R cells. Data show frequencies of CD107a+ NK cells ± SEM after coculture with various stimuli. Data shown from 2 independent experiments (n = 5 mice/genotype). (B) Cytolytic activity of C57BL/6 and Ly5.1C14R NK cells sensitized to B16F10 tumor cells. NK cells have been activated overnight with IL-2 (1000 U/ml). Data show the mean lysis ± SEM pooled from three independent experiments (n = 3 mice/genotype in each experiment). P values were calculated using a Student’s t test. (C) Representative whole mounts of the metastatic burden in the lungs of C57BL/6, Ly5.1C14R, Mcl-1fl/flNcr1iCre, C57BL/6 × Ly5.1C14R and Ly5.1 (Jax, 2017) mice 14 days after i.v injection of B16F10 melanoma cells. (D) Total tumor burden in the lungs of C57BL/6, Ly5.1C14R, Mcl-1fl/flNcr1iCre, C57BL/6 × Ly5.1C14R and Ly5.1 (Jax, 2017) mice shown in (C) 14 days after injection of B16F10 melanoma cells. Data show the mean ± SEM of tumor burden pooled from five independent experiments (n = 28–30 mice/genotype). Mcl-1fl/flNcr1iCre mice included in a single experiment (n = 5 mice/genotype) while C57BL/6 × Ly5.1C14R and Ly5.1 (Jax, 2016) mice were included in two experiments (n = 12 mice/genotype). P values were calculated using an unpaired two-tailed Student’s t test.
Figure 5.
Figure 5.
Altered molecular machinery in naïve Ly5.1C14R mutant NK cells affects antigen processing and protein trafficking pathways. (A, B) Enrichment clusters from genes upregulated and downregulated, respectively, in naïve Ly5.1C14R NK cells compared with C57BL/6 NK cells. (C) Gene ontology (GO) network analysis of significantly reduced gene expression levels in Ly5.1C14R NK cells (shown in B) via Metascape and visualized with Cytoskape (v3.1.2). (D) Heatmap of genes significantly up and downregulated in NK cells responding to B16F10 melanoma tumor cells seven days after challenge presented to show differences in gene expression patterns for C57BL/6 and Ly5.1C14R mice and the comparative gene expression found in naïve NK cells. (E) Gene ontology (GO) network analysis of significantly reduced gene expression levels in Ly5.1C14R NK cells isolated from day 7 lungs of mice challenged with B16F10 tumor cells. Nodes are coloured by p-value via Metascape and visualized with Cytoskape.
Figure 6.
Figure 6.
Loss of NKp46 surface expression depends on the C14R mutation in the Ncr1 gene. (A) Dot plots showing the frequency of ILC1 and NK cells in the spleen. Data show representative plots gated on live NK1.1+ lymphocytes excluding T and B cells. (B) Total number of NK cells in spleen, thymus, liver, small intestine lamina propria (LP) and within the intestinal intraepithelial compartment (IE). Data are pooled from two independent experiments and show the mean ± SEM (n = 4–6 mice/genotype). P values were calculated using an unpaired two-tailed Student’s t test. (C) FACS plots showing the frequency of immature (Imm, KLRG1CD11b), mature 1 (M1, KLRG1CD11b+) and mature 2 (M2, KLRG1+CD11b+) NK cells in splenic NK1.1+CD3CD19 NK cells. (D) Total number of Imm, M1 and M2 NK cells in the spleen and liver of C57BL/6, Ly5.1C14R and NCRB6C14R mice showing the mean ± SEM pooled from two experiments (n = 4–6 mice/genotype). P values were calculated using an unpaired two-tailed Student’s t test. (E) Total number of ILC1s in spleen, thymus, liver, small intestine lamina propria (LP) and within the intestinal intraepithelial compartment (IE). Data show the mean ± SEM pooled from two independent experiments (n = 4–6 mice/genotype). P values were calculated using an unpaired two-tailed Student’s t test. (F) Histograms showing the mean fluorescence intensity of NKp46 in various tissues for both NK cells and ILC1 for wild-type (black solid line), Ly5.1C14R (solid blue) and NCRB6C14R (solid orange). CD3ϵ+ cells were used as a control for NKp46 expression (black dashed line). Data are representative of tissues analyzed in (A-E). (G) Expression of TRAIL on NK1.1+CD49a+CD3CD19 hepatic ILC1 in C57BL/6, Ly5.1C14R and NCRB6C14R. Data show representative plots from two independent experiments and indicate the the frequency of expression (n = 4–6 mice/genotype).

References

    1. Lam VC, Lanier LL.. NK cells in host responses to viral infections. Curr Opin Immunol. 2017;44:43–51. doi:10.1016/j.coi.2016.11.003. - DOI - PMC - PubMed
    1. Vivier E, Tomasello E, Baratin M, Walzer T, Ugolini S. Functions of natural killer cells. Nat Immunol. 2008;9(5):503–510. doi:10.1038/ni1582. - DOI - PubMed
    1. Seidel E, Glasner A, Mandelboim O. Virus-mediated inhibition of natural cytotoxicity receptor recognition. Cell Mol Life Sci. 2012;69(23):3911–3920. doi:10.1007/s00018-012-1001-x. - DOI - PMC - PubMed
    1. Thielens A, Vivier E, Romagne F. NK cell MHC class I specific receptors (KIR): from biology to clinical intervention. Curr Opin Immunol. 2012;24(2):239–245. doi:10.1016/j.coi.2012.01.001. - DOI - PubMed
    1. Satoh-Takayama N, et al. Microbial flora drives interleukin 22 production in intestinal NKp46+ cells that provide innate mucosal immune defense. Immunity. 2008;29(6):958–970. doi:10.1016/j.immuni.2008.11.001. - DOI - PubMed

Publication types