. 2018 Jul 26;7(10):e1490853.
doi: 10.1080/2162402X.2018.1490853. eCollection 2018.

TGF-β1 programmed myeloid-derived suppressor cells (MDSC) acquire immune-stimulating and tumor killing activity capable of rejecting established tumors in combination with radiotherapy

Affiliations

TGF-β1 programmed myeloid-derived suppressor cells (MDSC) acquire immune-stimulating and tumor killing activity capable of rejecting established tumors in combination with radiotherapy

Padmini Jayaraman et al. Oncoimmunology. .

Abstract

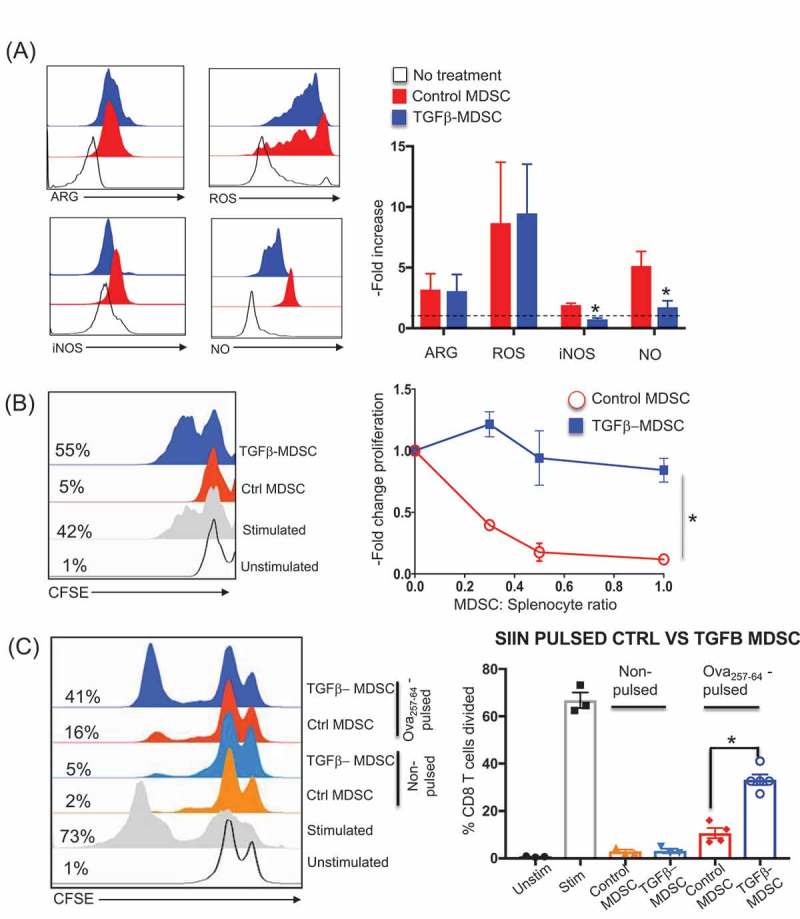
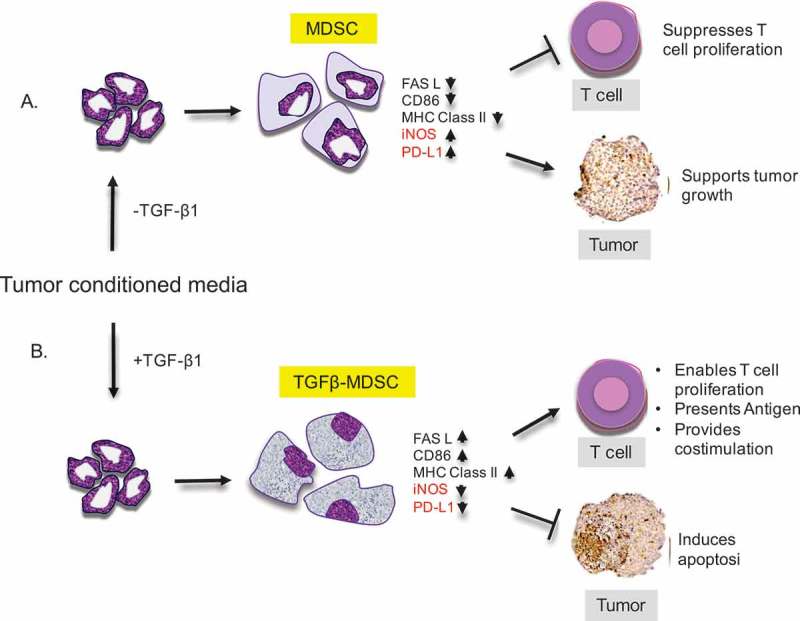
Cancer-induced myeloid-derived suppressor cells (MDSC) play an important role in tumor immune evasion. MDSC programming or polarization has been proposed as a strategy for leveraging the developmental plasticity of myeloid cells to reverse MDSC immune suppressive functions, or cause them to acquire anti-tumor activity. While MDSC derived ex vivo from murine bone marrow precursor cells with tumor-conditioned medium efficiently suppressed T cell proliferation, MDSC derived from conditioned medium in presence of TGF-β1 (TGFβ-MDSC) acquired a novel immune-stimulatory phenotype, losing the ability to inhibit T cell proliferation and acquiring enhanced antigen-presenting capability. Altered immune function was associated with SMAD-2 dependent upregulation of maturation and costimulatory molecules, and downregulation of inducible nitric oxide synthase (iNOS), an effector mechanism of immunosuppression. TGFβ-MDSC also upregulated FAS-ligand expression, leading to FAS-dependent killing of murine human papillomavirus (HPV)-associated head and neck cancer cells and tumor spheroids in vitro and anti-tumor activity in vivo. Radiation upregulated FAS expression on tumor cells, and the combination of radiotherapy and intratumoral injection of TGFβ-MDSC strongly enhanced class I expression on tumor cells and induction of HPV E7 tetramer-positive CD8 + T cells, leading to clearance of established tumors and long-term survival. TGFβ-MDSC derived from human PBMC with tumor conditioned medium also lost immunosuppressive function and acquired tumor-killing activity. Thus, TGFβ1 mediated programming of nascent MDSC leads to a potent anti-tumor phenotype potentially suitable for adoptive immunotherapy.

Keywords: CD86; MDSC; SMAD2; TGF-beta; adoptive cellular therapy; caspase-3; myeloid-derived suppressor cells (written out); radiotherapy; tumor killing.


Figures

Figure 1.
Figure 1.
TGFβ-MDSC acquire more macrophage like phenotype and upregulate maturation markers. Naïve bone marrow cells cultured in medium only (no treatment) or bone marrow cells cultured with MEER tumor conditioned medium alone (Control) or in the presence of TGF-β1 (TGF-β1) were used to generate MDSC. After 5 days in culture MDSC were evaluated by flow cytometry or Giemsa staining. A) Representative flow cytometry plots showing percent of total MDSC (n = 16) along with their respective Giemsa images depicting morphology of CD11b+ cells B) Quantitation of different cellular fractions expressed as a stacked bar graph (n = 8–12/group). C-D) Protein lysates from control or TGF-β MDSC were profiled with Reverse Phase Protein Assay (RPPA). C) Principal Component analysis (PCA) of the RPPA data. x, y, and z axes represent three major principal components. Control MDSC samples are represented as red dots; TGFβ-MDSC samples as blue dots D) Heat map of proteins (n = 16) most differentially-expressed between control and TGFβ-MDSC (p-value < 0.05, fold change > 1.5 or < 0.8). E) Representative flow cytometric histogram overlay of p-SMAD2 expression of control and TGFβ-MDSC (top), and bar graph showing cumulative data from atleast 3 experiments. F) Representative flow cytometric histogram overlay (top) showing cell surface expression of MHC II, CD86, Flt-3 and Fas-L on MDSC generated from no treatment, control and TGF-β conditioned tumor medium with summary bar graph below showing mean fluorescence intensity (n = 5–9 per graph). G) Summary of MHC Class II, CD86 and Fas-L expression in TGFβ¯ MDSC generated in the presence or absence of 3 µM of SMAD-2 inhibitor, SB431542 (n = 12). Error bars indicate standard error of the mean (SEM). *p ≤ 0.05. Each graph summarizes data obtained from at least 3 experiments. Error bars indicate standard error of mean (SEM). *p ≤ 0.05, ** p ≤ 0.01
Figure 2.
Figure 2.
TGFβ-MDSC lose immunosuppressive function, promote T cell proliferation and present antigen. Control and TGFβ¯MDSC were isolated and screened for functional markers. A) Histogram overlay and corresponding bar graphs (normalized to no treatment) showing mean fluorescent intensity (MFI) of iNOS, Nitric oxide (NO), Reactive oxygen species (ROS), and Arginase (ARG) in MDSC from no treatment, control or TGFβ-MDSC (n = 9). Control or TGFβ-MDSC were then co-cultured at different ratios with CFSE labelled naïve splenocytes (activated with soluble anti-CD3 and anti-CD28 antibodies). After 72 hours, CFSE dilution profile of CD8 T cells were obtained by flow cytometry B) Representative CFSE plots for unstimulated; anti-CD3- and anti-CD28- stimulated splenocytes, plus control or TGFβ¯ MDSC (left). Relative proliferation of CD8 + T cells co-cultured with either control or TGFβ- MDSC normalized to T cells stimulated with anti-CD3 and anti-CD28 alone across various MDSC: splenocyte cell ratios (n = 6) (right). C) Representative histogram plot overlay showing CD8 T proliferation (expressed as a percentage of CD8 T cells that have divided) using CFSE dilution analysis, obtained with either non-pulsed or ova 257–64 pulsed control or TGFβ¯MDSC (left); bar graph depicts aggregate data (n = 4) Each graph summarizes data obtained from at least 3 experiments. Error bars indicate standard error of the mean (SEM). *p ≤ 0.05.
Figure 3.
Figure 3.
TGFβ¯MDSC-mediate tumor killing both ex vivo and in vivo. MEER tumor cells were co-cultured in vitro with control or TGF-β MDSC at a 1:1 ratio for 48 hours after which cell viability and tumor cytotoxicity were measured in tumor cells. A) Percent cytoxicity as measured by LDH release of MEER cancer cells co-cultured with control or TGFβ-MDSC (n = 9–10 per group). B) Percentage of annexin positive MEER tumor cells after 48 hours co-culture with control or TGFβ-MDSC (n = 9). C) Cumulative bar graph showing percentage of annexin positive (n = 6) tumor cells co-cultured with control or TGFβ¯ MDSC, at a 1:1 ratio, either in the presence of FAS-L neutralizing antibody or isotype control. D) Representative images of H&E or Ki-67 and Caspase-3 IHC in 3D spheroids co-cultured with control or TGFβ¯MDSC for 72h (left) along with quantification of Ki-67 and Caspase-3 levels (expressed as mean fluorescence) shown to the right (n = 10). Control or TGFβ¯MDSC were intratumorally injected on days 4, 8, and 12 following tumor cell inoculation alone or in combination with 30 Gy radiation delivered as 2 × 15 Gy doses to MEER tumors. E) Tumor growth curves (n = 9–10 mice per group). F) Representative H&E and IHC of Ki-67 and Caspase 3 in tumor sections at day 20 after tumor cell inoculation shown on top. Quantitation expressed as mean fluorescence below. Error bars indicate standard error of the mean (SEM). *p ≤ 0.05, ** p ≤ 0.01.
Figure 4.
Figure 4.
Intratumoral TGFβ-MDSC in combination with radiotherapy leads to durable tumor clearance in vivo. A) Flow cytometry histogram overlay and corresponding MFI bar graph showing FAS expression in MEER tumor cells 48 hours after exposure to increasing doses of radiation (N = 2). B) Individual mouse tumor growth curves showing tumor size in mm2 for mice receiving no treatment (control), radiation alone (15 Gy x 2), radiation with intratumoral control MDSC (15 Gy x 2 + control MDSC), or radiation with intratumoral TGFβ-MDSC (15 x 2 + TGFβ-MDSC) (n = 8–10 mice per group). Each line represents tumor growth curve of an individual mouse. The individual graphs also show the ratio of surviving mice on day 60. The treatment schedule is depicted as a timeline above the graph C) Tumor growth curves depicting cumulative tumor sizes in mm2 from mice receiving no treatment or control, 15 Gy x 2 alone, 15 Gy x 2 + Control MDSC and 15 Gy x 2 + TGFβ-MDSC. D) Kaplan-Meier survival plots for each treatment group (n = 8–10 mice per group). Colored p-value symbols indicate the line to which the group was compared. Each experiment was performed at least 2 times. Error bars indicate standard error of mean (SEM). *p ≤ 0.05.
Figure 5.
Figure 5.
Intratumoral TGFβ-MDSC and radiotherapy activates the tumor immune microenvironment. 15 Gy external beam radiation was administered as a single dose directly to the MEER tumor in the left flank of mice on day 20 after initial tumor inoculum. This was followed by intratumoral administration of control or TGFβ¯MDSC on days 21 and 22. Tumor was harvested on day 24 and the tumor infiltrating leukocyte fraction (TIL) and TIL- free (tumor-containing) fractions were stained for E7 tetramers, and Caspase-3 and MHC Class I respectively A) Schematic representation of the treatment schedule. B-C) Representative histogram overlay and corresponding bar graph depicting MFI of B) Caspase-3/7 and C) MHC Class I (n = 6–8 mice per group). D) Representative FACS plots and corresponding bar graph depicting percentages of CD8 + T cells expressing E7 tetramer (n = 6–8 mice per group). Error bars indicate standard error of the mean (SEM). ***p ≤ 0.001, **** p ≤ 0.0001.
Figure 6.
Figure 6.
Human TGFβ¯MDSC lose ability to suppress T cell proliferation and acquire enhanced antigen presentation ability. Control or TGFβ¯MDSC were derived from human PBMCs by culture with SCC47 tumor conditioned medium ± TGF-β1 prior to functional characterization. A) Representative flow cytometry plot showing induction of CD11b+ CD33+ HLA-DRlow/- MDSC in the absence or presence of TGF-β1. B) Representative histogram and analysis of T cell proliferation (using anti-CD3/anti-CD28 + IL-2 stimulation) in the presence of control MDSC or TGFβ-MDSC across the indicated MDSC:T cell ratios (n = 5). Percentages indicate % of proliferating T cells. Cumulative analysis of fold change in T cell proliferation across various MDSC: CD3 T cell ratio is presented in the right panel. C) Representative CD3 T cell proliferation histogram overlay from unstimulated, CEF-pulsed, CEF-pulsed control or TGFβ-MDSC and non-pulsed control or TGFβ-MDSC along with corresponding bar graph showing-fold change of CD3 T cell proliferation from CEF pulsed control and TGFβ-MDSC groups (n = 8). D-F) Representative flow cytometry histogram and quantitative bar graph showing-fold MFI change in D) CD86 expression and E) PD-L1 expression in TGFβ-MDSC compared to control MDSC (n = 4). F) Changes in Annexin+ SCC47 cells following 48 hours co-culture with either control or TGFβ-MDSC. In all cases, -fold change is relative to the control MDSC condition (n = 5). *p ≤ 0.05, ** p ≤ 0.01.
Figure 7.
Figure 7.
Working Model. Myeloid precursor cells when A) co-cultured with tumor enriched conditioned medium in the absence of TGF-β1, give rise to conventional myeloid derived suppressor cells (MDSC) which have increased levels of iNOS and PD-L1. They suppress T cell proliferation and promote tumor growth. When precursor cells are co-cultured with B) tumor conditioned medium in the presence of TGF-β1, they give rise to a distinct population of MDSCs (TGFβ-MDSC) that are macrophage-like and have upregulated levels of FAS-L, CD86 and MHC Class II. They lose ability to suppress T cell proliferation, acquire enhanced T – cell stimulation activity, and mediate FAS-FAS-L driven apoptosis in tumor cells.

References

    1. Rosenberg SA. Decade in review—cancer immunotherapy: entering the mainstream of cancer treatment. Nat Rev Clin Oncol. Internet. 2014; 11: 630–632. Available from: http://www.nature.com/doifinder/10.1038/nrclinonc.2014.174 doi: 10.1038/nrclinonc.2014.174. - DOI - DOI - PMC - PubMed
    1. Topalian SL, Weiner GJ, Pardoll DM. Cancer immunotherapy comes of age. J Clin Oncol. Internet. 2011; 29: 4828–4836. Available from: http://jco.ascopubs.org/content/29/36/4828.short doi: 10.1200/JCO.2011.38.0899. - DOI - PMC - PubMed
    1. Vanneman M, Dranoff G. Combining immunotherapy and targeted therapies in cancer treatment. Nat Rev Cancer. Internet. 2012; 12: 237–251. Available from: http://www.nature.com/doifinder/10.1038/nrc3237 doi: 10.1038/nrc3237. - DOI - DOI - PMC - PubMed
    1. Vanneman M, Dranoff G. Combining immunotherapy and targeted therapies in cancer treatment. Nat Rev Cancer. Internet. 2012; 12: 237–251. Available from: doi: 10.1038/nrc3237. - DOI - PMC - PubMed
    1. Postow MA, Callahan MK, Wolchok JD. Immune Checkpoint Blockade in Cancer Therapy. J Clin Oncol. Internet. 2015; 33: JCO.2014.59.4358- Available from: http://jco.ascopubs.org/content/early/2015/01/20/JCO.2014.59.4358.full doi: 10.1200/JCO.2014.59.4358. - DOI - PMC - PubMed

Publication types