. 2019 Feb;13(2):153-170.
doi: 10.1002/1878-0261.12390. Epub 2018 Nov 28.

HMGA2 as a functional antagonist of PARP1 inhibitors in tumor cells

Affiliations

HMGA2 as a functional antagonist of PARP1 inhibitors in tumor cells

Sabine Hombach-Klonisch et al. Mol Oncol. 2019 Feb.

Abstract

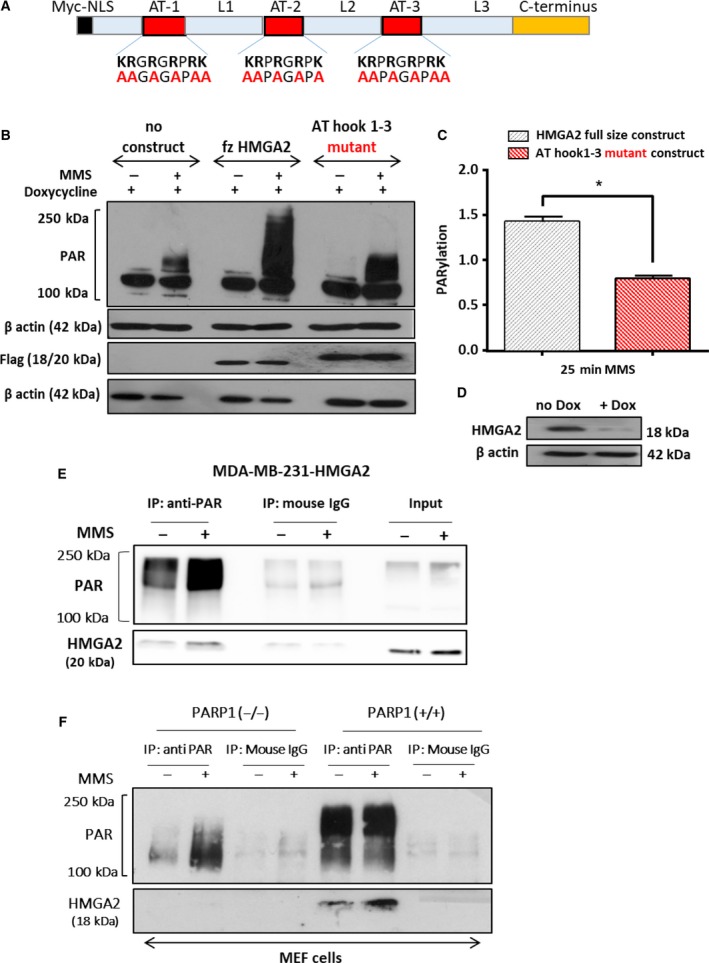
Poly(ADP-ribose) polymerase 1 inhibitors alone or in combination with DNA damaging agents are promising clinical drugs in the treatment of cancer. However, there is a need to understand the molecular mechanisms of resistance to PARP1 inhibitors. Expression of HMGA2 in cancer is associated with poor prognosis for patients. Here, we investigated the novel relationship between HMGA2 and PARP1 in DNA damage-induced PARP1 activity. We used human triple-negative breast cancer and fibrosarcoma cell lines to demonstrate that HMGA2 colocalizes and interacts with PARP1. High cellular HMGA2 levels correlated with increased DNA damage-induced PARP1 activity, which was dependent on functional DNA-binding AT-hook domains of HMGA2. HMGA2 inhibited PARP1 trapping to DNA and counteracted the cytotoxic effect of PARP inhibitors. Consequently, HMGA2 decreased caspase 3/7 induction and increased cell survival upon treatment with the alkylating methyl methanesulfonate alone or in combination with the PARP inhibitor AZD2281 (olaparib). HMGA2 increased mitochondrial oxygen consumption rate and spare respiratory capacity and increased NAMPT levels, suggesting metabolic support for enhanced PARP1 activity upon DNA damage. Our data showed that expression of HMGA2 in cancer cells reduces sensitivity to PARP inhibitors and suggests that targeting HMGA2 in combination with PARP inhibition may be a promising new therapeutic approach.

Keywords: HMGA2; PARP1; PARP1 trapping; PARylation; olaparib.


Figures

Figure 1
Figure 1
High‐mobility group A2 increases DNA damage‐induced PARP‐1 activity (PARylation) in TNBC and C1 fibrosarcoma cells. Western blot detection of PAR was performed in TNBC cells treated with 4 mm MMS at indicated times. (A) MDAMB‐231 cells showed later onset and decreased PARylation following siRNA‐mediated HMGA2 KD compared to cells with endogenous HMGA2. (C) Representative WB of nuclear lysates from MDAMB‐231 cells showing downregulation of HMGA2 upon siHMGA2 treatment compared to si‐scrambled. (D) MDAMB‐231 HMGA2 overexpressing cells treated with 4 mm MMS showed increased and early onset of PARylation compared to the mock controls. Note: The low levels of endogenous HMGA2 protein from total cell lysates in MDAMB‐231‐Mock cells are not detected in this WB (see Suppl. Fig. 1B for nuclear protein fractions). (F) Similarly, MDAMB‐436 cells with endogenous HMGA2 levels showed earlier and increased PARylation upon MMS treatment compared to MDAMB‐436 cells upon HMGA2 KD. (H) Representative WB showing HMGA2 KD upon siHMGA2 treatment in MDAMB‐436. (I) Representative WB blot for PAR detection in C1 cells upon treatment with olaparib (20 μm), MMS (4 mm), and doxycycline (Dox)‐mediated HMGA2 KD. PARP1 protein levels remained unchanged upon HMGA2 KD. (B, E, G, J) PAR detection was quantified by densitometry, normalized to the respective β‐actin signals, and presented as PARylation from n = 3 independent experiments. PAR levels of MMS‐treated C1 cells with low HMGA2 levels were set as 1. One‐way ANOVA and Tukey's multiple comparisons test were performed to determine significance. Data were shown as mean ± SEM; *< 0.05; **< 0.01.
Figure 2
Figure 2
High‐mobility group A2 decreases olaparib sensitivity in TNBC cells. MDAMB‐231 and MDAMB‐436 cells were treated with olaparib at concentrations ranging from 0.5 to 20 μm or to 200 μm. High cellular HMGA2 levels required increased olaparib concentrations to inhibit DNA damage‐induced PARylation activity. Representative WBs are shown for (A) MDAMB‐231 cells with siRNA‐mediated HMGA2 KD, (C). MDAMB‐231‐Mock and MDAMB‐231‐HMGA2 clones, and (E) MDAMB‐436 cells with siRNA‐mediated HMGA2 KD. Insets show downregulation of HMGA2 upon siHMGA2 compared to si‐scrambled by WB of total lysates from MDAMB‐231 cells and MDAMB‐436. (B, D, F) PAR was quantified by densitometry analysis from three independent experiments, normalized with corresponding actin controls, and presented in the graph as PARylation compared to MMS untreated (control) cells. One‐way ANOVA and Tukey's multiple comparisons test were performed to determine significance from n = 3 independent experiments. Data were shown as mean ± SEM. *< 0.05; **< 0.01; ***< 0.001, ****< 0.0001.
Figure 3
Figure 3
High‐mobility group A2 AT‐hook DNA‐binding domains are essential for HMGA2‐mediated increased PARP1 activity and HMGA2 is PARylated upon DNA damage. (A) Schematic presentation of the N‐terminal Myc nuclear localization domain and the HMGA2 AT‐hook domains with the position of alanine residues in the mutant construct. (B) Representative WB showing MMS induced PARylation in C1 cells after Dox mediated downregulation of endogenous HMGA2 and transient transfection of the wild‐type and AT1‐3 mutant HMGA2 constructs. Exogenous HMGA2 was detected with anti‐Flag antibody, and β‐actin served as protein loading control. (C) PAR was quantified by densitometry, normalized to corresponding actin and flag controls, and presented in the graph as PARylation. Data are shown as mean ± SEM. *P < 0.05 was considered significant by Student's t‐test from n = 3 independent experiments. (D) WB showing successful downregulation of endogenous HMGA2 upon Dox treatment. (E) MDAMB‐231 cells overexpressing HMGA2 were treated with MMS (4 mm) for 30 min, and total protein lysates were immunoprecipitated with an anti‐PAR antibody. PAR was increased following MMS treatment, and HMGA2 was co‐immunoprecipitated with PAR. (F) PARP1 wild‐type MEF (PARP1+/+) cells, but not PARP1‐KO MEFs (PARP1−/−), showed HMGA2 PARylation. Mouse IgG used as a control did not show any pull‐down of PAR or HMGA2.
Figure 4
Figure 4
High‐mobility group A2 colocalizes and interacts with PARP1. (A) Representative fluorescence images of single nuclei (C1 cells) are shown (DAPI‐nucleus; red‐PARP; green‐HMGA2). Cells were treated with 5 mm MMS for 15 min. (B) The average number of colocalized foci from a total of 30 nuclei per treatment group was quantified per experiment and graphed from three independent experiments (90 nuclei in total) with error bars representing the mean ± SEM; one‐way ANOVA and Tukey's multiple comparisons test were performed to determine significance; ***P < 0.001. (C) Representative fluorescence images of single nuclei (C1 cells) are shown (DAPI‐nucleus; red‐PLA foci). Cells were treated with 20 μm olaparib overnight and 5 mm MMS for 15 min. (D) The average number of PLA foci per nucleus from a total of 50 nuclei per treatment group was quantified per experiment and graphed from three independent experiments with error bars representing SEM. Primary antibody alone and PLA probe alone served as negative control for the assay (shown in Fig. S6). Data are shown as mean ± SEM. One‐way ANOVA and Tukey's multiple comparisons test were performed to determine significance; ****P < 0.0001, ***P < 0.001, **P < 0.01, *P < 0.05. Co‐IP was performed from nuclear protein extracts using rabbit anti‐HMGA2 and anti‐PARP1 antibodies or a rabbit IgG isotype control. Representative WBs from HMGA2 IPs are shown for the detection of HMGA2 and PARP1 from the input and the precipitated proteins (E) in fibrosarcoma cells (C1) with endogenous HMGA2 expression and (F) in MDAMB‐231 with endogenous and overexpressing levels of HMGA2. (G) C1 cells treated with olaparib (20 μm) for 24 h also showed pull‐down of PARP‐1 with HMGA2. Rabbit IgG controls did not show pull‐down of either protein. 20 μg of nuclear proteins was used as loading controls (input) in immunoblots. (H) Nuclear protein extracts from C1 cells were used for the reversed IP using PARP1 antibody and detection for HMGA2. (I) HMGA2 IP performed in the presence of 200 μg/mL ethidium bromide caused an attenuated PARP1 protein pull‐down.
Figure 5
Figure 5
High‐mobility group A2 prevents PARP1 trapping, increases cell viability, and reduces apoptosis following DNA damage and olaparib treatment. (A) Representative WB using chromatin‐bound and soluble (nucleoplasm) nuclear protein fractions of C1 cells to localize PARP1 protein after treatment with olaparib and MMS. C1 cells were cultured without (HMGA2high) or with Dox (HMGA2low) and exposed to olaparib and MMS as indicated. Histone H3 and topoisomerase‐I were detected to confirm equal protein loading for chromatin‐bound and soluble nuclear fractions, respectively. (B) Chromatin‐bound PARP1 was quantified by densitometry, normalized to the respective histone H3 signals, and presented relative to the values of chromatin‐bound PARP1 in untreated controls which were set as 1. Data were shown as mean ± SEM; one‐way ANOVA and Tukey's multiple comparisons test were performed to determine significance; *P < 0.05; **P < 0.01, ***P < 0.001. (C, E) MDAMB‐231 and (D, F) C1 cells were treated with olaparib (20 μm) for 24 h prior to MMS treatment (4 mm, 30 min), and cell viability was determined after 24 h by WST assay. (C) In MDAMB‐231 cells, MMS‐induced DNA damage reduced cell viability only with HMGA2 silencing and PARP inhibition aggravated this effect. (D) Similarly, in C1 cells HMGA2 silencing reduced cell viability following 4 mm MMS alone or combined MMS and olaparib (20 μm) treatment. (E) In MDAMB‐231 cells, MMS‐induced DNA damage only activated apoptosis when HMGA2 was silenced. PARP inhibition did not further increase caspase 3/7 activity. (F) Similarly, in C1 cells HMGA2 silencing was required to induce caspase 3/7 activity with 4 mm MMS alone or after combined MMS and olaparib (20 μm) treatment. Framed insets show representative WBs for siRNA‐mediated HMGA2 KD in MDAMB‐231 cells. The values obtained by colorimetric quantification in the untreated controls were set to 100%. Data are presented as % cell viability or % caspase 3/7 activity compared to MMS untreated cells. Data were shown as mean SEM ± from three independent experiments. One‐way ANOVA and Tukey's multiple comparisons test were performed *P < 0.05; **P < 0.01; ***P < 0.001.
Figure 6
Figure 6
High‐mobility group A2 KD decreases NAMPT protein levels and reduces the mitochondrial respiratory capacity. MDAMB‐231 and MDAMB‐436 cells were treated with scrambled siRNA or with siHMGA2. (A) Representative WB showing reduced NAMPT protein levels following siRNA‐mediated HMGA2 KD in both cell lines. (B) NAMPT protein levels were quantified by densitometry in relation to β‐actin, and the endogenous protein expression of NAMPT in MDAMB‐231 cells was set to 1 in the graph. C. Oxygen consumption rates (OCR) in MDAMB‐231 cells were measured in real time under baseline conditions and after injection of 1 μm oligomycin (A), 0.75 μm FCCP (B), and 1 μm rotenone plus antimycin (C) as indicated, using the Seahorse XF24 Extracellular Flux Analyzer. (D) Quantitative analysis revealed a reduced spare respiratory capacity under HMGA2 silencing. Data were shown as mean SEM ± from three independent experiments. One‐way ANOVA and Tukey's multiple comparisons test were performed; *P < 0.05; **P < 0.01.

References

    1. Altmeyer M, Messner S, Hassa PO, Fey M and Hottiger MO (2009) Molecular mechanism of poly(ADP‐ribosyl)ation by PARP1 and identification of lysine residues as ADP‐ribose acceptor sites. Nucleic Acids Res 37, 3723–3738. - PMC - PubMed
    1. Alvarez‐Gonzalez R and Althaus FR (1989) Poly(ADP‐ribose) catabolism in mammalian cells exposed to DNA‐damaging agents. Mutat Res 218, 67–74. - PubMed
    1. Bajrami I, Kigozi A, Van Weverwijk A, Brough R, Frankum J, Lord CJ and Ashworth A (2012) Synthetic lethality of PARP and NAMPT inhibition in triple‐negative breast cancer cells. EMBO Mol Med 4, 1087–1096. - PMC - PubMed
    1. Berlingieri MT, Manfioletti G, Santoro M, Bandiera A, Visconti R, Giancotti V and Fusco A (1995) Inhibition of HMGI‐C protein synthesis suppresses retrovirally induced neoplastic transformation of rat thyroid cells. Mol Cell Biol 15, 1545–1553. - PMC - PubMed
    1. Bouchard VJ, Rouleau M and Poirier GG (2003) PARP‐1, a determinant of cell survival in response to DNA damage. Exp Hematol 31, 446–454. - PubMed

MeSH terms