. 2019 Feb;24(1):28-40.
doi: 10.1177/2472630318803749. Epub 2018 Oct 5.

Mutation Profiles in Glioblastoma 3D Oncospheres Modulate Drug Efficacy

Affiliations

Mutation Profiles in Glioblastoma 3D Oncospheres Modulate Drug Efficacy

Kelli M Wilson et al. SLAS Technol. 2019 Feb.

Abstract

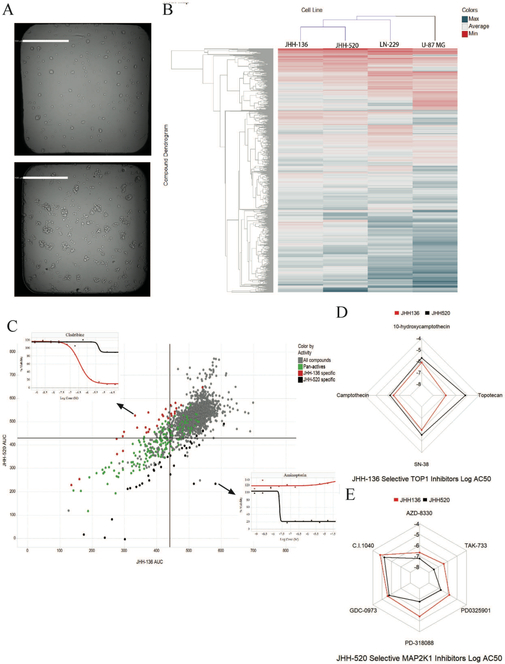
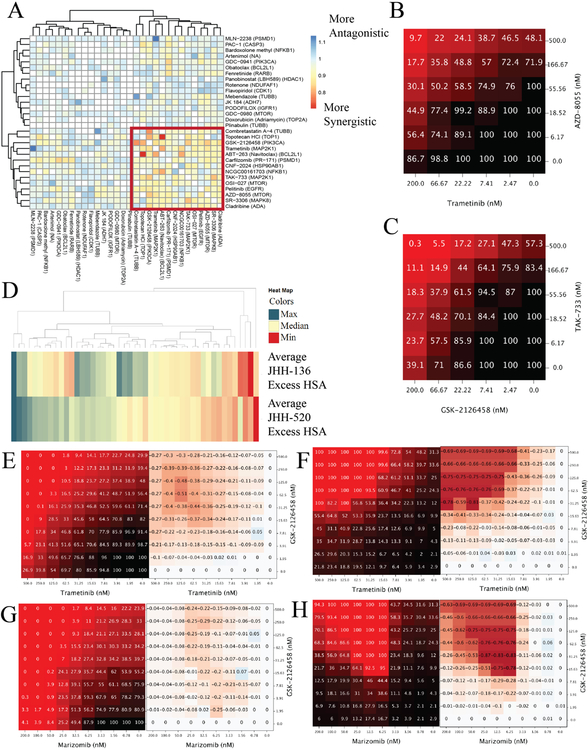
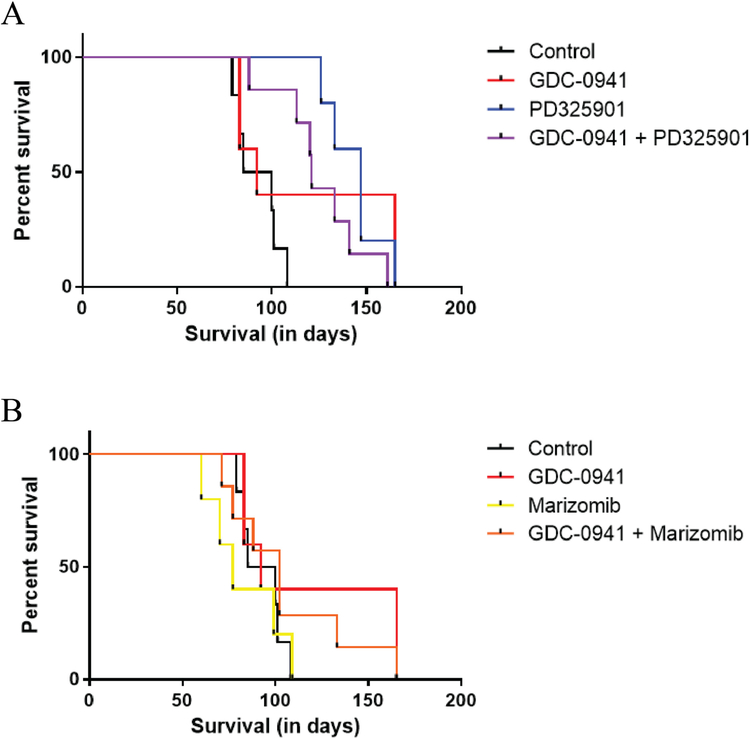
Glioblastoma (GBM) is a lethal brain cancer with a median survival time of approximately 15 months following treatment. Common in vitro GBM models for drug screening are adherent and do not recapitulate the features of human GBM in vivo. Here we report the genomic characterization of nine patient-derived, spheroid GBM cell lines that recapitulate human GBM characteristics in orthotopic xenograft models. Genomic sequencing revealed that the spheroid lines contain alterations in GBM driver genes such as PTEN, CDKN2A, and NF1. Two spheroid cell lines, JHH-136 and JHH-520, were utilized in a high-throughput drug screen for cell viability using a 1912-member compound library. Drug mechanisms that were cytotoxic in both cell lines were Hsp90 and proteasome inhibitors. JHH-136 was uniquely sensitive to topoisomerase 1 inhibitors, while JHH-520 was uniquely sensitive to Mek inhibitors. Drug combination screening revealed that PI3 kinase inhibitors combined with Mek or proteasome inhibitors were synergistic. However, animal studies to test these drug combinations in vivo revealed that Mek inhibition alone was superior to the combination treatments. These data show that these GBM spheroid lines are amenable to high-throughput drug screening and that this dataset may deliver promising therapeutic leads for future GBM preclinical studies.

Keywords: drug combination screening; glioblastoma; high-throughput screening; spheroid.


Figures

Figure 1.
Figure 1.
Protein expression profiling of PTEN and NF1 in oncosphere cell lines A. Western blot of PTEN protein for eight oncosphere cell lines. Beta-actin was used as a loading control. B. Western blot of NF1 protein for eight oncosphere cell lines. Beta-actin was used as a loading control. C. Bar graph showing the quantitated intensity of dots on the phospho-kinase antibody array. Black bars are for JHH-136 and red is for JHH-520. Dot intensity was normalized to positive and negative controls included on each array. Only proteins that were significantly different between each cell line (p < 0.01) are shown here. Full dataset and array images are in Supplemental Figure 1.
Figure 2.
Figure 2.
Single agent screening data for JHH-136 and JHH-520 A. A representative brightfield image of JHH-136 (top image) and JHH-520 (bottom image) spheroid cells in 1536 well plates 48 hours after plating. Scale bars in white are 500 µm in length. B. Heatmap of compound AUC values in JHH-136, JHH-520, LN-229 and U-87MG with unbiased hierarchical clustering by compound and cell line. Color gradient is by AUC value with potent compounds in red and inactive compounds in blue. C. Scatterplot of AUC values for each compound in JHH-136 on the x axis vs JHH-520 on the y axis. Each circle on the plot is one compound. Circles in green are active in both cell lines (pan-active), dots in red are active only in JHH-136 and dots in black are active only in JHH-520 and gray dots are the remaining compounds. Inset dose response curves are for the compounds that were highly selective for a single cell line. Cladribine was for JHH-136 and Aminopterin was for JHH-520. D. Radar plot for Topo1 inhibitors which were enriched in the JHH-136 specific active compound list. Each point on the plot represents the Log AC50 value for that compound with each dot connected by a line. Red lines are for JHH-136 and black lines are for JHH-520. E. Radar plot for MAP2K inhibitors which were enriched in the JHH-520 specific active compound list. Each point on the plot represents the Log AC50 value for that compound with each dot connected by a line. Red lines are for JHH-136 and black lines are for JHH-520.
Figure 3.
Figure 3.
Drug combination screening data A. Heatmap of gamma synergy values for each compound in combination with all others tested in the 6x6 matrix screen. Color gradient is from red to blue with red being most synergistic and blue being most antagonistic. Unbiased hierarchical clustering of gamma synergy revealed a highly synergistic cluster of compounds, highlighted by the red box. B. Heatmap of cell viability values of Trametinib, a MEK inhibitor, in combination with AZD-8055, an mTOR inhibitor. Values shown on the x and y axis is the concentration of compound in that row or column in nanomolar. Values shown inside the grid are % viability and color gradient is from black to red with black being 100% viability and red being 0% viability. C. Heatmap of cell viability of TAK-733, a MEK inhibitor, in combination with GSK-2126458, a PI3 Kinase/mTOR inhibitor. Values shown on the x and y axis is the concentration of compound in that row or column in nanomolar. Values shown are % viability and color gradient is from black to red with black being 100% viability and red being 0% viability. D. Heatmap of Excess HSA synergy value for 47 combinations in each neurosphere cell line. Color gradient is from red to blue with red being most synergistic and blue being most antagonistic. E. Heatmap of cell viability values of GSK-2126458 in combination with Trametinib in the JHH-136 cell line. Values shown on the x and y axis is the concentration of compound in that row or column in nanomolar. Values in left heatmap are % viable cells and values in right heatmap are calculated delta HSA synergy values. F. Heatmap of 8 hour apoptosis induction of GSK-2126458 in combination with Trametinib in the JHH-136 cell line. Values shown on the x and y axis is the concentration of compound in that row or column in nanomolar. Values in left heatmap are % apoptotic cells and values in right heatmap are calculated delta HSA synergy values. G. Heatmap of cell viability GSK-2126458 in combination with Marizomib in the JHH-520 cell line. Values shown on the x and y axis is the concentration of compound in that row or column in nanomolar. Values in left heatmap are % viable cells and values in right heatmap are calculated delta HSA synergy values. H. Heatmap 8 hour apoptosis induction of GSK-2126458 in combination with Marizomib in the JHH-520 cell line. Values shown on the x and y axis is the concentration of compound in that row or column in nanomolar. Values in left heatmap are % apoptotic cells and values in right heatmap are calculated delta HSA synergy values.
Figure 4 –
Figure 4 –
Orthotopic xenograft drug combination survival data A. Kaplan-Meier curves showing animal survival for control, GDC-0941 alone, PD0325901 alone and GDC-0941 plus PD0325901 combination groups. B. Kaplan-Meier curves showing animal survival for control, GDC-0941 alone, Marizomib alone and GDC-0941 plus Marizomib combination groups.

References

    1. Nabors LB; Portnow J; Ammirati M; et al. Central Nervous System Cancers, Version 1.2015. J Natl Compr Canc Netw 2015, 13, 1191–202. - PubMed
    1. Gallia GL; Brem S; Brem H. Local treatment of malignant brain tumors using implantable chemotherapeutic polymers. J Natl Compr Canc Netw 2005, 3, 721–8. - PubMed
    1. Lai A; Tran A; Nghiemphu PL; et al. Phase II study of bevacizumab plus temozolomide during and after radiation therapy for patients with newly diagnosed glioblastoma multiforme. J Clin Oncol 2011, 29, 142–8. - PMC - PubMed
    1. Stupp R; Mason WP; van den Bent MJ; et al. Radiotherapy plus concomitant and adjuvant temozolomide for glioblastoma. N Engl J Med 2005, 352, 987–96. - PubMed
    1. Walker MD; Green SB; Byar DP; et al. Randomized comparisons of radiotherapy and nitrosoureas for the treatment of malignant glioma after surgery. N Engl J Med 1980, 303, 1323–9. - PubMed

Publication types

MeSH terms

Substances

LinkOut - more resources