Review
. 2018 Oct;27(5):319-333.
doi: 10.1097/RMR.0000000000000177.

Magnetic Resonance Elastography of Liver: Current Update

Affiliations
Review

Magnetic Resonance Elastography of Liver: Current Update

Safa Hoodeshenas et al. Top Magn Reson Imaging. 2018 Oct.

Abstract

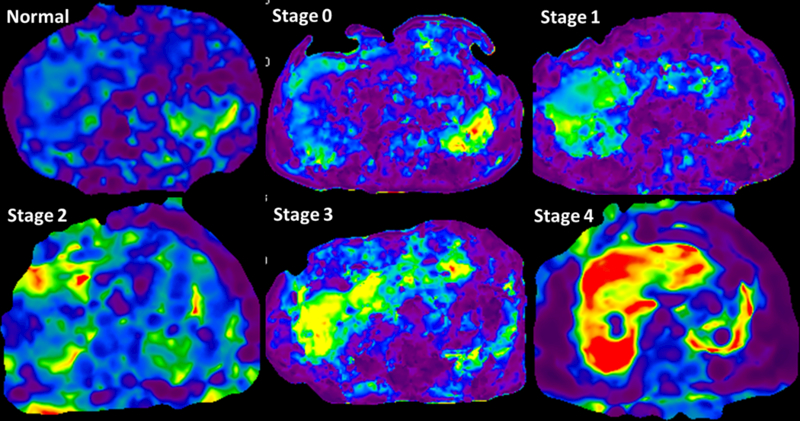
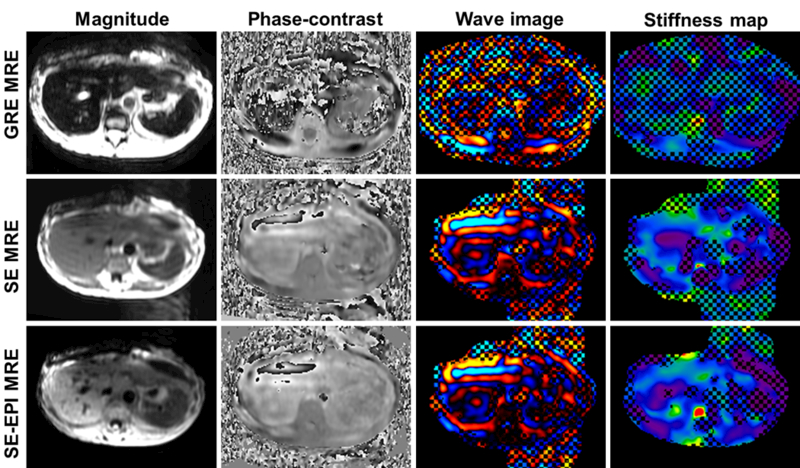
The first clinical application of magnetic resonance elastography (MRE) was in the evaluation of chronic liver disease (CLD) for detection and staging of liver fibrosis. In the past 10 years, MRE has been incorporated seamlessly into a standard magnetic resonance imaging (MRI) liver protocol worldwide. Liver MRE is a robust technique for evaluation of liver stiffness and is currently the most accurate noninvasive imaging technology for evaluation of liver fibrosis. Newer MRE sequences including spin-echo MRE and 3 dimensional MRE have helped in reducing the technical limitations of clinical liver MRE that is performed with 2D gradient recalled echo (GRE) MRE. Advances in MRE technology have led to understanding of newer mechanical parameters such as dispersion, attenuation, and viscoelasticity that may be useful in evaluating pathological processes in CLD and may prove useful in their management.This review article will describe the changes in CLD that cause an increase in stiffness followed by principle and technique of liver MRE. In the later part of the review, we will briefly discuss the advances in liver MRE.


Figures

Fig.1.
Fig.1.
MRE of liver set up. Note that active driver is placed outside the scanner and mechanical waves are conducted into the passive driver via a long plastic tube. The passive driver is placed at the level of xiphisternum and in right mid clavicular line as shown.
Fig.2.
Fig.2.
Two dimensional GRE MRE sequence for 1.5T scanner
Fig.3.
Fig.3.
Slice placement for MRE of liver. Coronal T2-weighted sequence used for positioning. The slices are placed evenly across the largest cross-section of the liver.
Fig.4.
Fig.4.
Liver MRE in a patient with NASH. Magnitude image (a) and phase image (b) are available for review immediately after acquisition of a slice. Note the signal loss in right upper quadrant subcutaneous fat (arrow) suggestive of shear waves at the passive driver (not show). Similarly the phase image show high phase shift occurring just below the driver due to intravoxel phase dispersion (white block arrow). Shear waves are seen within the liver, spleen and subcutaneous fat on the phase image. Wave image © showing the shear waves in color. Gray scale (d) and color scale ( e) stiffness maps (elastograms) and color stiffness map with overlayed confidence map (f) are automatically processed within 2 minutes of acquisition.
Fig.5.
Fig.5.
MRE stiffness maps showing increasing liver stiffness with increasing stages of fibrosis. The change in color from blue-violet in normal volunteer to orange red in stage 4 fibrosis can be readily appreciated. The mean LSM were 1.9kpa in normal, 2.8kPa in stage 0, 3.2kPa in stage 1, 3.6kPa in stage 2, 4.2 in stage 3 and 8.6kPa in stage 4 fibrosis.
Fig.6.
Fig.6.
Use of MRE in NAFLD. Three patients with NAFLD. Simple steatosis or isolated steatosis shows normal liver stiffness of 2.1kPa (a). Mildly elevated liver stiffness of 3.2kPa in a patient with NASH (b). Third patients with NASH and fibrosis with mean stiffness of 4.6kpa ©.
Fig.7.
Fig.7.
MRE in a patient with iron overload using the 2D-GRE MRE (top row), SE MRE (middle row) and the SE-EPI MRE techniques (bottom row). Magnitude, phase contrast, wave and stiffness maps from left to right. The low signal level within the liver resulted in noise-dominated phase images for the data obtained with GRE MRE. In contrast, both spin-echo sequences had significantly improved SNR and confidence level. The shear waves can be visualized in the phase-contrast images.The hepatic stiffnesses were 2.3 (±0.83) kPa for SE and 2.4 (±0.77) kPa for SE-EPI while the GRE data was considered a failure.
Fig.8.
Fig.8.
Photgraphs showing conventional hard disc passive driver (a) and flexible passive driver (b).
FIGURE 9.
FIGURE 9.
Liver stiffness, damping ratio and loss modulus in a healthy normal volunteer (column A) with BMI 21 and an obese patient (B) with BMI 32 and biopsy proven mild inflammation, no ballooning and no fibrosis. MRI showed fat signal fraction of 1.04% in the normal volunteer and 5.7% in obese individual, however liver biopsy showed no steatosis. The mean liver stiffness is borderline elevated (normal cut off is 2.5 kPa) in the obese individual, but damping ratio and loss modulus is significantly elevated and different from the normal healthy volunteer. Figure courtesey Dr. Jiahui Li, Mayo Clinic, Rochester, MN.

References

    1. Kim WR, Brown RS Jr., Terrault NA, El-Serag H. Burden of liver disease in the United States: summary of a workshop. Hepatology (Baltimore, Md) 2002;36(1):227–42. - PubMed
    1. Tsuchida T, Friedman SL. Mechanisms of hepatic stellate cell activation. Nature reviews Gastroenterology & hepatology 2017;14(7):397–411. - PubMed
    1. EASL clinical practice guidelines: Management of chronic hepatitis B virus infection. J Hepatol 2012;57(1):167–85. - PubMed
    1. Ghany MG, Nelson DR, Strader DB, Thomas DL, Seeff LB. An Update on Treatment of Genotype 1 Chronic Hepatitis C Virus Infection: 2011 Practice Guideline by the American Association for the Study of Liver Diseases. Hepatology (Baltimore, Md) 2011;54(4):1433–44. - PMC - PubMed
    1. Cadranel JF, Rufat P, Degos F. Practices of liver biopsy in France: results of a prospective nationwide survey. For the Group of Epidemiology of the French Association for the Study of the Liver (AFEF). Hepatology (Baltimore, Md) 2000;32(3):477–81. - PubMed