. 2018 Oct 5;13(10):e0204767.
doi: 10.1371/journal.pone.0204767. eCollection 2018.

Species identity matters when interpreting trophic markers in aquatic food webs

Affiliations

Species identity matters when interpreting trophic markers in aquatic food webs

Zachary S Feiner et al. PLoS One. .

Abstract

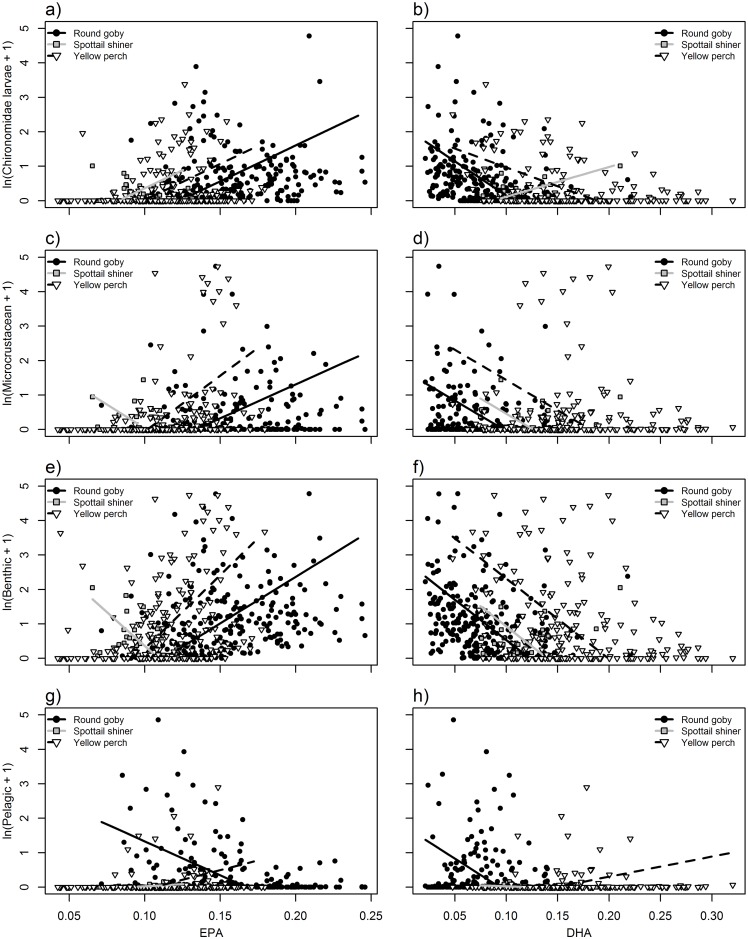
In aquatic systems, food web linkages are often assessed using diet contents, stable isotope ratios, and, increasingly, fatty acid composition of organisms. Some correlations between different trophic metrics are assumed to be well-supported; for example, particular stable isotope ratios and fatty acids seem to reflect reliance on benthic or pelagic energy pathways. However, understanding whether the assumed correlations between different trophic metrics are coherent and consistent across species represents a key step toward their effective use in food web studies. To assess links among trophic markers, we compared relationships between major diet components, fatty acids, and stable isotope ratios in three fishes: yellow perch (Perca flavescens), round goby (Neogobius melanostomus), and spottail shiner (Notropis hudsonius) collected from nearshore Lake Michigan. Yellow perch and spottail shiner are native in this system, while round goby are a relatively recent invader. We found some evidence for agreement between different trophic metrics, especially between diet components, n-3:n-6 fatty acid ratios, and stable isotope ratios (δ13C and δ15N). However, we also observed significant variation in observed relationships among markers and species, potentially due to taxonomic variation in the specific diet items consumed (e.g., chydorid microcrustaceans and Dreissena mussels) and species-specific biochemical processes. In many of these latter cases, the invasive species differed from the native species. Understanding the effects of taxonomic variation on prey and predator signatures could significantly improve the usefulness of fatty acids in food web studies, whereas diet contents and stable isotopes appear to be reliable indicators of trophic niche in aquatic food webs.


Conflict of interest statement

The authors have declared that no competing interests exist.

Figures

Fig 1
Fig 1. Relationships between δ13C values and natural log + 1-transformed biomass (mg) of diet content components a) Chironomidae larvae, b) microcrustaceans, c) benthic-derived resources, and d) pelagic-derived resources.
Points and lines represent individual fish and modeled relationships for round goby (black circles, solid black line), spottail shiner (gray boxes, gray line), and yellow perch (white triangles, dashed black line). Species-specific slopes were significantly different in each comparison, where round goby exhibited significant relationships in panels a, c, and d, but no other species exhibited significant relationships; see Table 3.
Fig 2
Fig 2. Relationships between EPA (20:5n-3; left column) or DHA (C22:6n-3; right column) and natural log + 1-transformed biomass (mg) of diet content components: Chironomidae larvae (a,b) microcrustaceans (c,d), benthic-derived resources (e,f), and pelagic-derived resources (g,h).
Points and lines represent individual fish and modeled relationships for round goby (black circles, solid black line), spottail shiner (gray boxes, gray line), and yellow perch (white triangles, dashed black line). See Table 4 for significance of slope and interaction terms.
Fig 3
Fig 3. Relationships between ARA (20:4n-6; panels a, b, c) or ALA (20:4n-6; d) and a) natural log + 1-transformed biomass (mg) of Chironomidae larvae, b) benthic-derived resources, c) microcrustaceans, and d) δ15N values.
Points and lines represent individual fish and modeled relationships for round goby (black circles, solid black line), spottail shiner (gray boxes, gray line), and yellow perch (white triangles, dashed black line). See Tables 4 and 5 for significance of slope and interaction terms.
Fig 4
Fig 4. Relationships between δ13C values (a,c) or δ15N values (b,d) and fatty acids EPA (20:5n-3, a,b) and DHA (22:6n-3, b,d).
Points and lines represent individual fish and modeled relationships for round goby (black circles, solid black line), spottail shiner (gray boxes, gray line), and yellow perch (white triangles, dashed black line). See Table 5 for significance of slope and interaction terms.
Fig 5
Fig 5. Relationships between n-3:n-6 ratios and natural log + 1-transformed diet item biomass (mg) a) microcrustaceans, b) benthic-derived resources, and c) pelagic-derived resources.
Points and lines represent individual fish and modeled relationships for round goby (black circles, solid black line), spottail shiner (gray boxes, gray line), and yellow perch (white triangles, dashed black line). See Table 4 for significance of slope and interaction terms.
Fig 6
Fig 6. Relationships between fatty acid principal component 1 (PC1) and natural log + 1-transformed diet item biomass (mg) of a) Chironomidae larvae, b) microcrustaceans, and c) benthic-derived resources.
Points and lines represent individual fish and modeled relationships for round goby (black circles, solid black line), spottail shiner (gray boxes, gray line), and yellow perch (white triangles, dashed black line). See Table 6 for significance of slope and interaction terms.
Fig 7
Fig 7. Relationships between fatty acid principal components 2 or 3 (PC2: Panels a, b; PC3: Panel c) and natural log + 1-transformed diet item biomass (mg) of a) microcrustaceans, b) pelagic-derived resources, and c) Chironomidae larvae.
Points and lines represent individual fish and modeled relationships for round goby (black circles, solid black line), spottail shiner (gray boxes, gray line), and yellow perch (white triangles, dashed black line). See Table 6 for significance of slope and interaction terms.
Fig 8
Fig 8. Relationships between fatty acid principal components 1 or 2 (PC1: Panel a; PC2: Panel b,c) and δ13C (a,b) and δ15N (c).
Points and lines represent individual fish and modeled relationships for round goby (black circles, solid black line), spottail shiner (gray boxes, gray line), and yellow perch (white triangles, dashed black line). See Table 6 for significance of slope and interaction terms.

References

    1. West JM, Williams GD, Madon SP, Zedler JB. Integrating spatial and temporal variability into the analysis of fish food web linkages in Tijuana Estuary. Environ Biol Fishes. 2003;67: 297–309. 10.1023/A:1025843300415 - DOI
    1. McMeans BC, McCann KS, Tunney TD, Fisk AT, Muir AM, Lester N, et al. The adaptive capacity of lake food webs: from individuals to ecosystems. Ecol Monogr. 2016;86: 4–19. 10.1890/15-0288.1 - DOI
    1. Nakano S, Miyasaka H, Kuhara N. Terrestrial–aquatic linkages: riparian arthropod inputs alter trophic cascades in a stream food web. Ecology. 1999;80: 2435–2441. 10.1890/0012-9658(1999)080[2435:TALRAI]2.0.CO;2 - DOI
    1. Gu B, Schelske CL, Hoyer MV. Stable isotopes of carbon and nitrogen as indicators of diet and trophic structure of the fish community in a shallow hypereutrophic lake. J Fish Biol. 1996;49: 1233–1243. 10.1111/j.1095-8649.1996.tb01792.x - DOI
    1. Post DM. Using stable isotopes to estimate trophic position: models, methods, and assumptions. Ecology. 2002;83: 703–718. 10.1890/0012-9658(2002)083[0703:USITET]2.0.CO;2 - DOI

Publication types