. 2019 Mar;60(3):335-345.
doi: 10.1165/rcmb.2018-0122OC.

Myeloid TBK1 Signaling Contributes to the Immune Response to Influenza

Affiliations

Myeloid TBK1 Signaling Contributes to the Immune Response to Influenza

Robert S Hagan et al. Am J Respir Cell Mol Biol. 2019 Mar.

Abstract

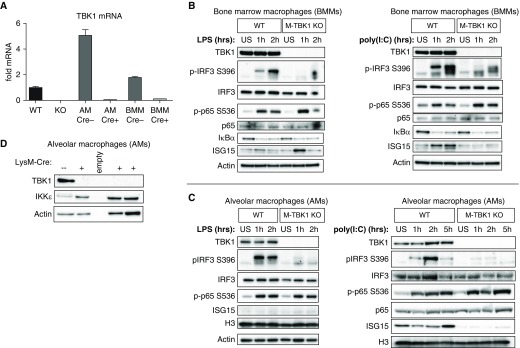
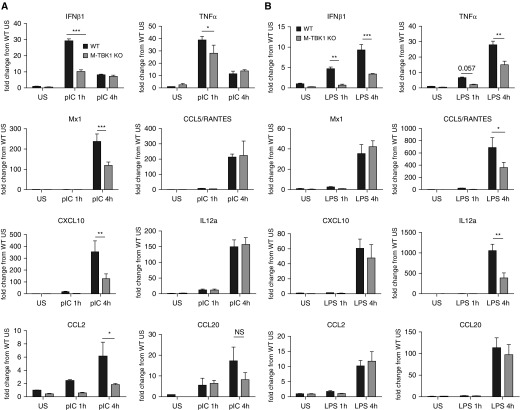
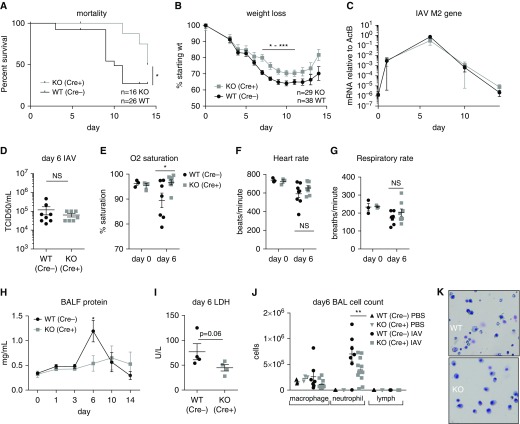
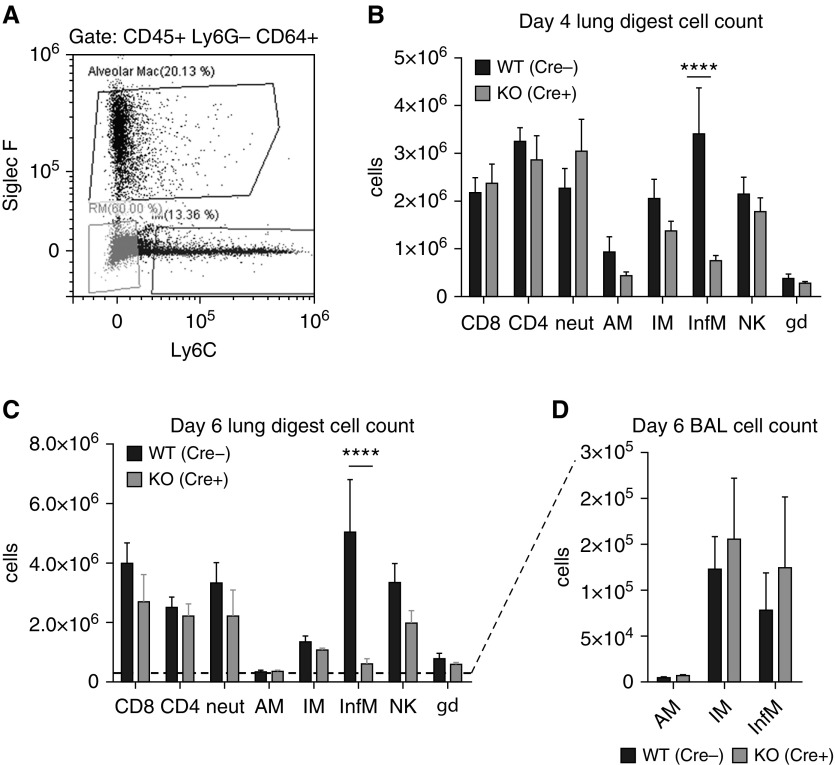
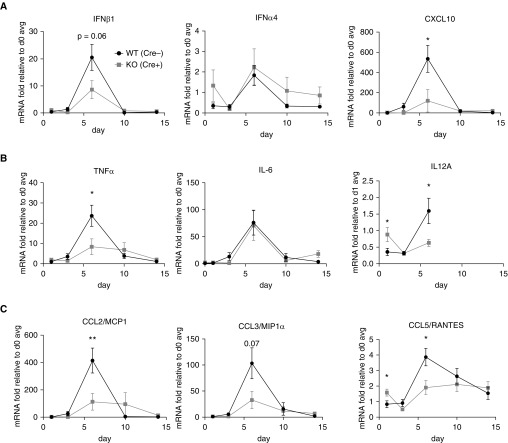
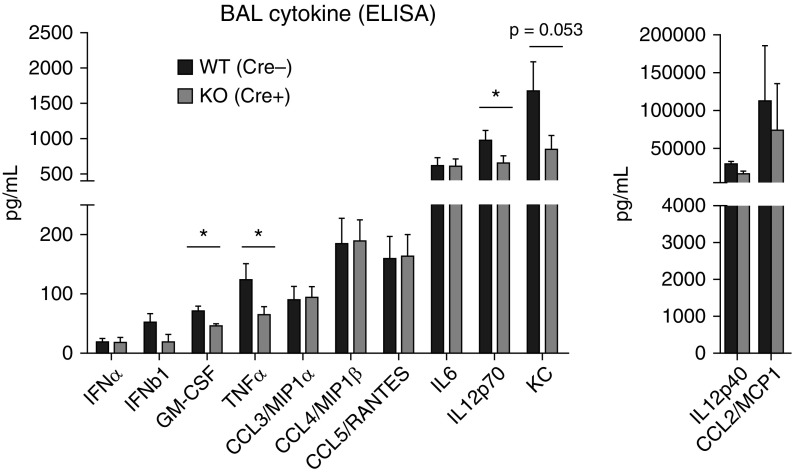
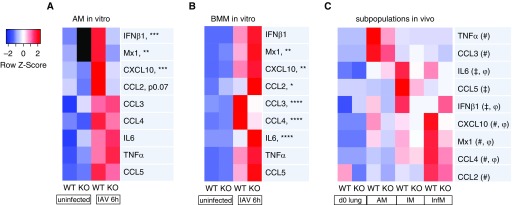
Macrophages provide key elements of the host response to influenza A virus (IAV) infection, including expression of type I IFN and inflammatory cytokines and chemokines. TBK1 (TNF receptor-associated factor family member-associated NF-κB activator-binding kinase 1) contributes to IFN expression and antiviral responses in some cell types, but its role in the innate response to IAV in vivo is unknown. We hypothesized that macrophage TBK1 contributes to both IFN and non-IFN components of host defense and IAV pathology. We generated myeloid-conditional TBK1 knockout mice and assessed the in vitro and in vivo consequences of IAV infection. Myeloid-specific loss of TBK1 in vivo resulted in less severe host response to IAV, as assessed by decreased mortality, weight loss, and hypoxia and less inflammatory changes in BAL fluid relative to wild-type mice despite no differences in viral load. Mice lacking myeloid TBK1 showed less recruitment of CD64+SiglecF-Ly6Chi inflammatory macrophages, less expression of inflammatory cytokines in the BAL fluid, and less expression of both IFN regulatory factor and NF-κB target genes in the lung. Analysis of sorted alveolar macrophages, inflammatory macrophages, and lung interstitial macrophages revealed that each subpopulation requires TBK1 for distinct components of the response to IAV infection. Our findings define roles for myeloid TBK1 in IAV-induced lung inflammation apart from IFN type I expression and point to myeloid TBK1 as a central and cell type-specific regulator of virus-induced lung damage.

Keywords: IFN; TBK1; cytokine; influenza; macrophage.


Figures

Figure 1.
Figure 1.
Myeloid-specific deletion of TNF receptor–associated factor family member–associated NF-κB activator–binding kinase 1 (TBK1) impairs IFN regulatory factor 3 (IRF3) phosphorylation in macrophages. (A) RT-qPCR of TBK1 mRNA from mouse embryonic fibroblasts, bone marrow macrophages (BMMs), and BAL macrophages. Error bars represent technical triplicates, and data are representative of two independent experiments. (B) Immunoblots of BMMs from wild-type (WT; LysM-Cre, TBK1flox/flox) or TBK1-knockout (M-TBK1-KO; LysM-Cre+, TBK1flox/flox) mice stimulated in vitro with 100 ng/ml LPS or 25 μg/ml polyinosinic:polycytidylic acid [poly(I:C)] for the indicated times. (C) Immunoblots of alveolar macrophages from WT or M-TBK1-KO mice stimulated in vitro with the same concentrations of LPS or poly(I:C). (D) Immunoblots of alveolar macrophages from WT or multiple M-TBK1-KO mice. Immunoblots are representative of at least two independent experiments. AM = alveolar macrophage; H3 = histone H3; ISG15 = IFN-stimulated gene 15; US = unstimulated.
Figure 2.
Figure 2.
Myeloid deletion of TBK1 impairs expression of IRF and NF-κB target genes. RT-qPCR was used to assess mRNA of indicated genes from BMMs stimulated with (A) LPS or (B) polyinosinic:polycytidylic acid (pIC) for the indicated times. Data are normalized to the 18S mRNA, expressed as fold change compared with uninfected WT mice by comparative cycle threshold method, and compared by two-tailed unpaired t test. n = 3 per group and least two independent experiments. *P < 0.05, **P < 0.01, and ***P < 0.005. NS = not significant; RANTES = regulated upon activation, normal T cell expressed and secreted.
Figure 3.
Figure 3.
M-TBK1 KO mice have a less severe host response to influenza than WT mice. (A) Survival and (B) weight curves for mice infected intranasally with 5 × 104 egg-infective dose (tissue culture–infective dose [TCID50], 366) of influenza A virus (IAV) strain PR8. Mortality was assessed by Gehan-Breslow-Wilcoxon test and weight by two-way ANOVA with multiple comparisons (Šidák correction). (C) Viral infection level as measured by RT-qPCR of IAV M2 gene from lung homogenates at Days 1–14. (D) Viral infection level as measured by TCID50 from lung homogenates at Day 6. (E) Arterial oxygen saturation, (F) heart rate, and (G) respiratory rate at Days 0 and 6. n = 3–8 mice per group in two independent experiments. (H) BAL fluid (BALF) protein measurements from mice at Days 0–14 after infection. (I) Lactate dehydrogenase (LDH) measurements in BALF from mice at Day 6. (J) Leukocyte counts in BALF assessed using cell counts and cytospins on Day 6. (K) Representative cytospin images from BAL at Day 6. Panels HJ depict six to eight mice per group and two or three independent experiments. Panels DJ reflect analysis by two-tailed unpaired t test. *P < 0.05, **P < 0.01, and ***P < 0.005. ActB = β-actin; U = units.
Figure 4.
Figure 4.
M-TBK1-KO mice have fewer recruited inflammatory lung macrophages during influenza infection. Mice were infected intranasally with 5 × 104 egg-infective dose and lungs were harvested and digested to single-cell suspensions. (A) Representative flow cytometric plot from CD45+/Ly6G/CD64+ gate showing definition of resident alveolar (AM; Siglec F+/Ly6Clow), resident interstitial (IM; Siglec F/Ly6C), and recruited inflammatory (InfM; Siglec F/Ly6C+) macrophages. Total number of relevant cell populations identified by flow cytometry at (B) Day 4 and (C) Day 6 after infection. (D) Macrophage subpopulations recovered from BAL at Day 6 after infection. n = 6–8 mice per genotype per group and two independent experiments analyzed by Mann-Whitney U test. NK = natural killer cells. ****P < 0.001. gd = γδ.
Figure 5.
Figure 5.
M-TBK1-KO mice have less lung inflammatory gene expression. RT-qPCR of indicated mRNAs from lung homogenates. Commonly examined (A) IRF3 targets, (B) NF-κB targets, and (C) chemokines are shown. Lungs from intranasally infected mice were snap frozen, and mRNA and cDNA were prepared. Data are normalized to 18S mRNA and expressed as fold change compared with an average of Day 0 mice. n = 5–8 mice per point and two independent experiments analyzed by Mann-Whitney U test. *P < 0.05 and **P < 0.01. MCP1 = monocyte chemoattractant protein 1; MIP1α = macrophage inflammatory protein 1α.
Figure 6.
Figure 6.
M-TBK1-KO mice have less BAL cytokine expression. ELISA of indicated cytokines and chemokines from BAL fluid of infected mouse lungs harvested at Day 6 after infection. n = 3–8 mice per point and two separate experiments analyzed by Mann-Whitney U test. *P < 0.05. GM-CSF = granulocyte–macrophage colony–stimulating factor; KC = keratinocyte chemoattractant.
Figure 7.
Figure 7.
TBK1 deletion impairs BMM and AM transcriptional responses differently during influenza virus infection in vitro and has subtype-specific effects on lung macrophages in vivo. RT-qPCR of (A) AMs or (B) BMMs infected with multiplicity of infection 1 of IAV strain PR8 in vitro for 6 hours. Data were normalized to the 18S mRNA and expressed as fold change compared with uninfected WT by the comparative cycle threshold method. Heatmap depicts z-score of mRNA transcript expression level scaled to row mean. n = 3 per group and two independent experiments. Asterisks depict significance of P values for infected WT versus TBK1-KO samples (*P < 0.05, **P < 0.01, ***P < 0.005, and ****P < 0.001). More detailed graphs for each gene are shown in Figure E6 in the data supplement. (C) Macrophage subpopulations were isolated from lung digests using FACS at Day 4 after infection and subjected to RT-qPCR of indicated genes. mRNA levels were normalized to ActB or to 18S by the comparative cycle threshold method. Data reflect three pooled mice analyzed in technical triplicate. All rows attain statistical significance by two-way ANOVA. Symbols depict significance (P < 0.05) by Šidák’s multiple comparisons method between WT and KO for AMs#, IMs, or InfMsφ. Detailed graphs for each gene are shown in Figure E7.

Comment in

  • TANKing Influenza A Virus in the Lung.
    Rosli S, Tate MD. Rosli S, et al. Am J Respir Cell Mol Biol. 2019 Mar;60(3):255-256. doi: 10.1165/rcmb.2018-0337ED. Am J Respir Cell Mol Biol. 2019. PMID: 30365353 No abstract available.

References

    1. Hsu J, Santesso N, Mustafa R, Brozek J, Chen YL, Hopkins JP, et al. Antivirals for treatment of influenza: a systematic review and meta-analysis of observational studies. Ann Intern Med. 2012;156:512–524. - PMC - PubMed
    1. Aevermann BD, Pickett BE, Kumar S, Klem EB, Agnihothram S, Askovich PS, et al. A comprehensive collection of systems biology data characterizing the host response to viral infection. Sci Data. 2014;1:140033. - PMC - PubMed
    1. Brandes M, Klauschen F, Kuchen S, Germain RN. A systems analysis identifies a feedforward inflammatory circuit leading to lethal influenza infection. Cell. 2013;154:197–212. - PMC - PubMed
    1. Misharin AV, Morales-Nebreda L, Mutlu GM, Budinger GR, Perlman H. Flow cytometric analysis of macrophages and dendritic cell subsets in the mouse lung. Am J Respir Cell Mol Biol. 2013;49:503–510. - PMC - PubMed
    1. Misharin AV, Morales-Nebreda L, Reyfman PA, Cuda CM, Walter JM, McQuattie-Pimentel AC, et al. Monocyte-derived alveolar macrophages drive lung fibrosis and persist in the lung over the life span. J Exp Med. 2017;214:2387–2404. - PMC - PubMed

Publication types