. 2018 Oct 4;23(4):586-598.e8.
doi: 10.1016/j.stem.2018.09.009.

Single-Cell Transcriptomic Analysis of Cardiac Differentiation from Human PSCs Reveals HOPX-Dependent Cardiomyocyte Maturation

Affiliations

Single-Cell Transcriptomic Analysis of Cardiac Differentiation from Human PSCs Reveals HOPX-Dependent Cardiomyocyte Maturation

Clayton E Friedman et al. Cell Stem Cell. .

Abstract

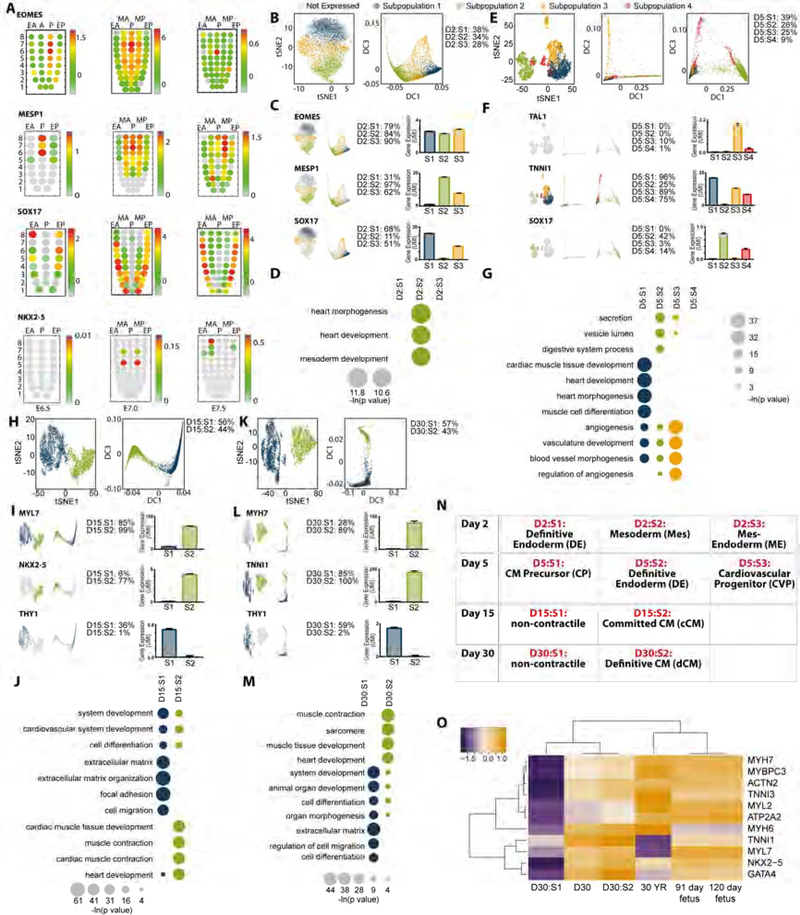
Cardiac differentiation of human pluripotent stem cells (hPSCs) requires orchestration of dynamic gene regulatory networks during stepwise fate transitions but often generates immature cell types that do not fully recapitulate properties of their adult counterparts, suggesting incomplete activation of key transcriptional networks. We performed extensive single-cell transcriptomic analyses to map fate choices and gene expression programs during cardiac differentiation of hPSCs and identified strategies to improve in vitro cardiomyocyte differentiation. Utilizing genetic gain- and loss-of-function approaches, we found that hypertrophic signaling is not effectively activated during monolayer-based cardiac differentiation, thereby preventing expression of HOPX and its activation of downstream genes that govern late stages of cardiomyocyte maturation. This study therefore provides a key transcriptional roadmap of in vitro cardiac differentiation at single-cell resolution, revealing fundamental mechanisms underlying heart development and differentiation of hPSC-derived cardiomyocytes.

Keywords: CRISPRi; HOPX; cardiomyocytes; development; heart; human pluripotent stem cells; hypertrophy; in silico lineage tracing; scdiff; single-cell RNA-seq.


Figures

Figure 1.
Figure 1.. Single Cell Analysis of Cardiac Directed Differentiation
(A) Schematic of protocol for small molecule directed differentiation from pluripotency into the cardiac lineage. hPSC: human pluripotent stem cell; GLS: germ layer specification; PC: progenitor cell: cCD: committed cardiac derivative; dCD: definitive cardiac derivative. (B) Single cells (n = 43,168 in total) transiting cardiac differentiation beginning at pluripotency (day 0) and transitioning through mesoderm (day 2) into progenitor (day 5) committed (day 15) and definitive (day 30) cardiac derivatives. Data are presented using t-SNE plot, pseudospacing cells by the nonlinear transformation of similarity in gene expression to preserve the local and global distance of cells in multidimensional space when embedded into two dimensional t-SNE space (left), and diffusion plot, pseudospacing cells in a trajectory based on diffusion distance (transition probability) between two cells (right). (C) Mean gene expression across all cells at individual time points showing proper temporal expression of stage-specific genes governing differentiation into the cardiac lineage. Shown are pluripotency genes (DNMT3B, POU5F1, NANOG), mes-endoderm genes (EOMES, MIXL1, T, MESP1), and genes governing cardiomyocyte differentiation including signaling regulators (TMEM88), transcription factors (ISL1, HAND1, NKX2–5, TBX5, GATA4), calcium handling genes (ATP2A2, PLN) and sarcomere genes (TNNI1, MYH6, MYH7, MYL7). Data are represented as mean ± SEM. (D) Diffusion plots showing pseudospacing at single cell resolution for gene expression of stage-specific genes during differentiation based on known genetic regulators of cardiac fate specification including POU5F1 (day 0), EOMES (day 2), TMEM88 (day 5), TNNI1 (day 15), and TTN (day 30). Cells are colored in a binary manner. If the cell expresses the gene it is colored according to the day of isolation (0, 2, 5, 15, or 30). Non-expressing cells are shaded gray. (E) Representation of unsupervised clustering analysis (Nguyen et al., in review) using t-SNE plots to show single cell level expression of stage-specific gene expression at each day of differentiation based on known genetic regulators of cardiac fate specification including POU5F1, EOMES, ISL1, TNNI1, and MYL7. If the cell expresses the gene it is colored according to subpopulation 1–4 in which the cell is associated. Non-expressing cells are shaded gray. Above each t-SNE plot, the percentage of cells expressing the gene in each subpopulation is shown together with the expression histogram and the reference t-SNE plot. UMI: unique molecular identifier.
Figure 2.
Figure 2.. Subpopulation Identification and Characterization
(A) Corn plots showing spatial domains of EOMES, MESP1, SOX17 and NKX2–5 expression in the mesoderm and endoderm of E6.5, E7.0, and E7.5 mouse embryos during gastrulation (unpublished RNA-seq data for E6.5 and E7.5 mouse embryos and published data for E7.0 mouse embryos (Peng et al., 2016)). Positions of the cell populations (“kernels” in the 2D plot of RNA-Seq data) in the germ layers: the proximal-distal location in descending numerical order (1 = most distal site) and in the transverse plane of the mesoderm and endoderm - Anterior half (EA) and Posterior half (EP) of the endoderm, Anterior half (MA) and Posterior half (MP) of the mesoderm, and Posterior epiblast (P) containing the primitive streak. (B-M) Below each gene name are shown the following data from left to right: t-SNE plot and diffusion plot of cells expressing each gene, percent of cells expressing gene, expression level of gene in each subpopulation. (B-D) Analysis of day 2 subpopulations represented by (B) reference t-SNE (left) and diffusion (right) plots and the percent of cells in each subpopulations (D2:S1-S3), (C) analysis of primitive streak genes EOMES (pan-mesendoderm transcription factor), MESP1 (cardiogenic mesoderm transcription factor), and SOX17 (definitive endoderm transcription factor). (D) Gene ontology analysis of differentially expressed genes showing enrichment for networks governing cardiac development enriched in subpopulation 2. (E-G) Analysis of day 5 progenitor subpopulations represented by (E) reference t-SNE (left) and diffusion (right) plots and the percent of cells in each subpopulations (D5:S1-S4), (F) analysis of progenitor genes TALI (endothelial fate transcription factor), TNNI1 (early development sarcomere isoform of TNNI), and SOX17 (definitive endoderm transcription factor). (G) Gene ontology analysis of differentially expressed genes showing enrichment for networks governing cardiac development (D5:S1), definitive endoderm (D5:S2), and endothelium (D5:S3). (H-J) Analysis of day 15 subpopulations represented by (H) reference t-SNE (left) and diffusion (right) plots and the percent of cells in each subpopulations (D15:S1-S2), (I) analysis of cardiac genes MYL7 (early development sarcomere isoform of MYL), NKX2–5 (cardiac transcription factor), and THY1 (fibroblast marker). (J) Gene ontology analysis of differentially expressed genes showing enrichment for networks governing extracellular matrix and cell motility (D15:S1) and cardiac development (D15:S2). (K-M) Analysis of day 30 subpopulations represented by (K) reference t-SNE (left) and diffusion (right) plots and the percent of cells in each subpopulations (D30:S1-S2), (L) analysis of cardiac genes TNNI1 (early development sarcomere isoform of TNNI), MYH7 (mature sarcomere isoform of MYH), and THY1 (fibroblast marker). (M) Gene ontology analysis of differentially expressed genes showing enrichment for networks governing system development and morphogenesis (D30:S1) and cardiac development (D30:S2). (N) Overall phenotypic determinations of subpopulation identity based on in vivo anchoring genes outlined through stage-specific transitions in differentiation. CM: cardiomyocyte. (O) Expression of cardiac genes in day 30 hPSC-derived cardiomyocytes relative to expression levels in human foetal and adult heart samples (ENCODE). Gene expression is measured as counts per million mapped reads and each gene is internally normalized to maximum expression. UMI: unique molecular identifier. See also Figure S1–3 and Table S1.
Figure 3.
Figure 3.. Transcription Factor Regulatory Networks Predict Developmental Fate Choices During Cardiac Differentiation
(A) Stepwise transitions into cardiac lineages from pluripotency predicted on the basis of gene regulatory networks (GRN) detected between pairwise changes in cell state during differentiation. Circles indicate distinct nodes governed by a common GRN. Since cells can be re-assigned based on the expression of their genes, the re-distribution of subpopulations established by clustering analysis and phenotyping as outlined in Figure 2 are represented as pie charts within each circle indicating the percent of cells from each subpopulation contributing to that node. Each node is numbered N1-N10 for reference. (B) Phenotypic identity of nodes reflecting stage-specific transitions in cell state through cardiac directed differentiation. (C) Analysis of transcription factors (TFs) and genes controlling stage-specific regulatory networks underlying cell fate transitions. Mean DE target fold change calculates the fold change for the differentially expressed targets of the TF. DE gene fold change shows up or down-regulated fold change of TF target genes. (D) Heat map comparing expression across all cells from day 5, 15, and 30 subpopulations for genes involved in progenitor specification, vascular endothelial development, outflow tract development, and primary heart field cardiomyocyte development. (E) Gene ontology analysis comparing day 30 S1 vs S2 showing gene networks involved in vascular development enriched in S1 vs cardiac muscle development enriched in S2. (F) t-SNE and diffusion plots for all cells from days 15 and 30 showing expression distribution of the cardiac gene MYH7 (high in S2 at day 15 and 30) relative to outflow tract development genes THY1, PITX2, and BMP4 (high in S1 at day 15 and 30) (G) The top most differentially expressed genes identified by in vivo single cell analysis comparing outflow tract (OFT) vs ventricular cardiomyocytes (Li et al., 2016) compared against their expression level in D30:S1 vs D30:S2 in vitro derived cardiac derivatives. (H) Differentially expressed genes between subpopulations D30:S1 and D30:S2 used to assess transcriptional similarity to in vivo cell types (Li et al., 2016; Quaife-Ryan et al., 2017) using Spearman’s correlation analysis. See also Figure S4 and Table S2.
Figure 4.
Figure 4.. HOPX is Rarely Expressed During in vitro Cardiac Directed Differentiation
(A) Analysis of HOPX expression in eleven subpopulations from day 2 to day 5 of differentiation showing expression as early as day 2 mesoderm and highest expression in day 5 endothelial cells (ECs) and day 30 cardiomyocytes (CMs) (B) Single cell expression analysis of HOPX at day 2, 5, 15, and 30. Data presented include t-SNE plots indicating distribution and localization of HOPX expressing cells in different subpopulations (bottom), the percentage of HOPX+ cells in each subpopulation (top left), bar graphs showing expression of HOPX in each subpopulation (top middle), and the reference t-SNE plot demarcating subpopulations (top right). Data are represented as mean ± SEM. (C) Analysis of known genetic regulators of heart development only in subpopulation 2 at day 30 of differentiation. (D) t-SNE plots of merged data sets from two continuous days for all cells between day 15–30 for each gene showing robust distribution of key cardiac regulatory genes with the exception of HOPX. (E) Corn plots showing the spatial domains of HOPX expression in the mesoderm and endoderm of E7.0 and E7.5 mouse embryos during gastrulation (unpublished RNA-seq data for E7.5 embryos and published data for E7.0 embryo, (Peng et al., 2016)) (Figure S1). (F) Single cell expression analysis of E9.5 mouse heart cells (Li et al., 2016) showing HOPX expression relative to markers of cardiomyocytes (MYH7, ACTN2) and endothelial cells (CDH5, PECAM1) (scale bars are Log2(RPM)). Table (right) shows percent of cardiac (MYH7), endothelial (PECAM1), and smooth muscle (TAGLN2) cells co-expressing HOPX in various regions of the developing mouse heart. UMI: unique molecular identifier. See also S4–5 and Table S4.
Figure 5.
Figure 5.. HOPX is a Key Regulator of Cardiomyocyte Hypertrophy
(A) Gene targeting strategy for conditional HOPX over-expression. Schematic shows design of conditionally expressed HOPX-NLS-eGFP construct. Below, western showing doxycycline induction of control (NLS-eGFP) and HOPX OE iPSC lines. (B) Quantitative PCR analysis of HOPX transcript abundance in control vs HOPX OE iPSCs. (C) Immunohistochemistry showing nuclear localization of HOPX-GFP in cardiomyocytes. (D) Cell size analysis showed that HOPX OE treated hiPSC-CMs led to a significant increase in area. (E-G) Volcano plot (E), quantification of DE genes (F), and gene ontology analysis (G) of significantly differentially expressed genes (−1<log2FC<1; padj > 0.05) identified by RNA-seq of control vs HOPX OE cardiomyocytes. (H) Genes known to govern hypertrophy showing IGF1 as the most significantly upregulated hypertrophic gene in HOPX OE vs control cells. For heat maps, data are presented as Log10 transformed relative gene expression normalized to HPRT. NLS: nuclear localization signal, eGFP: enhanced green fluorescent protein. Scale bars = 100 μm. * P <0.05 by t test. See also Table S5.
Figure 6.
Figure 6.. HOPX Functionally Governs Cardiac Hypertrophy Through the Distal Transcriptional Start Site
(A) Schematic of in vitro directed differentiation of hPSCs with re-plating at day 10 and analysis at day 15. (B-C) Representative images (B) and quantification (C) of morphometric changes during replating including cell area and circularity. (D) Quantitative PCR analysis of a selected panel of hypertrophic genes differentially expressed in the context of replating cardiomyocytes. HD: High density monolayer. (E-F) Quantitative PCR analysis showing significant increases in HOPX (n = 5–8 biological replicates per condition from 3–4 experiments) (E) among a range of other cardiac transcription factors and myofilament genes (n = 6–8 biological replicates per condition from 3 experiments) (F) involved in cardiomyocyte maturation in replated cardiomyocytes compared to controls. (G) Immunohistochemistry of HOPX-tdTomato reporter cells showing uniform expression of HOPX in α- actinin+ replated cardiomyocytes. ((H) Treatment with the hypertrophic signaling molecule endothelin-1 (ET1) significantly increases HOPX expression. (I) UCSC genome browser analysis of transcript variants mapped to the HOPX locus, the position of guide RNAs blocking the proximal (g1) or distal (g4) TSS, and position of qPCR primers amplifying different exons of the HOPX locus. (J-M) Analysis of gene expression in control high density monolayer cells vs replated cells and HOPX KD replated cells by quantitative PCR for various exons of the HOPX locus as outlined in panel H (J), genes governing cardiomyocyte hypertrophy (K), cardiac myofilament genes (L), and cardiac transcription factors (M). (N) Morphometric analysis of cell area in control vs HOPX KD cells over 64 hrs of replating. (O) Schematic lineage tree showing fate choices governed by HOPX during cardiac directed differentiation and a proposed mechanism whereby hypertrophic signaling is identified as a stimulus required for expression of HOPX during in vitro differentiation and showing that HOPX engages with cardiomyocyte hypertrophic growth through its distal transcriptional start site. For heat maps, data are presented as LogJ0 transformed relative gene expression normalized to HPRT. * P < 0.05. See also Figure S6 and Table S6.

References

    1. Akaike H (1998). Information theory and an extension of the maximum likelihood principle (Springer; ).
    1. Alexa A, Rahnenführer J, and Lengauer T (2006). Improved scoring of functional groups from gene expression data by decorrelating GO graph structure. Bioinformatics 22, 1600–1607. - PubMed
    1. Anders S, and Huber W (2010). Differential expression analysis for sequence count data. Genome Biol 11, R106. - PMC - PubMed
    1. Anders S, Pyl PT, and Huber W (2015). HTSeq--a Python framework to work with high-throughput sequencing data. Bioinformatics 31, 166–169. - PMC - PubMed
    1. Arrington CB, Dowse BR, Bleyl SB, and Bowles NE (2012). Non-synonymous variants in pre-B cell leukemia homeobox (PBX) genes are associated with congenital heart defects. Eur J Med Genet 55, 235–237. - PMC - PubMed

Publication types

MeSH terms