. 2019 Mar;15(3):510-526.
doi: 10.1080/15548627.2018.1532259. Epub 2018 Oct 13.

PRKN-regulated mitophagy and cellular senescence during COPD pathogenesis

Affiliations

PRKN-regulated mitophagy and cellular senescence during COPD pathogenesis

Jun Araya et al. Autophagy. 2019 Mar.

Abstract

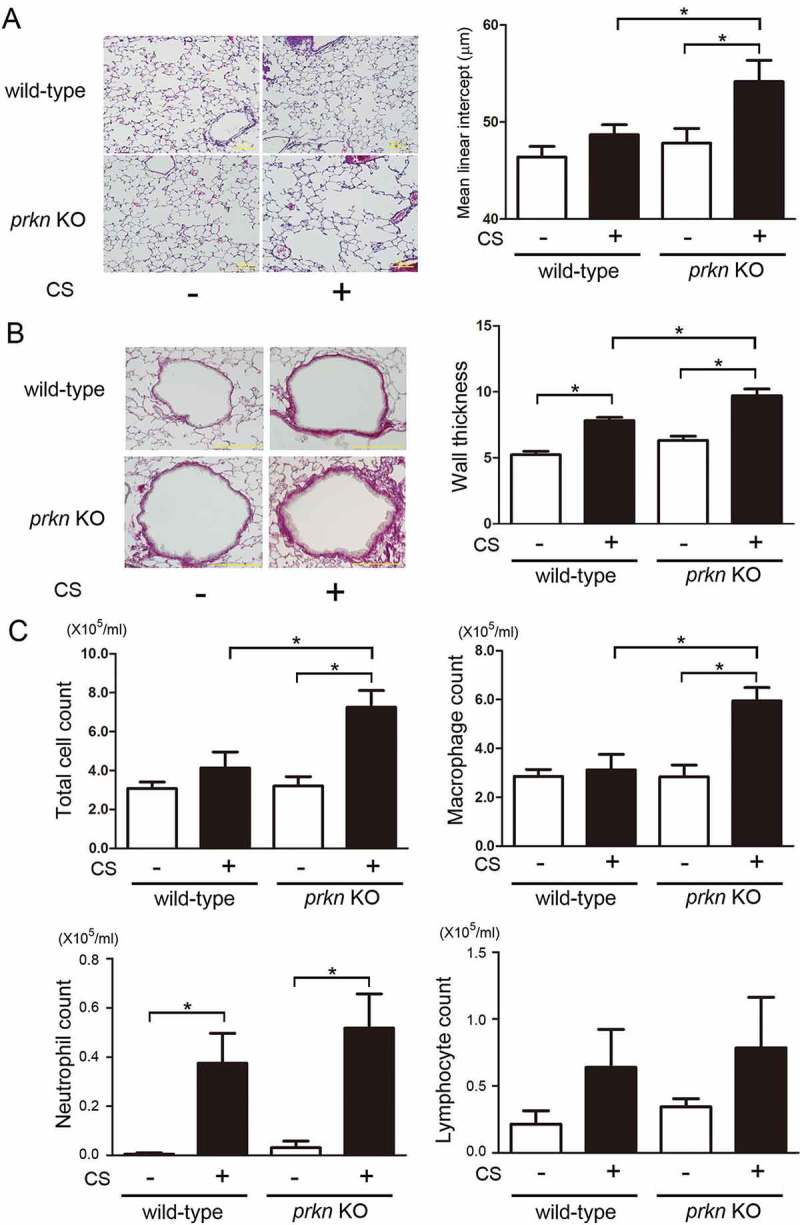
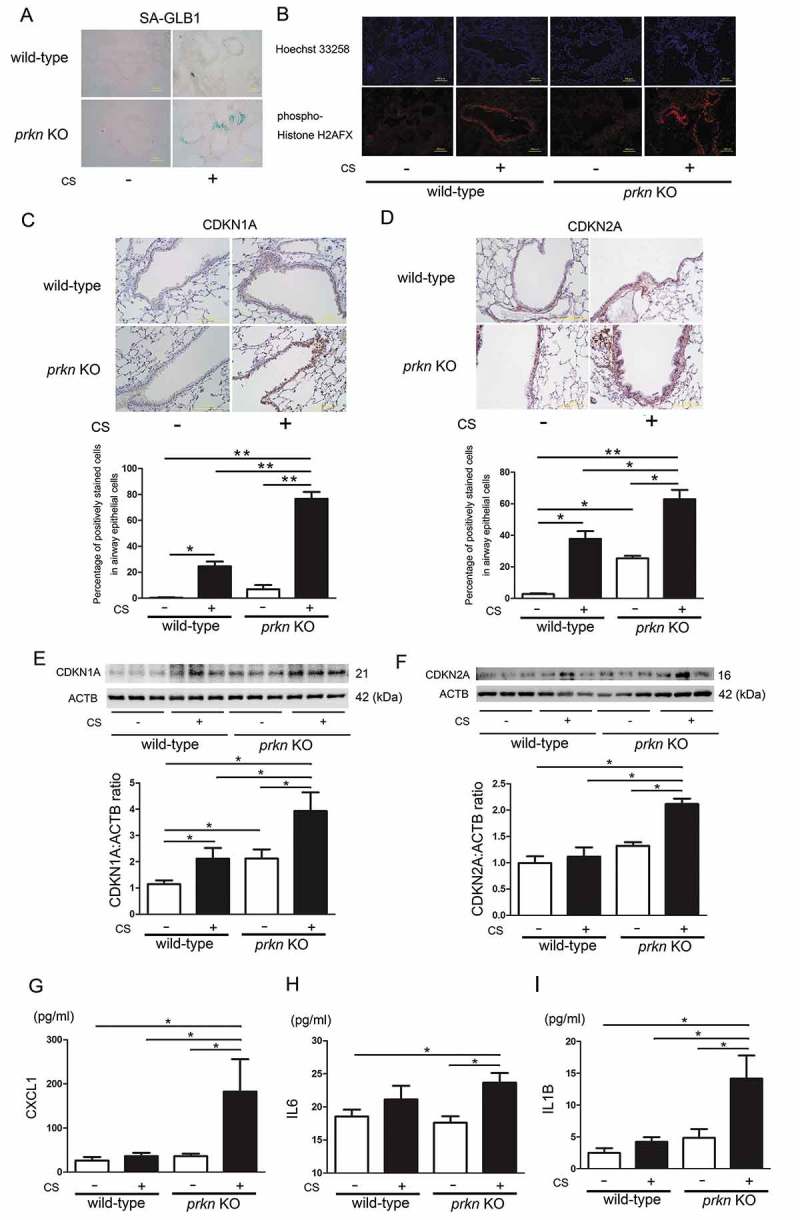
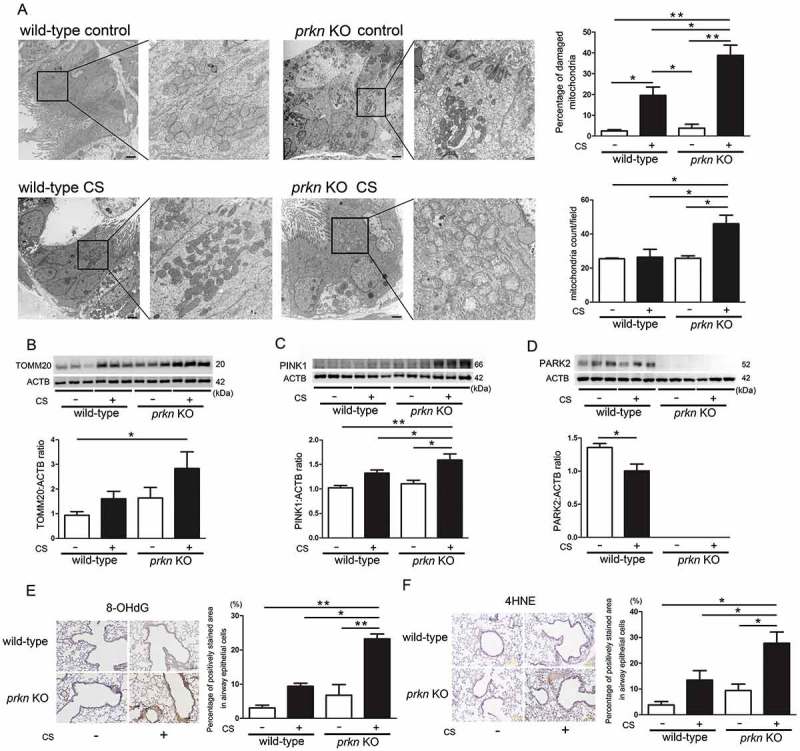
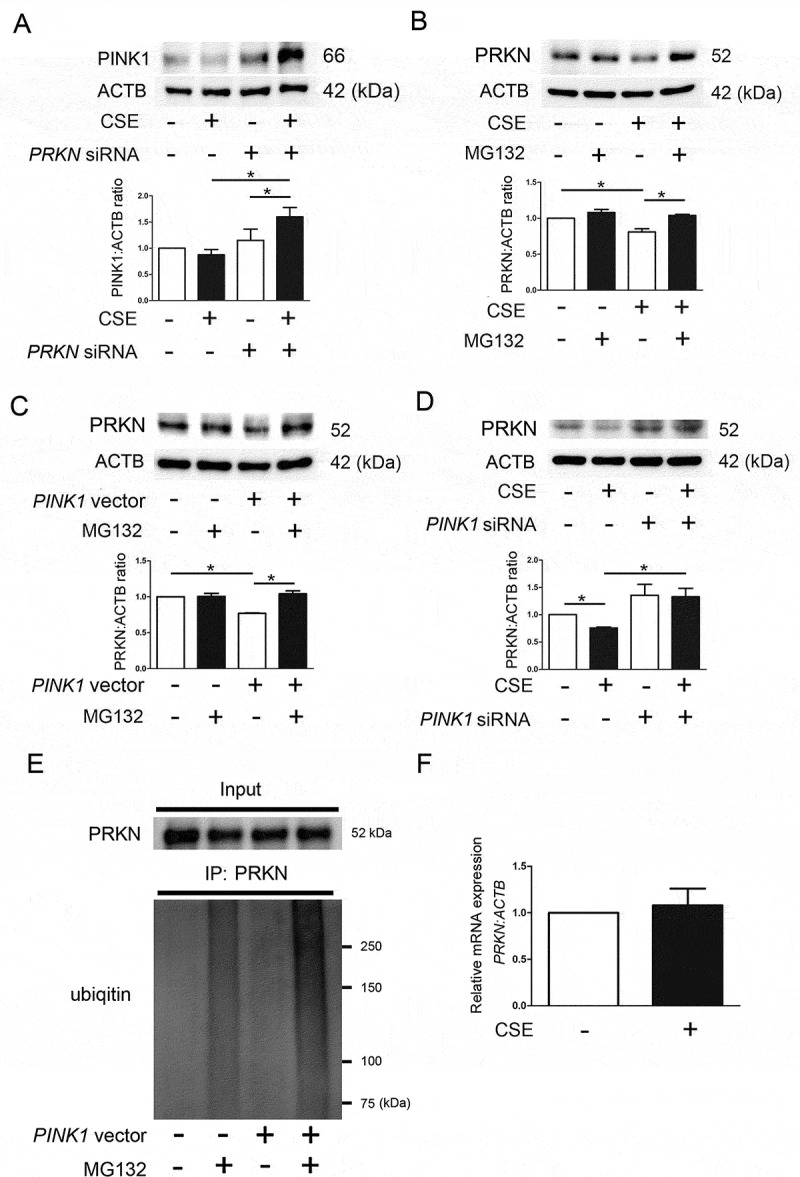
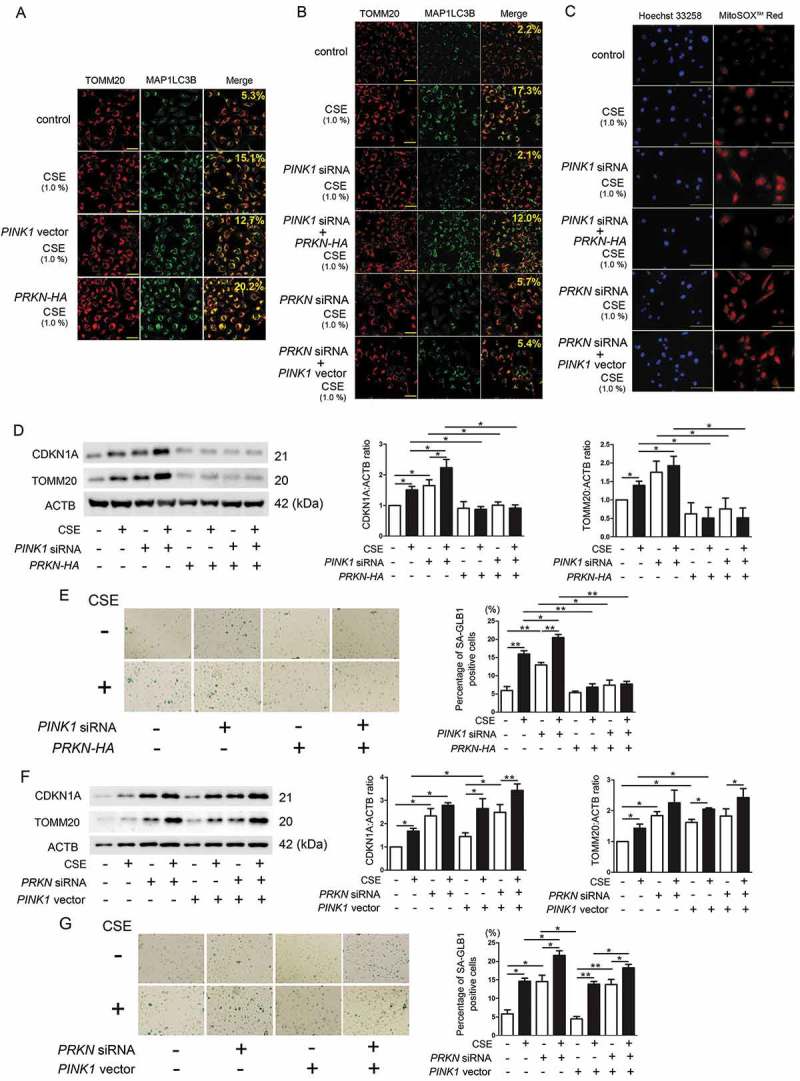
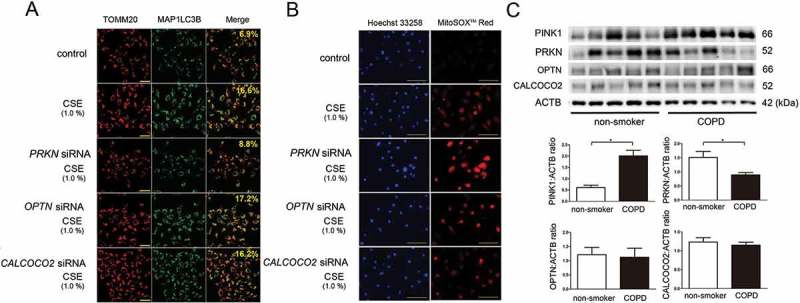
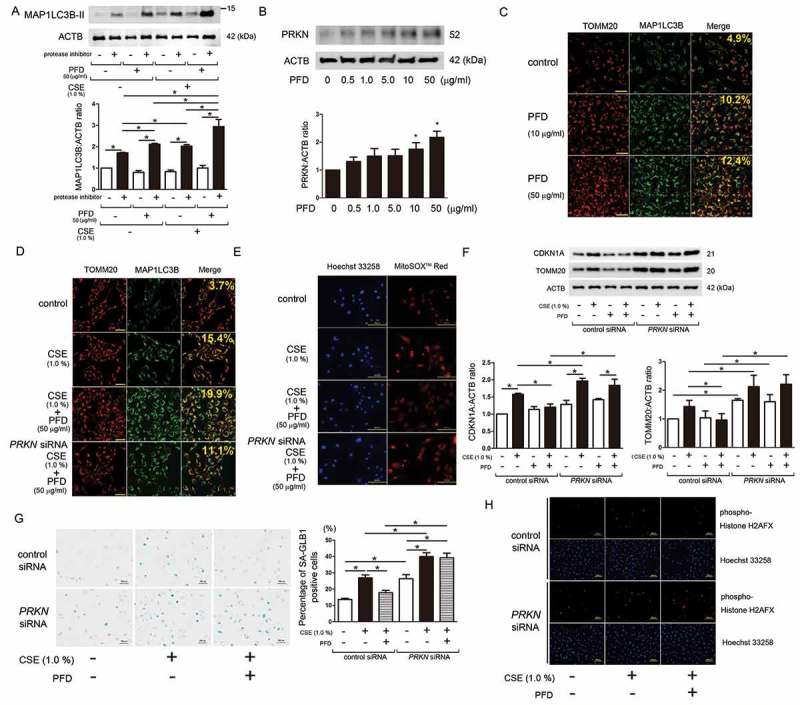
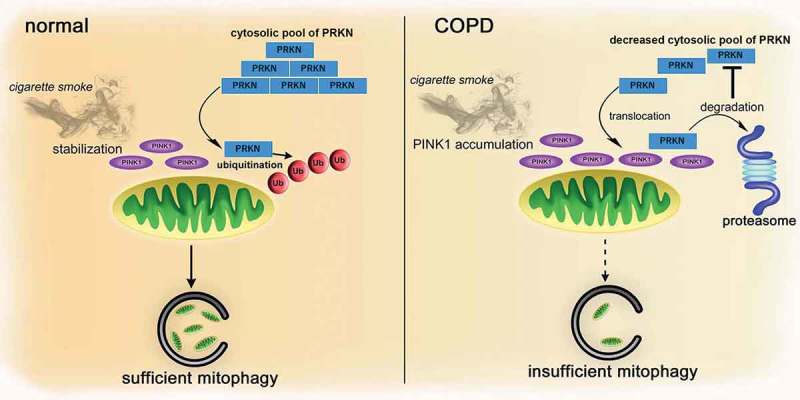
Cigarette smoke (CS)-induced accumulation of mitochondrial damage has been widely implicated in chronic obstructive pulmonary disease (COPD) pathogenesis. Mitophagy plays a crucial role in eliminating damaged mitochondria, and is governed by the PINK1 (PTEN induced putative protein kinase 1)-PRKN (parkin RBR E3 ubiquitin protein ligase) pathway. Although both increased PINK1 and reduced PRKN have been implicated in COPD pathogenesis in association with mitophagy, there are conflicting reports for the role of mitophagy in COPD progression. To clarify the involvement of PRKN-regulated mitophagy in COPD pathogenesis, prkn knockout (KO) mouse models were used. To illuminate how PINK1 and PRKN regulate mitophagy in relation to CS-induced mitochondrial damage and cellular senescence, overexpression and knockdown experiments were performed in airway epithelial cells (AEC). In comparison to wild-type mice, prkn KO mice demonstrated enhanced airway wall thickening with emphysematous changes following CS exposure. AEC in CS-exposed prkn KO mice showed accumulation of damaged mitochondria and increased oxidative modifications accompanied by accelerated cellular senescence. In vitro experiments showed PRKN overexpression was sufficient to induce mitophagy during CSE exposure even in the setting of reduced PINK1 protein levels, resulting in attenuation of mitochondrial ROS production and cellular senescence. Conversely PINK1 overexpression failed to recover impaired mitophagy caused by PRKN knockdown, indicating that PRKN protein levels can be the rate-limiting factor in PINK1-PRKN-mediated mitophagy during CSE exposure. These results suggest that PRKN levels may play a pivotal role in COPD pathogenesis by regulating mitophagy, suggesting that PRKN induction could mitigate the progression of COPD. Abbreviations: AD: Alzheimer disease; AEC: airway epithelial cells; BALF: bronchoalveolar lavage fluid; AKT: AKT serine/threonine kinase; CALCOCO2/NDP52: calcium binding and coiled-coil domain 2; CDKN1A: cyclin dependent kinase inhibitor 1A; CDKN2A: cyclin dependent kinase inhibitor 2A; COPD: chronic obstructive pulmonary disease; CS: cigarette smoke; CSE: CS extract; CXCL1: C-X-C motif chemokine ligand 1; CXCL8: C-X-C motif chemokine ligand 8; HBEC: human bronchial epithelial cells; 4-HNE: 4-hydroxynonenal; IL: interleukin; KO: knockout; LF: lung fibroblasts; LPS: lipopolysaccharide; MAP1LC3/LC3: microtubule associated protein 1 light chain 3; MTOR: mechanistic target of rapamycin kinase; 8-OHdG: 8-hydroxy-2'-deoxyguanosine; OPTN: optineurin; PRKN: parkin RBR E3 ubiquitin protein ligase; PCD: programmed cell death; PFD: pirfenidone; PIK3C: phosphatidylinositol-4:5-bisphosphate 3-kinase catalytic subunit; PINK1: PTEN induced putative kinase 1; PTEN: phosphatase and tensin homolog; RA: rheumatoid arthritis; ROS: reactive oxygen species; SA-GLB1/β-Gal: senescence-associated-galactosidase, beta 1; SASP: senescence-associated secretory phenotype; SNP: single nucleotide polymorphism; TNF: tumor necrosis factor.

Keywords: COPD; Cellular senescence; PINK1; PRKN; mitophagy.


Figures

Figure 1.
Figure 1.
Effect of long-term cigarette smoke exposure on prkn knockout mice. (a) Photomicrographs of hematoxylin and eosin staining in control-air- and cigarette-smoke- (CS) exposed mouse lungs. Bar: 100 µm. Right panel shows the average (±SEM) of mean liner intercept by using Image J. Open bar is control-air- and filled bar is CS-exposed. Treatment groups were composed of control-air-exposed wild-type mice (n = 9), CS-exposed wild-type mice (n = 6), control-air-exposed prkn KO mice (n = 5), CS-exposed prkn KO mice (n = 7). All groups exposed for 6 months. *P < 0.05, by ANOVA and Tukey post-hoc test. (b) Photomicrographs of PSR staining in control-air- and CS-exposed mouse lungs. Bar: 100 µm. (c) Cell counts in bronchoalveolar lavage fluid (BALF). Treatment groups were composed of the same number of mice (n = 4). *P < 0.05, by ANOVA and Tukey post-hoc test.
Figure 2.
Figure 2.
Long-term cigarette smoke exposure induces accelerated cellular senescence in prkn knockout mice. (a) Photomicrographs of GLB1 staining of control-air- and CS-exposed mouse lungs. (b) Photographs of immunofluorescent staining of phospho-Histone H2AFX (Ser139) in control-air- and CS-exposed mouse lungs. Bar: 100 µm. (c) Immunohistochemical staining of CDKN1A in control-air- and CS-exposed mouse lungs. Bar: 100 µm. The lower panel is the percentage (average ± SEM) of positively stained airway epithelial cells. *P < 0.05, **P < 0.001, by ANOVA and Tukey post-hoc test. (d) Immunohistochemical staining of CDKN2A in control-air- and CS-exposed mouse lungs. Bar: 100 μm. The lower panel is the percentage (average ± SEM) of positively stained airway epithelial cells. *P < 0.05, **P < 0.001, by ANOVA and Tukey post-hoc test. (e) WB using anti- CDKN1A and anti-ACTB antibodies, of lung homogenates from control-air- and CS-exposed mice for 6 months. The lower panel is the average (±SEM) taken from densitometric analysis of WB. Treatment groups were composed of control-air-exposed wild-type mice (n = 10), CS-exposed wild-type mice (n = 9), control-air-exposed prkn KO mice (n = 8), CS-exposed prkn KO mice (n = 9) *P < 0.05, by ANOVA and Tukey post-hoc test. All groups exposed for 6 months. (f) WB using anti- CDKN2A and anti-ACTB antibodies, of lung homogenates from control-air- and CS-exposed mice. The lower panel is the average (±SEM) taken from densitometric analysis of WB. Treatment groups were composed of control-air-exposed wild-type mice (n = 9), CS-exposed wild-type mice (n = 9), control-air-exposed prkn KO mice (n = 8), CS-exposed prkn KO mice (n = 9) *P < 0.05, by ANOVA and Tukey post-hoc test. (g) ELISA showing CXCL1 in lung homogenates from control-air- and CS-exposed mice. Shown is the average (±SEM). *P < 0.05, by ANOVA and Tukey post-hoc test. (h) ELISA showing IL6 in lung homogenates from control-air- and CS-exposed mice. Shown is the average (±SEM). *P < 0.05, by ANOVA and Tukey post-hoc test. (i) ELISA showing IL1B in lung homogenates from control air and CS-exposed mice. Shown is the average (±SEM). *P < 0.05, by ANOVA and Tukey post-hoc test.
Figure 3.
Figure 3.
Alteration of mitochondrial structure, mitochondrial mass, and oxidative modifications in prkn knockout mice after long-term cigarette smoke exposure. (a) Electron microscopy detection of mitochondria in airway epithelial cells with cilia of control-air- and CS-exposed mouse lungs. Bar: 2 µm. Shown in upper panel is percentage of damaged mitochondria (average ± SEM) taken from 10 image fields (10,000 X) for each sample (n = 4 in each group). Shown in the lower panel is average (±SEM) of mitochondrial counts taken from 10 image fields (10,000 X) for each sample (n = 4 in each group). *P < 0.05, **P < 0.001, by ANOVA and Bonferroni post-hoc test. (b) WB using anti-TOMM20 and anti-ACTB antibodies, of lung homogenates from control-air- and CS-exposed mice for 6 months. The lower panel is the average (±SEM) taken from densitometric analysis of WB. Treatment groups were composed of control-air-exposed wild-type mice (n = 10), CS-exposed wild-type mice (n = 9), control-air-exposed prkn KO mice (n = 8), CS-exposed prkn KO mice (n = 9) *P < 0.05, by ANOVA and Tukey post-hoc test. (c) WB using anti-PINK1 and anti-ACTB antibodies, of lung homogenates from control-air- and CS-exposed mice for 6 months. The lower panel is the average (±SEM) taken from densitometric analysis of WB. *P < 0.05, by ANOVA and Tukey post-hoc test. (d) WB using anti-PRKN and anti-ACTB antibodies, of lung homogenates from control-air- and CS-exposed mice for 6 months. The lower panel is the average (±SEM) taken from densitometric analysis of WB. *P < 0.05, by unpaired Student t test. (e) Immunohistochemical staining of 8-hydroxy-2-deoxyguanosine (8-OHdG), oxidized derivative of deoxyguanosine in control-air- and CS-exposed mouse lungs. Bar: 100 µm. Shown in the right panel is percentage of positively stained areas in airway epithelial cells (average ± SEM) taken from 10 image fields (200X) for each sample (n = 4 in each group). *P < 0.05, **P < 0.001, by ANOVA and Bonferroni post-hoc test. (f) Immunohistochemical staining of 4-hydroxy-2-nonenal (4-HNE) of lipid peroxidation in control-air- and CS-exposed mouse lungs. Bar: 100 μm. Shown in the right panel is percentage of positively stained areas in airway epithelial cells (average ± SEM) taken from 10 image fields (200X) for each sample (n = 4 in each group). *P < 0.05, **P < 0.001, by ANOVA and Bonferroni post-hoc test.
Figure 4.
Figure 4.
PINK1 regulates PRKN protein levels through proteasomal degradation in HBEC. (a) WB using anti-PINK1 and ACTB antibodies. HBEC were transfected with control siRNA or PRKN siRNA. CSE (1%) treatment was started 48 h post-transfection and protein samples were collected after 48-h treatment. Shown is a representative experiment of 4 showing similar results. The lower panel is the average (±SEM) relative increase in PINK1 normalized to ACTB, which are taken from densitometric analysis of WB from 4 independent experiments. *< 0.05, by paired Student t test. (b) WB using anti-PRKN and ACTB antibodies. HBEC were treated with CSE (1%) for 24 h. MG132 (10 µM) treatment was started 6 h before collecting cell lysates. Shown is a representative experiment of 4 showing similar results. The lower panel is the average (±SEM) relative increase in PRKN normalized to ACTB, which are taken from densitometric analysis of WB from 4 independent experiments. *< 0.05, by paired Student t test. (c) HBEC were transfected with control vector or PINK1 vector. MG132 treatment was started 48 h post-transfection and protein samples were collected after 6-h treatment. Shown is a representative experiment of 5 showing similar results. The lower panel is the average (±SEM) relative increase in PRKN normalized to ACTB, which are taken from densitometric analysis of WB from 5 independent experiments. *< 0.05, by paired Student t test. (d) HBEC were transfected with control siRNA or PINK1 siRNA. CSE (1%) treatment was started 48 h post-transfection and protein samples were collected after 48-h treatment. Shown is a representative experiment of 4 showing similar results. The lower panel is the average (±SEM) relative increase in PRKN normalized to ACTB, which are taken from densitometric analysis of WB from 4 independent experiments. *< 0.05, by paired Student t test. (e) Immunoprecipitation for detecting ubiquitinated PRKN. Cell lysates were collected HBEC treated with MG132 (10 ng/ml) for 6 h and treatment was started 48 h post-transfection with control or PINK1 vector. Immunoprecipitation was performed by using anti-PRKN and WB using an anti-ubiquitin antibody was performed. Shown is a representative experiment of 3 showing similar results. (f) HBEC were treated with CSE (1%) and mRNA samples were collected after treatment for 48 h. Real time-PCR was performed using primers to PRKN or ACTB, as a control. PRKN mRNA expression was normalized to ACTB. Shown is the fold increase (±SEM) relative to control treated cells (n = 3).
Figure 5.
Figure 5.
Dominant role of PRKN in the regulation of CSE-induced mitophagy. (a) Colocalization analysis of confocal laser scanning microscopy images of TOMM20 staining and MAP1LC3B staining. BEAS-2B cells were transfected with control vector, PINK1 vector, or PRKN-HA vector. CSE (1%) treatment was started 48 h post-transfection. BafA1 (20 nM) treatment was started 6 h before fixation and BEAS-2B cells were fixed after 24-h treatment with CSE. Bar: 100 μm. Shown percentage in merged image was calculated by dividing yellow intensity of mitophagy area by red intensity of mitochondrial area. (b) Colocalization analysis of TOMM20 staining and MAP1LC3B staining. BEAS-2B cells were transfected with the indicated combination of siRNA and expression vector, respectively. Bar: 100 µm. Shown percentage in merged image was calculated by dividing yellow intensity of mitophagy area by red intensity of mitochondrial area. (c) Photographs of Hoechst 33258 and MitoSOX Red fluorescence staining. HBEC were transfected with the indicated combination of siRNA and expression vector, respectively. CSE (1%) treatment was started 48 h post-transfection. HBEC were fixed after 24-h treatment with CSE. Bar: 100 µm. (d, f) WB using anti-CDKN1A, anti-TOMM20, and ACTB antibodies. HBEC were transfected with the indicated combination of siRNA and expression vector, respectively. CSE (1%) treatment was started 48 h post-transfection and protein samples were collected after 48-h treatment. Shown is a representative experiment of 4 showing similar results. The middle panel is the average (±SEM) relative increase in CDKN1A normalized to ACTB and the right panel is the average (± SEM) relative increase in TOMM20 normalized to ACTB, which are taken from densitometric analysis of WB from 4 independent experiments. *< 0.05, by paired Student t test. (e, g) Photographs of senescence associated β-galactosidase (GLB1) staining in HBEC. Shown in right panel is the percentage (±SEM) of GLB1-positive cells from 5 independent experiments. *< 0.05. **< 0.001 by paired Student t test.
Figure 6.
Figure 6.
Effect of OPTN and CALCOCO2 knockdown on CSE-induced mitophagy. (a) Colocalization analysis of confocal laser scanning microscopy images of TOMM20 staining and MAP1LC3B staining. BEAS-2B cells were transfected with control siRNA, PRKN siRNA, OPTN (optineurin) siRNA, or CALCOCO2 (calcium binding and coiled-coil domain 2) siRNA. CSE (1%) treatment was started 48 h post-transfection. BafA1 (20 nM) treatment was started 6 h before fixation and BEAS-2B cells were fixed after 24-h treatment with CSE. Bar: 100 µm. Shown percentage in merged image was calculated by dividing yellow intensity of mitophagy area by red intensity of mitochondrial area. (b) Photographs of Hoechst 33258 and MitoSOX Red fluorescence staining. HBEC were transfected with the indicated siRNA, respectively. CSE (1%) treatment was started 48 h post-transfection. HBEC were fixed after 24-h treatment with CSE. Bar: 100 μm. (c) WB using anti-PINK1, anti-PRKN, anti-OPTN, anti-CALCOCO2, and anti-ACTB antibodies, of lung homogenates from non-smoker and COPD patients. The lower panel is the average (±SEM) taken from densitometric analysis of WB. Open bar is non-smoker (n = 5) and filled bar is COPD (n = 5). *< 0.05, by Unpaired Student t test.
Figure 7.
Figure 7.
Effect of pirfenidone on autophagy/mitophagy and CSE-induced cellular senescence. (a) WB using anti- MAP1LC3B and anti-ACTB antibodies, of cell lysates from CSE treated HBEC in the presence or absence of pirfenidone (PFD) (50 µg/ml). Protein samples were collected after 24-h treatment with CSE and PFD. Protease inhibitor (E64d 10 μg/ml, pepstatin A 10 μg/ml) treatment was started 6 h before collecting cell lysates. In the lower panel is the average (±SEM) taken from 5 independent experiments shown as relative expression. *< 0.05, by paired Student t test. (b) WB using anti-PRKN and anti-ACTB antibodies, of cell lysates from HBEC treated with the indicated concentration of PFD. Protein samples were collected after 2-h treatment with PFD. In the lower panel is the average (±SEM) taken from 7 independent experiments shown as relative expression. *< 0.05, by paired Student t test. (c) Colocalization analysis of confocal laser scanning microscopy images of TOMM20 staining and MAP1LC3B staining. BEAS-2B cells were treated with the indicated concentration of PFD. BafA1 (20 nM) treatment was started 6 h before fixation and BEAS-2B cells were fixed after 24-h treatment with PFD. Bar: 100 µm Shown percentage in merged image was calculated by dividing yellow intensity of mitophagy area by red intensity of mitochondrial area. (d) Colocalization analysis of confocal laser scanning microscopy images of TOMM20 staining and MAP1LC3B staining. BEAS-2B cells were transfected with control siRNA or PRKN siRNA. CSE (1%) and PFD (50 µg/ml) treatment was started 48 h post-transfection. BafA1 (20 nM) treatment was started 6 h before fixation and BEAS-2B cells were fixed after 24-h treatment with CSE and PFD. Bar: 100 μm. Shown percentage in merged image was calculated by dividing yellow intensity of mitophagy area by red intensity of mitochondrial area. (e) Photographs of Hoechst 33258 and MitoSOX Red fluorescence staining. HBEC were transfected with control siRNA or PRKN siRNA. CSE (1%) and PFD (50 µg/ml) treatment was started 48 h post-transfection and HBEC were fixed after 24-h treatment. Bar: 100 µm (f) WB using anti-CDKN1A, anti-TOMM20, and ACTB antibodies. HBEC were transfected with control siRNA or PRKN siRNA. CSE (1%) and PFD (50 µg/ml) treatment was started 48 h post-transfection and protein samples were collected after 48-h treatment. Shown is a representative experiment of 3 showing similar results. In the lower panels are the average (±SEM) taken from 3 independent experiments shown as relative expression. *< 0.05, by paired Student t test. (g) Photomicrographs of GLB1 staining of control siRNA or PRKN siRNA transfected HBEC. CSE (1%) and PFD (50 µg/ml) treatment was started 48 h post-transfection and HBEC were treated for 48 h. Bar: 500 µm. The right panel shows the percentage (±SEM) of GLB1-positive cells from 5 independent experiments. *< 0.05, by paired Student t test. (h) Photographs of immunofluorescent staining of phospho-Histone H2AFX (Ser139) in control siRNA and PRKN siRNA transfected HBEC. CSE (1%) and PFD (50 µg/ml) treatment was started 48 h post-transfection and HBEC were fixed after 48-h treatment. Bar: 100 µm.
Figure 8.
Figure 8.
Hypothetical model of involvement of PRKN in the regulation of mitophagy during smoking stress in COPD pathogenesis. In normal conditions, CS-induced mitochondrial damage stabilizes PINK1 on the mitochondrial outer membrane, which recruits PRKN to the mitochondria from an abundant cytosolic pool, resulting in sufficient mitophagy, thus preventing accumulation of damaged mitochondria and accelerated cellular senescence. In contrast, in COPD, insufficient mitophagy triggers accumulation of damaged mitochondria with stabilized PINK1, which can be attributed to a decreased cytosolic PRKN pool, leading to further PRKN reduction by PINK1-mediated proteasomal degradation. We speculate the existence of a feedback loop of PINK1 accumulation and PRKN reduction linked to persistently decreased PRKN accompanied by insufficient mitophagy in COPD pathogenesis.

References

    1. Araya J, Cambier S, Markovics JA, et al. Squamous metaplasia amplifies pathologic epithelial-mesenchymal interactions in COPD patients. J Clin Invest. 2007. November;117(11):3551–3562. PubMed PMID: 17965775; PubMed Central PMCID: PMCPMC2040320. - PMC - PubMed
    1. van der Toorn M, Slebos DJ, de Bruin HG, et al. Cigarette smoke-induced blockade of the mitochondrial respiratory chain switches lung epithelial cell apoptosis into necrosis. Am J Physiol Lung Cell Mol Physiol. 2007. May;292(5):L1211–218. PubMed PMID: 17209140. - PubMed
    1. van der Toorn M, Rezayat D, Kauffman HF, et al. Lipid-soluble components in cigarette smoke induce mitochondrial production of reactive oxygen species in lung epithelial cells. Am J Physiol Lung Cell Mol Physiol. 2009. July;297(1):L109–114. PubMed PMID: 19411310; PubMed Central PMCID: PMCPMC2711811. - PMC - PubMed
    1. Ahmad T, Sundar IK, Lerner CA, et al. Impaired mitophagy leads to cigarette smoke stress-induced cellular senescence: implications for chronic obstructive pulmonary disease. FASEB J. 2015. July;29(7):2912–2929. PubMed PMID: 25792665; PubMed Central PMCID: PMCPMC4478793. - PMC - PubMed
    1. Hara H, Araya J, Ito S, et al. Mitochondrial fragmentation in cigarette smoke-induced bronchial epithelial cell senescence. Am J Physiol Lung Cell Mol Physiol. 2013. November 15;305(10):L737–746. PubMed PMID: 24056969. - PubMed

Publication types

MeSH terms