. 2018 Oct 5;50(1):48.
doi: 10.1186/s12711-018-0405-y.

Genome-wide association scan for heterotic quantitative trait loci in multi-breed and crossbred beef cattle

Affiliations

Genome-wide association scan for heterotic quantitative trait loci in multi-breed and crossbred beef cattle

Everestus C Akanno et al. Genet Sel Evol. .

Abstract

Background: Heterosis has been suggested to be caused by dominance effects. We performed a joint genome-wide association analysis (GWAS) using data from multi-breed and crossbred beef cattle to identify single nucleotide polymorphisms (SNPs) with significant dominance effects associated with variation in growth and carcass traits and to understand the mode of action of these associations.

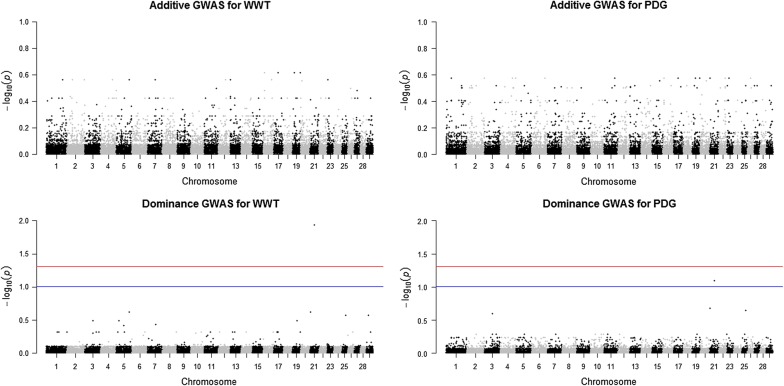
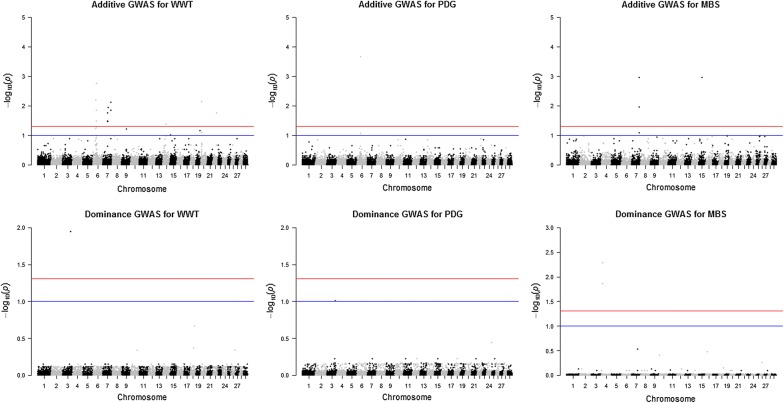
Methods: Illumina BovineSNP50 genotypes and phenotypes for 11 growth and carcass traits were available for 6796 multi-breed and crossbred beef cattle. After performing quality control, 42,610 SNPs and 6794 animals were used for further analyses. A single-SNP GWAS for the joint association of additive and dominance effects was conducted in purebred, crossbred, and combined datasets using the ASReml software. Genomic breed composition predicted from admixture analyses was included in the mixed effect model to account for possible population stratification and breed effects. A threshold of 10% genome-wide false discovery rate was applied to declare associations as significant. The significant SNPs with dominance association were mapped to their corresponding genes at 100 kb.

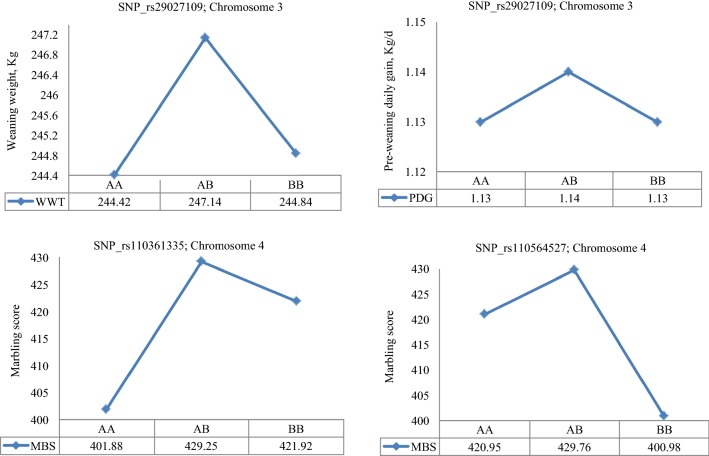
Results: Seven SNPs with significant dominance associations were detected for birth weight, weaning weight, pre-weaning daily gain, yearling weight and marbling score across the three datasets at a false discovery rate of 10%. These SNPs were located on bovine chromosomes 1, 3, 4, 6 and 21 and mapped to six putative candidate genes: U6atac, AGBL4, bta-mir-2888-1, REPIN1, ICA1 and NXPH1. These genes have interesting biological functions related to the regulation of gene expression, glucose and lipid metabolism and body fat mass. For most of the identified loci, we observed over-dominance association with the studied traits, such that the heterozygous individuals at any of these loci had greater genotypic values for the trait than either of the homozygous individuals.

Conclusions: Our results revealed very few regions with significant dominance genetic effects across all the traits studied in the three datasets used. Regarding the SNPs that were detected with dominance associations, further investigation is needed to determine their relevance in crossbreeding programs assuming that dominance effects are the main cause of (or contribute usefully to) heterosis.


Figures

Fig. 1
Fig. 1
Joint genome-wide association of additive and dominance SNP effects for weaning weight (WWT; left) and pre-weaning daily gain (PDG; right) evaluated in purebreds (n = 1467). The purebred group included individuals with more than 80% of Angus, Hereford and Charolais breed proportions, respectively. Significant SNPs were determined with a false discovery rate correction at 5% (red line) and 10% (blue line)
Fig. 2
Fig. 2
Joint genome-wide association of additive and dominance SNP effects for birth weight (BWT; left) and yearling weight (YWT; right) evaluated in crossbreds (n = 5327). The crossbred group included Kinsella composite, Beefbooster TX composite (www.beefbooster.com) and two and more way crosses involving Angus, Hereford, Charolais, Gelbvieh, Simmental, Limousin, and Piedmontese breeds. Significant SNPs were determined with a false discovery rate correction at 5% (red line) and 10% (blue line)
Fig. 3
Fig. 3
Joint genome-wide association of additive and dominance SNP effects for weaning weight (WWT; left), pre-weaning daily gain (PDG; center) and marbling score (MBS; right) evaluated in combined data (n = 6794). Significant SNPs were determined with a false discovery rate correction at 5% (red line) and 10% (blue line)
Fig. 4
Fig. 4
Least square means for the genotypic class of significant heterotic SNPs on BTA21 associated with weaning weight and pre-weaning daily gain in purebreds. Purebred group included individuals with more than 80% of Angus, Hereford and Charolais breed proportions, respectively
Fig. 5
Fig. 5
Least square means for the genotypic class of significant heterotic SNPs on BTA1, 6 and 4 associated with birth weight and yearling weight in crossbreds. The crossbred group included Kinsella composite, Beefbooster TX composite (www.beefbooster.com) and two-way or more crosses involving Angus, Hereford, Charolais, Gelbvieh, Simmental, Limousin, and Piedmontese breeds
Fig. 6
Fig. 6
Least square means for the genotypic class of significant heterotic SNPs on BTA3 and 4 associated with weaning weight, pre-weaning daily gain and carcass marbling score in combined data
Fig. 7
Fig. 7
Pair-wise epistatic interaction between the leading significant dominant SNPs and the rest of the SNPs across the genome evaluated in purebred, crossbred and combined data. Only additive x additive interaction was tested. Significant interactions were determined by false discovery rate correction at 5% (red line) and 10% (blue line)

References

    1. McCarthy MI, Abecasis GR, Cardon LR, Goldstein DB, Little J, Ioannidis JPA, et al. Genome-wide association studies for complex traits: consensus, uncertainty and challenges. Nat Rev Genet. 2008;9:356–369. doi: 10.1038/nrg2344. - DOI - PubMed
    1. Matukumalli LK, Lawley CT, Schnabel RD, Taylor JF, Allan MF, Heaton MP, et al. Development and characterization of a high density SNP genotyping assay for cattle. PLoS One. 2009;4:e5350. doi: 10.1371/journal.pone.0005350. - DOI - PMC - PubMed
    1. Saatchi M, Beever JE, Decker JE, Faulkner DB, Freetly HC, Hansen SL, et al. QTLs associated with dry matter intake, metabolic mid-test weight, growth and feed efficiency have little overlap across 4 beef cattle studies. BMC Genomics. 2014;15:1004. doi: 10.1186/1471-2164-15-1004. - DOI - PMC - PubMed
    1. Lu D, Sargolzaei M, Kelly M, Vander Voort G, Wang Z, Mandell I, et al. Genome-wide association analyses for carcass quality in crossbred beef cattle. BMC Genet. 2013;14:80. doi: 10.1186/1471-2156-14-80. - DOI - PMC - PubMed
    1. Akanno EC, Plastow G, Fitzsimmons C, Miller SP, Baron V, Ominski K, et al. Genome-wide association for heifer reproduction and calf performance traits in beef cattle. Genome. 2015;58:549–557. doi: 10.1139/gen-2015-0031. - DOI - PubMed