. 2018 Oct 5;37(1):245.
doi: 10.1186/s13046-018-0915-z.

Acidic microenvironment plays a key role in human melanoma progression through a sustained exosome mediated transfer of clinically relevant metastatic molecules

Affiliations

Acidic microenvironment plays a key role in human melanoma progression through a sustained exosome mediated transfer of clinically relevant metastatic molecules

Zaira Boussadia et al. J Exp Clin Cancer Res. .

Abstract

Background: Microenvironment cues involved in melanoma progression are largely unknown. Melanoma is highly influenced in its aggressive phenotype by the changes it determinates in its microenvironment, such as pH decrease, in turn influencing cancer cell invasiveness, progression and tissue remodelling through an abundant secretion of exosomes, dictating cancer strategy to the whole host. A role of exosomes in driving melanoma progression under microenvironmental acidity was never described.

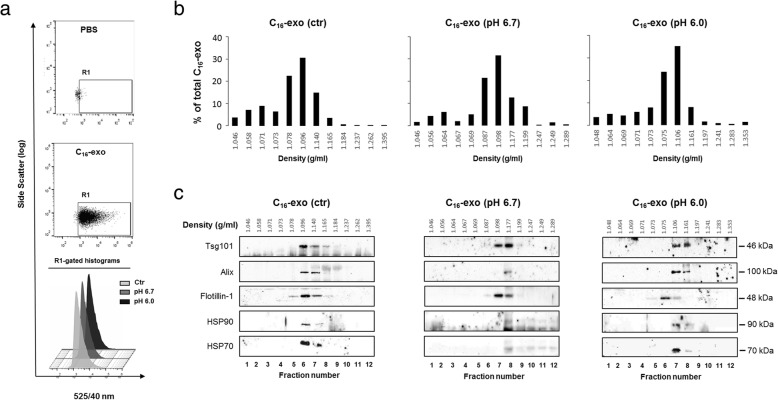
Methods: We studied four differently staged human melanoma lines, reflecting melanoma progression, under microenvironmental acidic pHs pressure ranging between pH 6.0-6.7. To estimate exosome secretion as a function of tumor stage and environmental pH, we applied a technique to generate native fluorescent exosomes characterized by vesicles integrity, size, density, markers expression, and quantifiable by direct FACS analysis. Functional roles of exosomes were tested in migration and invasion tests. Then we performed a comparative proteomic analysis of acid versus control exosomes to elucidate a specific signature involved in melanoma progression.

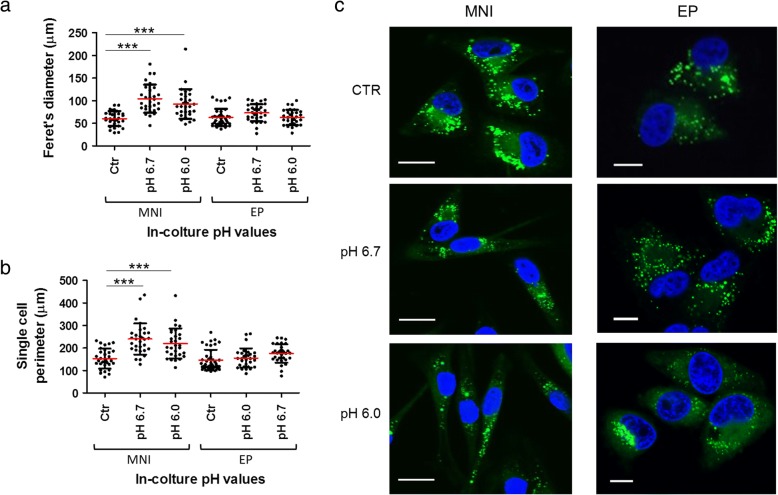
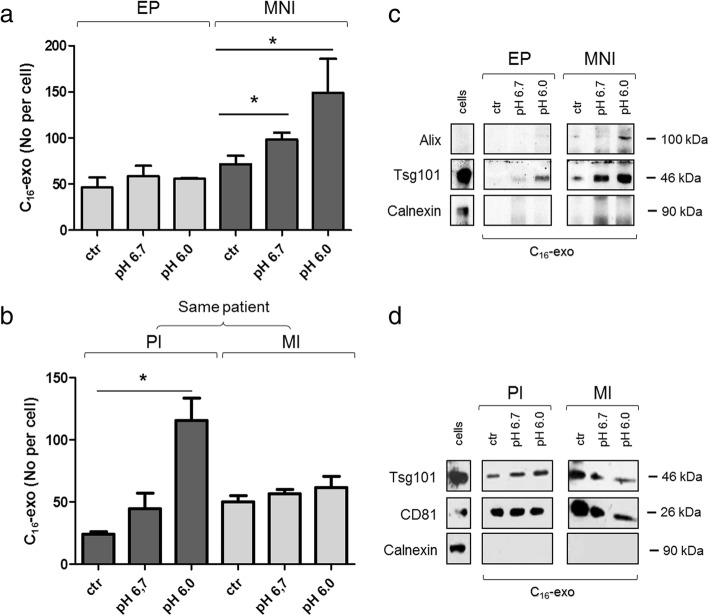
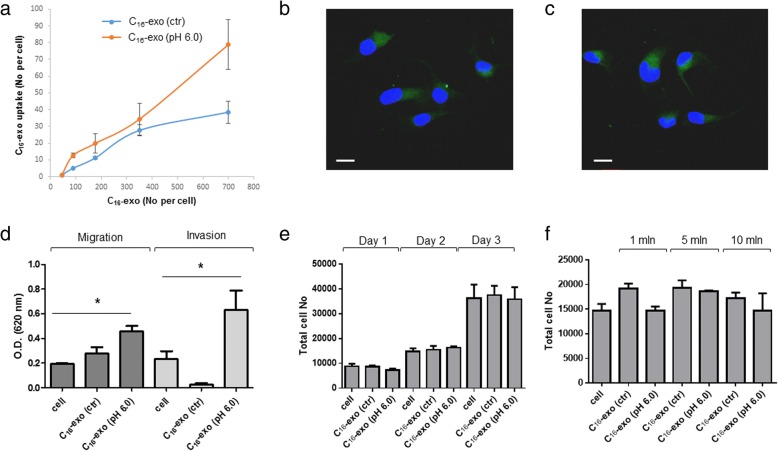
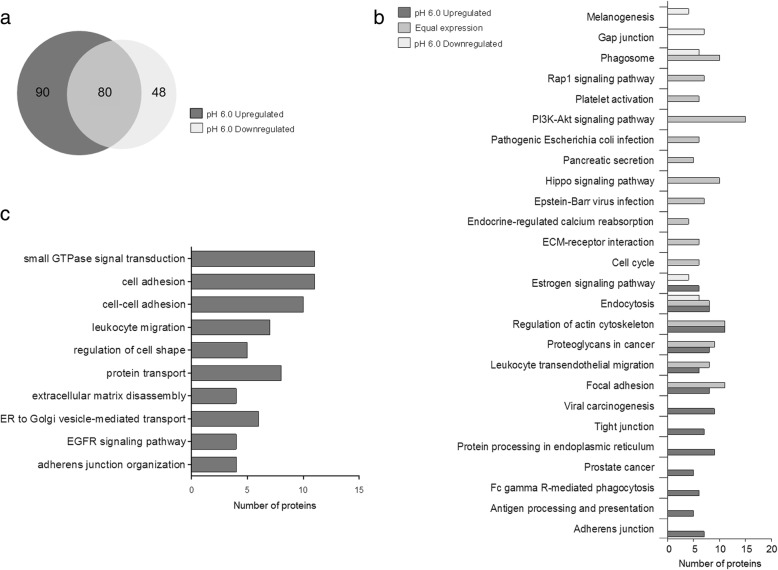
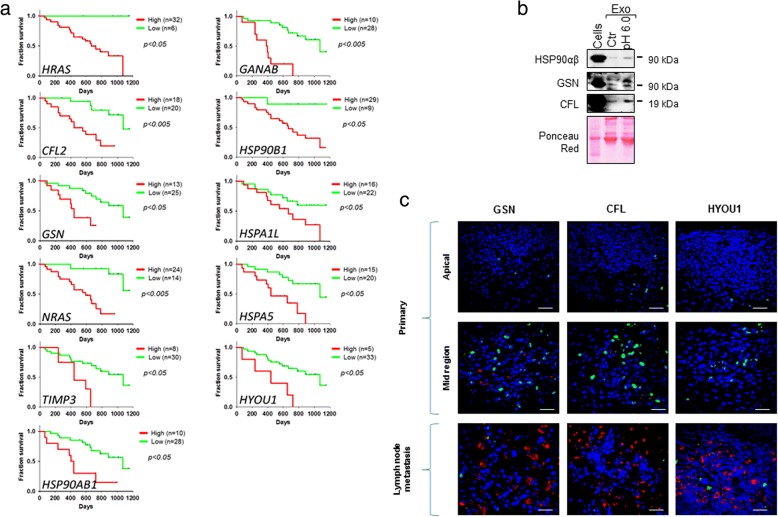
Results: We found that metastatic melanoma secretes a higher exosome amount than primary melanoma, and that acidic pH increases exosome secretion when melanoma is in an intermediate stage, i.e. metastatic non-invasive. We were thus able to show that acidic pH influences the intercellular cross-talk mediated by exosomes. In fact when exposed to exosomes produced in an acidic medium, pH naïve melanoma cells acquire migratory and invasive capacities likely due to transfer of metastatic exosomal proteins, favoring cell motility and angiogenesis. A Prognoscan-based meta-analysis study of proteins enriched in acidic exosomes, identified 11 genes (HRAS, GANAB, CFL2, HSP90B1, HSP90AB1, GSN, HSPA1L, NRAS, HSPA5, TIMP3, HYOU1), significantly correlating with poor prognosis, whose high expression was in part confirmed in bioptic samples of lymph node metastases.

Conclusions: A crucial step of melanoma progression does occur at melanoma intermediate -stage, when extracellular acidic pH induces an abundant release and intra-tumoral uptake of exosomes. Such exosomes are endowed with pro-invasive molecules of clinical relevance, which may provide a signature of melanoma advancement.

Keywords: Exosomes; Melanoma progression; Microenvironmental acidic pH; Tumor stage.


Conflict of interest statement

Ethics approval and consent to participate

The study was conducted in accordance with Good Clinical Practice Guidelines and the Declaration of Helsinki. The study was also approved by the IDI-IRCCS Ethics Committee (ID #407/1, 2013 and #407/2, 2016), and a written informed consent was obtained from all patients.

Consent for publication

Not applicable.

Competing interests

The authors declare that they have no competing interests.

Publisher’s Note

Springer Nature remains neutral with regard to jurisdictional claims in published maps and institutional affiliations.

Figures

Fig. 1
Fig. 1
Effect of pH treatments on MNI and EP morphology and C16 intracellular distribution. MNI and EP cells were cultured with standard (ctr), pH 6.7 or pH 6.0 culture media for 24 h. Analysis of cell elongation (a) and perimeter (b) was performed by the determination of Feret’s diameter and cell perimeter of each cell displayed in Additional file 4. c MNI and EP cells were labeled with C16 for 5 h and incubated at the indicated pHs for 24 h. Cells were afterwards fixed and analyzed by fluorescence under confocal microscopy. The nucleus was visualized with DAPI staining (blue). Scale bars, 10 μm. ***: p < 0.0001
Fig. 2
Fig. 2
FACS analysis of C16-exo and distribution on iodixanol gradient. a FACS analysis of C16-exo deriving from MNI cells cultivated with medium at different pHs To design the R1 region above instrument background noise only PBS was acquired (upper panel). Note that no events were acquired in this region. (mid panel) example of exosome population. (Lower panel) Histograms representing the green fluorescence intensity distribution of events gated in R1 regions of exosome samples recovered in control, pH 6.7 and pH 6.0 conditions b C16-exo (ctr) (2,5 × 108), C16-exo (pH 6.7) (1,8 × 108), C16-exo (pH 6.0) (2,5 × 108), were loaded at the bottom of iodixanol gradient and subjected to ultracentrifugation for 19 h. For each condition, 2 μl of resulting fractions were FACS counted and each fraction represented as percent of total C16-exo recovered. Fraction densities were determined by refractometry. c An equal volume of each fraction was analyzed for the indicated exosome markers by western blotting. Data shown are representative of three independent experiments
Fig. 3
Fig. 3
Analysis of C16-exo secreted in control or acidic conditions. a and b EP, MNI, PI and MI cells were treated with C16 (7 μm) for 5 h and then cultured in control or acid (pH 6.0 or pH 6.7) medium for 24 h. Hereafter conditioned medium was subjected to ultracentrifugation for exosome isolation. Fluorescent vesicles were then counted by FACS. The graph shows the number of secreted C16-exo per cell. c and d Western blot analysis of exosome for the presence of principal exosome markers (Alix, Tsg101 and CD81) and the absence of Calnexin, a marker of ER used as a negative control. Data shown are representative of three independent experiments. * p < 0.05
Fig. 4
Fig. 4
C16-exo uptake and functional assays. a MNI cells were labeled with C16 and incubated for 24 h with ctr or pH 6.0 medium. C16-exo (ctr) and (pH 6.0) were recovered and incubated at increasing doses for 2 h at 37 °C with MNI cells at pH 7.4. Cell fluorescence was analyzed by FACS. The number of incorporated exosomes per cell was calculated and represented in the graph. Points: mean ± S.D. (n = 4). b and c Confocal microscopy analysis of MNI cells after 2 h incubation with C16-exo (2 × 103 per cell) (ctr) (b) or (pH 6.0) (c). DAPI stains show the nucleus (blue). Green: C16-exo. Scale bars, 10 μm. d Migration and invasion assays of MNI cells (3.5 × 104) after incubation with (10 × 106) C16-exo, deriving from (ctr) or (pH 6.0) treated MNI cells. Migration and invasion were evaluated after 72 h of incubation by a colorimetric assay at 620 nm. * p < 0.05. e and f Cell viability was assayed by trypan blue exclusion of dead cells. MNI cells (2 × 103) were incubated with C16-exo (ctr), (pH 6.7), (pH 6.0) (5 × 106) and counted at the indicated days, or with 1 × 106, 5 × 106, 10 × 106 C16-exo (ctr), (pH 6.7), (pH 6.0) and counted after two days. Histograms: means ± S.D. (n = 3). Results indicate that in e and f the differences among ctr and pH 6.0 are not statistically significant
Fig. 5
Fig. 5
Proteome characterization by HPLC-MS/MS of control and pH 6.0 exosome obtained after ultracentrifugation. a Venn diagram depicting the overlap of upregulated and downregulated pH 6.0 proteins with respect to control condition. b Functional analysis of the downregulated, equally expressed and upregulated proteins at pH 6.0. Only over-represented metabolic pathways with P ≤ 10− 2 were considered. c GO enrichments of pH 6.0 upregulated proteins. Only over-represented categories with P ≤ 10− 2 were considered
Fig. 6
Fig. 6
Meta-analysis of significant metastatic upregulated proteins in acid exosomes through Prognoscan. a Kaplan-Meyer curves depicting the Overall Survival of metastatic melanoma patients with high (red lines) or low (green lines) expression of the genes listed in Table 1 that resulted statistically significant. Mentel-Cox p-values for each plot are showed. b Western blotting analysis of ctr and pH 6.0 exosomes (20 μg). Cell lysate was used as positive control. Expression of CFL, GSN and HSP90αβ is shown. Ponceau red is shown for equal exosome protein amount. c confocal immunofluorescence analysis with the indicated antibodies on primary (apical and mid region), and metastatic melanoma biopsies from the same patient. Ki67 labeling was used as internal control. Red, CFL, GSN, HYOU1; blue, DAPI; green, Ki67. Bar 50 μm

References

    1. Vaupel P, Kallinowski F, Okunieff P. Blood flow, oxygen and nutrient supply, and metabolic microenvironment of human tumors: a review. Cancer Res. 1989;49:6449–6465. - PubMed
    1. Wike-Hooley JL, Haveman J, Reinhold HS. The relevance of tumour pH to the treatment of malignant disease. Radiother Oncol. 1984;2:343–366. doi: 10.1016/S0167-8140(84)80077-8. - DOI - PubMed
    1. Fukamachi T, Ikeda S, Wang X, Saito H, Tagawa M, Kobayashi H. Gene expressions for signal transduction under acidic conditions. Genes (Basel) 2013;4:65–85. doi: 10.3390/genes4010065. - DOI - PMC - PubMed
    1. Moellering RE, Black KC, Krishnamurty C, Baggett BK, Stafford P, Rain M, et al. Acid treatment of melanoma cells selects for invasive phenotypes. Clin Exp Metastasis. 2008;25:411–425. doi: 10.1007/s10585-008-9145-7. - DOI - PubMed
    1. Rofstad EK, Mathiesen B, Kindem K, Galappathi K. Acidic extracellular pH promotes experimental metastasis of human melanoma cells in athymic nude mice. Cancer Res. 2006;66:6699–6707. doi: 10.1158/0008-5472.CAN-06-0983. - DOI - PubMed